Introduction
Uncovering and exploiting structure–property relationships has been the core of the science and application of materials since antiquity. Almost five millennia ago, it was discovered that forging—thereby controlling the microstructure of a piece of metal—imparted beneficial properties in addition to its composition. Since then, the introduction and control of defects in materials, ranging across all classes and applications, has been central to materials optimization. From precise dopants in semiconductors,Reference Tanenbaum and Mills1 to cold or hot working metals,Reference Jonas, Sellars and Tegart2 to doping of ceramics to boost electrical conductivity,Reference Ishihara, Matsuda and Takita3 to controlling crystallinity and polymer chemistry in plastics,Reference Harris and Lee4 the precise knowledge of material defects and our ability to control them is behind almost every material-based innovation.
Our ability to create and characterize materials struggles to keep pace with the application-driven need for innovation. Recent advances such as combinatorial thin-film synthesisReference Li, Savan, Kostka, Stein and Ludwig5 and computational materials discoveryReference Curtarolo, Hart, Nardelli, Mingo, Sanvito and Levy6 have dramatically accelerated our ability to design and synthesize new materials. Novel in situ techniques, such as micropillar compression,Reference Hosemann7,Reference Bei, Shim, George, Miller, Herbert and Pharr8 liquid-cell transmission electron microscopy (TEM), scanning electron microscopy (SEM),Reference De Jonge and Ross9 and x-ray diffraction and imaging techniquesReference Hofmann, Tarleton, Harder, Phillips, Ma, Clark, Robinson, Abbey, Liu and Beck10–Reference Ulvestad, Singer, Clark, Cho, Kim, Harder, Maser, Meng and Shpyrko12 can rapidly uncover dynamic material changes in response to driving forces such as stress, temperature, or changing chemistry. However, gaps in our ability to rapidly innovate still remain in some fields of study.
Metallurgy, perhaps the oldest field of materials science, is a prime example where a material’s innovation and design are limited by the speed at which characterization is carried out, in part due to the lack of suitable characterization techniques across time and length scales. New alloys are often “discovered” by combinatorial trial and error, resulting in relatively few classes of high-performance alloys that are tailored for certain applications. In energy applications, these alloys must withstand aggressive chemistries, high temperatures, and high pressures for extraordinarily long periods of time—decades for typical fossil and nuclear power plant applications. Coupled with the glacial time scale of licensing and regulation for mission-critical materials,Reference Wright and Sham13 this represents a serious bottleneck for the speed of materials innovation.
Fields such as radiation materials science suffer even more, as the time, cost, and associated safety issues endemic to any radiation experiment render them among the slowest to produce useful data. This is largely due to the slow pace at which suitable materials degradation information, either direct or indirect, can be generated, which is itself limited by the slow speed, geometrical specimen constraints, and cost of undertaking these analyses. As an illustrative example, industrial nuclear reactor pressure vessels (RPVs) incorporate a large number of “inspection coupons”Reference Corwin and Lucas14 positioned inside the vessel, made from the same material. Destructive mechanical tests on these inspection coupons, such as Charpy impact,Reference Tanguy, Besson, Piques and Pineau15 are used to monitor ductile-to-brittle transition temperature shifts as a quantitative measure of RPV health. However, many commercial US power plants have now run out of inspection coupons, leading operators to reinsert older coupons without full knowledge of the operating history or to remove material from the bulk RPVs for testing.Reference Server, Nanstad and Odette16,Reference Onizawa, Fukaya, Nishiyama, Suzuki, Kaihara and Nakamura17
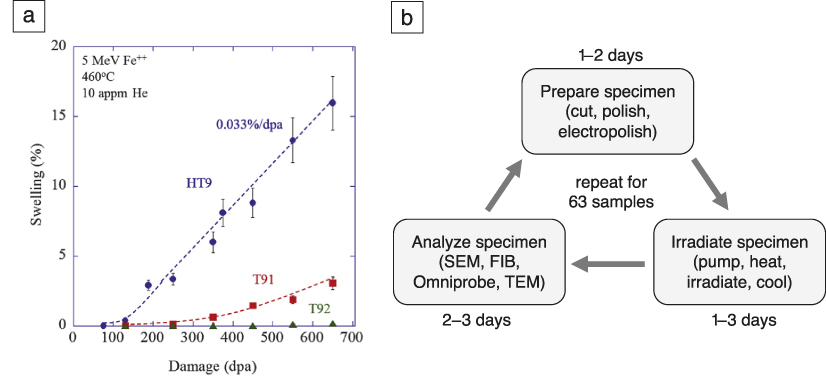
Even scientific discovery in radiation materials science is fraught with empiricism, a scarcity of experiments, and often under-sampled data due to the time, cost, and difficulty associated with conducting experiments. For example, a recent study of three high-performance, ferritic/martensitic steels was conducted to see when void swelling would begin,Reference Getto, Sun, Monterrosa, Jiao, Hackett and Was18 signaling rapid reduction in ductility of these materials.Reference Garner and Toloczko19 After almost one year of work, just six to nine radiation doses per material were probed (see Figure 1). What was ultimately sought was the incubation dose of void swelling which, if known, would set the useful lifetime of these high-performance materials. To scope out just three materials in a year simply is not fast enough to gather data in time for reactor licensing and deployment.
Example of a typical radiation materials science experiment, the time required to obtain the desired data and its relative scarcity. (a) High-dose void swelling behavior of radiation-tolerant steels under ion irradiation. Reprinted with permission from Reference Getto, Sun, Monterrosa, Jiao, Hackett and WasReference 18. © 2016 Elsevier. (b) Workflow for experimental campaign to produce (a). These experiments took approximately one year to complete using accelerated ion-beam exposure and would have taken almost 50 years if reactor irradiations were used. Note: appm, atomic parts per million; SEM, scanning electron microscopy; FIB, focused ion beam; TEM, transmission electron microscopy.

These examples motivate the development and usage of far more rapid, nondestructive techniques. The desire is to use such methods to monitor microstructural evolution during heat treatment, mechanical testing, or even as in situ characterization in mission-critical applications across a wide range of fields; from nuclear to aerospace to fossil and advanced energy. However, with the regulator-required data consisting of mechanical properties, corrosion resistance, fatigue performance, and in some cases, radiation damage resistance, it is often the case that laboratory experiments simply cannot produce the required data without actually building the reactor, resulting in a “Catch-22” situation. A technique that can rapidly and nondestructively probe microstructural evolution and material properties, whether directly or indirectly, is the key to expediting innovation in these materials science fields just to keep pace with the speed of idea generation and the demands of the market.Reference Getto, Sun, Monterrosa, Jiao, Hackett and Was18
This need for rapid in situ property determination is not limited to materials for present and future nuclear power, but spans a wide range of applications, from the development of phononic metamaterials,Reference Wang, Yousefzadeh, Chen, Nassar, Huang and Daraio20,Reference Cha and Daraio21 to clarifying the properties of glass-forming liquids,Reference Dyre22,Reference Tanaka, Kawasaki, Shintani and Watanabe23 exploring the dynamics of granular materials,Reference Boechler, Theocharis and Daraio24,Reference Nesterenko25 developing optimized thermoelectrics,Reference Minnich, Dresselhaus, Ren and Chen26 and designing metal–organic frameworks for sensing and catalysisReference Ryder, Civalleri and Tan27–Reference Ryder, Civalleri, Cinque and Tan29 to name but a few examples. Transient grating spectroscopy (TGS) is a versatile tool that goes some way toward addressing this need by providing a convenient, noncontact method of characterizing elastic, thermal, and acoustic properties at the microscale on microsecond time scales. By predetermining the relationship between these properties and other quantities of interest, TGS further offers the potential to act as a nondestructive evaluation (NDE) technique even for field-inspection (one of the first commercial applications of TGS was thin-film metrologyReference Maznev, Mazurenko, Zhuoyun and Gostein30). Importantly, TGS works in air, vacuum, or any transparent fluid, at low or high temperatures, and in many in operando-like service conditions.
This article begins with an overview of the TGS technique, considering signal generation, interpretation, and practical implementation of TGS measurements. Recent applications of TGS to studying material property evolution will then be reviewed, focusing in particular on irradiation induced changes. Finally, an outlook is provided, highlighting the tremendous opportunities afforded by in situ TGS measurements for data-rich characterization of dynamically evolving systems.
Transient grating spectroscopy—The technique
TGS works by generating surface acoustic waves (SAWs) and a well-defined temperature grating. Two short excitation laser beams (typically <500 ps pulse duration, ∼500 nm wavelength, ∼ few μJ energy) are overlapped on the sample surface with a fixed angle θ (Figure 2a). Interference of the beams generates a spatially periodic intensity pattern with wavelength, Λ, on the sample surface:Reference Maznev, Nelson and Rogers31,Reference Johnson, Maznev, Bulsara, Fitzgerald, Harman, Calawa, Vinels, Turner and Nelson32
 $${\rm{\Lambda }} = {{\rm{\lambda }} \over {2{\rm{sin}}({{\rm{\theta }} \over 2})}}$$
where λ is the wavelength of the excitation light. Interference of excitation beams with the same polarization leads to the formation of a periodic intensity pattern, or, using excitation beams with crossed polarization, it is also possible to form a grating with a periodic polarization pattern (linear, elliptical, and circular).Reference Nelson, Casalegno, Miller and Fayer33 Absorption of the light within the intensity grating leads to a spatially periodic temperature profile in the sample, which, due to thermal expansion, causes a spatially periodic variation of the specimen surface height. In addition, rapid thermal expansion launches two monochromatic, counter-propagating SAWs with wavelength, Λ.
Schematic showing how surface acoustic waves (SAWs) are generated and measured during a transient grating spectroscopy experiment. (a) Generation of the transient grating by overlapping two short excitation beams on the sample. (b) Reading out of the transient grating by diffracting a probe beam from the grating in the sample. The diffracted probe beam is heterodyned with a reflected reference beam. (c) Transient grating signal from unimplanted tungsten (blue) and a helium-ion implanted region on the same sample (red). The oscillations of the signal reveal the SAW frequency,  ${f_{{\rm{SAW}}}}$. The underlying decaying background signal (green dashed line as a guide to the eye) captures the decay of the temperature grating (in this case of the unimplanted tungsten signal in blue).Reference Hofmann, Mason, Eliason, Maznev, Nelson and Dudarev35

The decay of the SAWs and temperature grating can be monitored using a probe laser beam that is diffracted from the transient gratings at the sample surface. The intensity of the diffracted probe beam is spatially overlapped with a reference beam reflected from the sample surface and used in a heterodyne amplification scheme.Reference Maznev, Nelson and Rogers31,Reference Johnson, Maznev, Bulsara, Fitzgerald, Harman, Calawa, Vinels, Turner and Nelson32 The intensity in the geometric channel containing both the diffracted signal and the reflected reference beam is monitored as a function of time after excitation using a fast avalanche photodiode and oscilloscope (Figure 2b). By averaging more than a few thousand exposures, low noise time traces can be generated in a few seconds per point.Reference Dennett and Short34
As an example, Figure 2c shows the phase grating signal measured from a tungsten sample (blue trace).Reference Hofmann, Mason, Eliason, Maznev, Nelson and Dudarev35 Two components of this signal are clear: (1) an underlying decay, due to the thermal equilibration of the induced transient gratings in the sample (green dashed line), and (2) oscillations due to the counter-propagating SAWs. Also shown is a trace from a region of the sample that was implanted with 0.3 at.% of helium (red trace), to study the effects of fusion-reactor relevant helium implantation levels on materials properties. The data for the implanted material shows a slower decay, indicating a reduced thermal diffusivity, and a reduced SAW frequency, which suggests a lower stiffness.
Quantitatively, the SAW velocity v r can be related to the material elastic constants of an elastically isotropic material using an approximate solution to the Rayleigh wave equation:
 $${v_{\rm{r}}} = {f_{{\rm{SAW}}}}{\rm{\Lambda }} \approx (0.874 + 0.196\nu - 0.043{\nu ^2} - 0.055{\nu ^3})\sqrt {{E \over {2(1 + \nu ){\rm{\rho }}}}}$$
where E is Young’s modulus, ρ is the material density, f SAW is the SAW frequency, and ν is the Poisson’s ratio, which holds for all values of  $\nu \in [ - 1,0.5]$.Reference Peter36 For elastically anisotropic materials, this relationship becomes considerably more complex due to the orientation dependence of elastic properties. This means that the SAW velocity now depends on both out-of-plane crystal orientation and in-plane polarization of the SAW wave vector. Every et al.Reference Every, Kim and Maznev37 and Favretto-Cristini et al.Reference Favretto-Cristini, Komatitsch, Carcione and Cavallini38 reviewed different approaches for tackling this problem. Fortunately, several reliable computer codes for predicting direction-dependent SAW velocity have now been published.Reference Du and Zhao39,Reference Every, Maznev, Grill, Pluta, Comins, Wright, Matsuda, Sachse and Wolfe40 In addition, methods also exist for solving the inverse problem; namely, material properties may be extracted from measured SAW velocities.Reference Brown41
The decay, or equilibration, of both the temperature and displacement gratings have been studied analytically in varying degrees of detail.Reference Johnson, Maznev, Bulsara, Fitzgerald, Harman, Calawa, Vinels, Turner and Nelson32,Reference Käding, Skurk, Maznev and Matthias42 Interestingly, the relaxation of the excited gratings in temperature and surface displacement are governed by different time dependencies. Following an impulse excitation and assuming an isotropic thermal diffusivity,  ${\rm{\alpha }}$, the temperature grating, T(t), varies as:
 $$T(t) = {A \over {\sqrt {{\rm{\alpha }}t} }}exp( - {q^2}{\rm{\alpha }}t)$$
whereas the surface displacement profile, u(t), varies with time as:
 $$u(t) = B\,erfc(q\sqrt {{\rm{\alpha }}t} )$$
where t is time, A and B are proportionality constants, and q is the grating wave vector  $2{\rm{\pi }}/{\rm{\Lambda }}$.Reference Johnson, Maznev, Bulsara, Fitzgerald, Harman, Calawa, Vinels, Turner and Nelson32
In experiments, the temperature dynamics contribute to the overall measured response through the temperature dependence of the complex reflectivity of the surface. Johnson et al.Reference Johnson, Maznev, Bulsara, Fitzgerald, Harman, Calawa, Vinels, Turner and Nelson32 identified two broad classes of responses that may be recorded in TGS experiments, depending on the heterodyne phase used (i.e., the relative phase difference between the diffracted probe and reflected reference beams). For “amplitude grating” responses, the reflectivity and, therefore, temperature dynamics, may be isolated completely in the heterodyne response. In “phase grating” responses, both reflectivity and displacement play a role and cannot be decoupled without knowledge of the precise heterodyne phase. When using TGS as a rapid NDE tool, the phase grating response is of greater interest as it encodes both thermal and elastic property information. Therefore, Dennett et al. recently proposed a robust new fitting approach that takes both relaxation dynamics into account, treating the ratio of their relative contributions as a free parameter.Reference Dennett and Short43
An interesting question concerns the depth dependence of the measured signal. For both SAWs and thermal transport, the applied grating wavelength provides an easily tunable length scale. For thermal grating decay, Käding et al.Reference Käding, Skurk, Maznev and Matthias42 showed that the measurement is sensitive to thermal properties up to a depth of Λ/π, while a surface layer of thickness Λ/2 dominates the measured SAW signal.Reference Royer and Dieulesaint44 This ability to target different probing depths makes TGS measurements attractive for selectively probing the properties of thin surface regions, or even depth profiling of properties.Reference Goossens, Leclaire, Xu, Glorieux, Martinez, Sola, Siligardi, Cannillo, Van der Donck and Celis45 TGS is particularly useful for studying ion irradiation as it allows probing of the properties of the ion-irradiated layer alone, typically on the same order in thickness as the TGS probe depth, with little contribution from the unirradiated material beneath.
There are a few practical limitations to the extent of measurable material properties using TGS. The pump and probe lasers have fixed spot sizes (typically 50–500 μm)—if too small then the power density may be too high (the material under inspection is damaged by the excitation), if too large then the power density may be too low (the signal intensity is not large enough to measure). In addition, a sufficient number of projected laser fringes must exist within the pump spot to generate a sufficiently strong and monochromatic signal, placing an upper limit on the projected grating spacing. Meanwhile, as shorter wavelength SAWs have higher frequencies, the detection electronics—typically the avalanche photodiodes (APDs) and the oscilloscope—set a bandwidth limit for the fastest resolvable signal change. As of now, relatively inexpensive APDs with sufficient signal have an upper frequency cutoff around 1 GHz. This places a lower limit on the projected grating spacing for TGS—typically in the range of 2–3 μm for metals, 5–8 μm for ceramics. More fundamentally, the amplitude of the induced surface displacement scales with the wavelength of the imposed grating, leading to a reduction in recorded signal intensity as the wavelength is reduced.
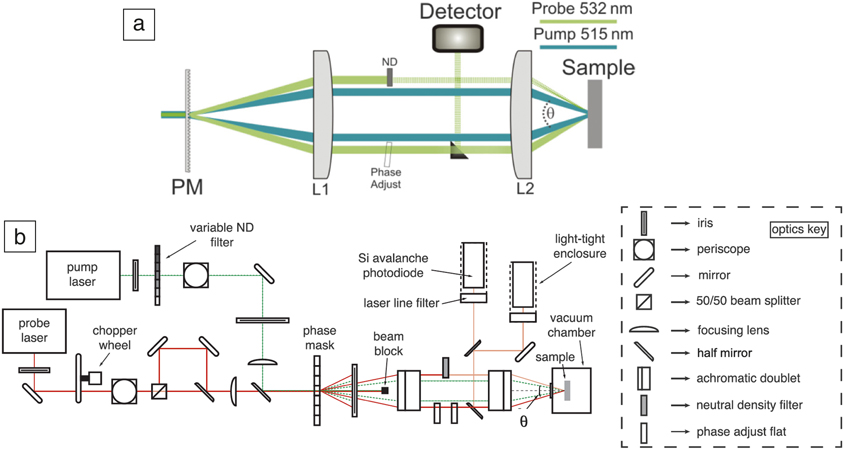
A number of different geometries for TGS measurements have been proposed. Early implementations used beam splitters and mirrors to split a short pump pulse and then generate two overlapping beams on the sample.Reference Nelson, Casalegno, Miller and Fayer33 However, this setup is challenging in practice as good phase stability between the pump pairs is needed, and it does not allow for straightforward, repeatable variation of the grating period. Rogers et al.Reference Rogers, Fuchs, Banet, Hanselman, Logan and Nelson46 suggested the boxcar geometry shown in Figure 3a to overcome these limitations, which is now used extensively. Here, a volumetric diffraction grating, deemed a “phase mask,” is used to split both pump and probe beams into many diffraction orders. The +1 and –1 orders are then isolated and overlapped on the sample using a 4f imaging system. Using shared optics for the pump and probe beams allows high relative phase stability. The grating period can be easily changed by changing the period of the phase mask. Indeed, using a tilted phase mask, researchers recently proposed a scheme for a setup that allows a continuously variable grating period.Reference Vega-Flick, Eliason, Maznev, Khanolkar, Abi Ghanem, Boechler, Alvarado-Gil and Nelson47
Layout of a typical transient grating spectroscopy (TGS) experiment. (a) The boxcar geometry used to generate the transient grating. Note: PM, phase mask; L1 and L2, achromatic doublet lenses; ND, neutral density filter. Reprinted with permission from Reference Johnson, Maznev, Bulsara, Fitzgerald, Harman, Calawa, Vinels, Turner and NelsonReference 32. © 2012 AIP Publishing. (b) Full layout for dual heterodyne detection TGS measurements as proposed by Dennett et al.Reference Dennett and Short43

The boxcar geometry also allows straightforward heterodyne detection where the probe beam, diffracted by the transient grating in the sample, is heterodyned with a reflected reference beam.Reference Maznev, Nelson and Rogers31 The phase difference between the probe and reference beams can be precisely tuned using an optical parallel inserted into the probe beam (labeled phase adjust in Figure 3a). Until recently, manual tuning of the phase was required after each measurement, leading to long measurement times of ∼10 min per point, depending on the material system and desired signal-to-noise ratio. Dennett et al.Reference Dennett and Short34 proposed a dual heterodyne setup (Figure 3b) that side steps this requirement, reducing scan times to a few seconds with an acceptable signal-to-noise ratio. This is key for enabling in situ measurements of evolving systems, as well as the mapping of larger areas.
Applications
Applications of TGS range from direct probing of elastic and thermal properties, to using these properties to infer other information, for example, to track the speed and extent of microstructural evolution under a number of driving forces. Here, a few such illustrative use cases are presented.
Probing elastic properties
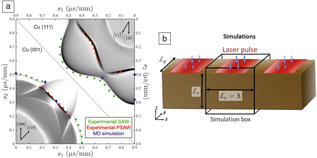
Directly measuring elastic properties is perhaps the most straightforward application of TGS, and the information is surprisingly useful. The elastic properties of even simple materials (e.g., pure Ni) have not yet been measured at moderate to high temperatures of a few hundred degrees Celsius. In addition, it is important to chart out the ultimate sensitivity of the TGS technique when applied to a typical measurement in a reasonable amount of time, with signal collection times of tens of minutes. Dennett et al.Reference Dennett, Cao, Ferry, Vega-Flick, Maznev, Nelson, Every and Short48 used TGS to measure the orientation-dependent SAW speed and elastic constants of pure Al and Cu single crystals and compared these with theoretical estimates (Figure 4a). This study highlighted that TGS can measure SAW frequency with an absolute resolution of ∼0.1% (the bandwidth of the SAW signal is typically 1% of the center frequency). This is a critical parameter, as it determines which types of changes should and should not be measurable using this technique.
Probing elastic properties by transient grating spectroscopy (TGS): Comparison between experimental measurements, theoretical predictions, and molecular dynamics (MD) simulations. (a) Theoretical prediction (thin, black lines), experimental measurements (green and red symbols for surface acoustic wave [SAW] and pseudo SAW [PSAW], respectively), and MD predictions (blue symbol) of SAW propagation on single-crystal copper in slowness (inverse velocity) space.Reference Dennett, Cao, Ferry, Vega-Flick, Maznev, Nelson, Every and Short48 (b) MD simulation setup used to predict the orientation dependence of SAW speed in copper and aluminum. Blue arrows indicate the direction of laser excitation.Reference Dennett, Cao, Ferry, Vega-Flick, Maznev, Nelson, Every and Short48 Note: Λ, projected grating spacing; s 1,2, slowness (inverse velocity) vector components.

Equally important to the sensitivity of a technique is its predictability, or the ability to predetermine when a meaningful signal can be generated, as well as being able to understand signals measured in the lab. Dennett et al.Reference Dennett, Cao, Ferry, Vega-Flick, Maznev, Nelson, Every and Short48 used large-scale molecular dynamics (MD) to create a scaled-down version of a TGS experiment in the computer, applying a one-dimensional, spatially periodic, step-function pattern of heat to a box of atoms with periodic boundary conditions (Figure 4b). The results agreed well with experimental measurements of the same materials, when properly scaled. As long as the MD simulation cell is larger than roughly 50 nm in the grating dimension, and twice the grating dimension in thickness, the same acoustic-wave propagation modes measured in the experiment may be reliably detected in simulation. Although the wavelengths are much smaller in experiments, and therefore the frequencies much higher, the simulated acoustic-wave velocities may be compared directly between simulation and experiment. Using this approach, the same relationship between vacancy concentration and Young’s modulus as predicted by DienesReference Dienes49 and previously measured using contact ultrasonicsReference Folweiler and Brotzen50,Reference Dieckamp and Sosin51 was obtained.
More recently, others have used TGS and similar SAW-generating techniques to directly probe elastic constants of simple and complex materials. Du and Zhao used SAWs to measure the elastic constants of several pure metals (Fe and Ta, among others)Reference Du and Zhao39 and a Ni-based superalloy,Reference Du and Zhao52 while Gasteau et al. used SAWs to obtain the fourth-order elastic stiffness tensor of polycrystalline steels.Reference Gasteau, Chigarev, Ducousso-Ganjehi, Gusev, Jenson, Calmon and Tournat53 Indeed, using ultrasonic velocities to obtain crystal elastic constants is not new, as previous researchers have used other acoustic and ultrasonic techniques to measure the same.Reference Xu, Aizawa and Kihara54,Reference Li and Szpunar55 However, as a noncontact technique, TGS lends itself particularly well to affixing a single crystal to a stage and rotating the sample to project the transient grating in different crystal directions. Particularly useful will be the ability to do so at high temperatures, to map out high-temperature elastic properties, which remain unknown for most materials. An interesting question, yet to be answered, concerns the number of crystal rotations required to obtain a unique set of elastic constants for any given material. A definitive answer would be useful for the ongoing and potential in situ and in operando applications of TGS outlined next.
Probing material evolution via elastic properties
The TGS technique becomes even more useful when detecting changes brought about by material processing, such as ion irradiation. A first demonstration of this from Hofmann et al.Reference Hofmann, Nguyen-Manh, Gilbert, Beck, Eliason, Maznev, Liu, Armstrong, Nelson and Dudarev56 considered the effects of helium-ion implantation in tungsten, the main candidate material for plasma-facing armor in future fusion reactors.Reference Rieth, Dudarev, Gonzalez de Vicente, Aktaa, Ahlgren, Antusch, Armstrong, Balden, Baluc, Barthe, Basuki, Battabyal, Becquart, Blagoeva, Boldyryeva, Brinkmann, Celino, Ciupinski, Correia, De Backer, Domain, Gaganidze, García-Rosales, Gibson, Gilbert, Giusepponi, Gludovatz, Greuner, Heinola, Höschen, Hoffmann, Holstein, Koch, Krauss, Li, Lindig, Linke, Linsmeier, López-Ruiz, Maier, Matejicek, Mishra, Muhammed, Muñoz, Muzyk, Nordlund, Nguyen-Manh, Opschoor, Ordás, Palacios, Pintsuk, Pippan, Reiser, Riesch, Roberts, Romaner, Rosiński, Sanchez, Schulmeyer, Traxler, Ureña, van der Laan, Veleva, Wahlberg, Walter, Weber, Weitkamp, Wurster, Yar, You and Zivelonghi57 X-ray diffraction showed helium implantation-induced lattice swelling, and TGS showed a reduction in SAW velocity after implantation. These observations could be explained using density functional theory (DFT) calculations of the defects produced by helium-ion implantation to predict the anticipated property changes. Lattice swelling and SAW speed reduction could then be interpreted in terms of the underlying population of helium-filled Frenkel point defects. Probing these defects by other means is tricky; TEM for instance, is not sufficiently sensitive to detect them.Reference Zhou, Dudarev, Jenkins, Sutton and Kirk58,Reference Armstrong, Edmondson and Roberts59
Interestingly, the DFT calculations also predicted a slight increase in elastic anisotropy from a Zener anisotropy ratio of 1.01 before, to 1.02 after ion implantation. Duncan et al.Reference Duncan, Hofmann, Vega-Flick, Eliason, Maznev, Every and Nelson60 confirmed this by measuring an increase in Zener anisotropy ratio from 1.01 to 1.03 in a 〈110〉-oriented tungsten single crystal implanted with helium under the same conditions. Figure 5a shows measured SAW speed plotted as a function of direction in the (110) plane for the unimplanted and the implanted sample. Both the earlier observed SAW speed reduction, as well as the increase in elastic anisotropy upon implantation, are clearly visible. This demonstrates that subtle property changes can be reliably quantified by TGS and linked back to the underlying defect microstructure.
Evolution of surface-acoustic wave (SAW) velocity with low- and high-dose ion irradiation, showing how a drop in SAW velocity indicates the onset of void swelling. (a) Orientation-dependent SAW velocity in unimplanted and helium-implanted regions of a 〈110〉-oriented tungsten single crystal.Reference Duncan, Hofmann, Vega-Flick, Eliason, Maznev, Every and Nelson60 (b) Measurement of void swelling in 〈111〉-oriented single-crystal copper via SAW speed measurements along the 〈 $11\bar{2}$〉 direction relative to that measured on the virgin sample.Reference Dennett, So, Kushima, Buller, Hattar and Short61 (c) High-angle annular dark-field scanning transmission electron micrograph of the most highly exposed (90 dpa) single-crystal copper sample showing a large amount of volumetric swelling.Reference Dennett, So, Kushima, Buller, Hattar and Short61 Note: θ, angle between the SAW wave vector and 〈
 $1\bar{1}0$〉 direction in the plane of the sample; TG, transient grating; c, measured SAW velocity; c 0, measured SAW velocity before irradiation.

Interestingly, TGS is not limited to detecting small lattice defects; it is also applicable to much larger-scale defect structures. This is illustrated by a recent prototypical study in hastening the detection of radiation void swelling, a key radiation damage degradation mechanism, as described in the first section. Dennett et al.Reference Dennett, So, Kushima, Buller, Hattar and Short61 irradiated single-crystal copper with 35 MeV self-ions, inducing void swelling as was clearly evidenced by TEM (see Figure 5c). The onset of void swelling was linked directly to a drop in SAW velocity, backed up by TEM observations. However, this study still took six months to complete. Despite its clear utility, something far faster was required.
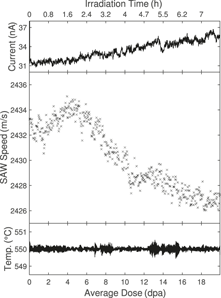
An in situ TGS facility was conceived and constructed at Sandia National Laboratories, pairing a dual heterodyne TGS facility with a 6 MV tandem accelerator.Reference Dennett, Buller, Hattar and Short62 This allows for generation of heavy self-ions that can penetrate as deep as the TGS elastic and thermal probes—for the case of isotopes near the mass of copper, 30–40 MeV ions are readily generated with typical depth ranges around 5 μm. TGS grating spacings of 2.5–8.5 μm are typical for many experiments, meaning that the depth of the ions and the depth of the material probed are well matched. Using this facility, an experiment similar to the single-crystal Cu one was repeated in situ for single-crystal Ni, producing a greatly oversampled curve of SAW speed versus radiation dose (Figure 6). This reduced the time required for an experiment that would have taken months using traditional post-irradiation examination, and even weeks using ex situ TGS, to a single day. Both temperature and beam current were monitored and confirmed stable within reasonable limits, adding a measure of validity to the experiment. Performing all studies on the same sample also removes some of the variability associated with specimen preparation, accelerator performance, and other sample-to-sample effects.
Results from in situ ion-beam irradiation transient grating spectroscopy (I3TGS). (Top) Applied 31 MeV Ni5+ ion-beam current, (middle) measured surface acoustic wave (SAW) speed, and (bottom) temperature as a function of radiation dose in dpa in single-crystal Ni, showing a drop in SAW speed corresponding to the onset of void swelling.Reference Dennett, Buller, Hattar and Short62 The applied dose at each time step is calculated from the continuously monitored ion-beam current; dose and time axes both apply to all three measured parameters.

For the in situ experiment in Figure 6, the average dose between sequential data points, the dose resolution, is roughly 0.04 dpa. Traditional examination of materials undergoing this type of evolution results in data sampled with a resolution of up to 40 dpa between data points (Figure 1),Reference Dennett, So, Kushima, Buller, Hattar and Short61 resulting in a 1000× dose resolution improvement, in a fraction of the time, when using in situ TGS. These new in situ experiments allow for far more precise determination of the dose to the onset of void swelling to be made, as well as the identification of new features not previously seen. For example, in Figure 6 one can see an initial stiffening of the material, evidenced by a SAW speed increase. This stiffening is attributed to the interaction of dislocations and small defect clusters formed at low doses of irradiation.Reference Dennett, So, Kushima, Buller, Hattar and Short61 Under elastic loads, the native dislocation network will normally deform in a recoverable manner, with bowing segments pinned by forest dislocation interactions. Upon irradiation, small defect clusters serve as additional pinning sites for this native network and shorten the average pin segment length, which increases the observed elastic modulus.Reference Friedel63,Reference Parkin, Goldstone, Simpson and Hemsky64 The saturation dose for this effect, as observed through TGS, matches well with in situ TEM observations of small defect cluster generation and saturation at low doses.Reference Li, Hattar and Misra65 As the applied dose increases, defects agglomerate to form larger-scale clusters, in this case voids, which then dominate the measured response.
Probing dynamics of microscale systems
The ability of TGS to generate well-controlled, repeatable SAWs also provides an interesting opportunity for exploring micro- and nanoscale particle dynamics. For example, in granular media, the nonlinear Hertzian contact between particles plays a key role in controlling properties. Colloidal crystals provide an attractive granular system where the collective response can potentially be tuned in a controlled fashion (e.g., by varying particle composition, particle–particle and particle–substrate bonding, or particle-size distribution).
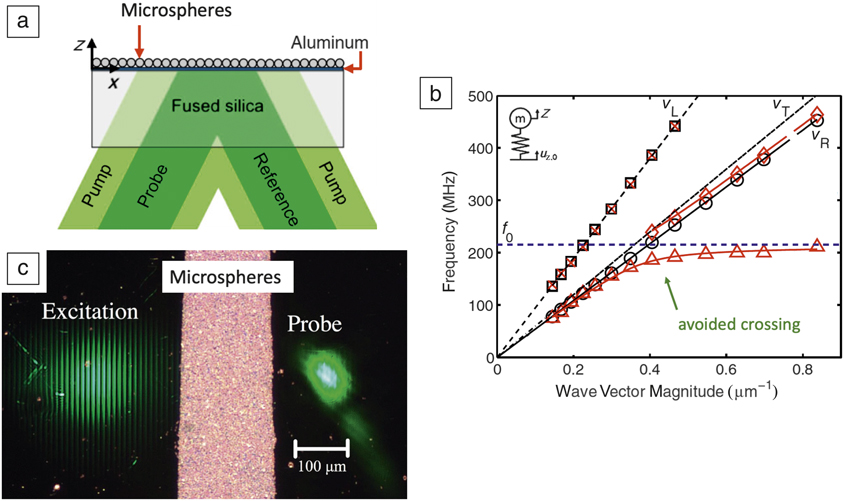
Boechler et al. reported the first application of TGS to a two-dimensional colloidal crystal of microspheres, deposited on top of a silica substrate coated with a thin aluminum film.Reference Boechler, Eliason, Kumar, Maznev, Nelson and Fang66 Their experimental setup is shown in Figure 7a. By varying the TGS wavelength, and hence the SAW frequency, they could map out the dispersion response of the system (Figure 7b). This reveals a number of interesting features. Longitudinal wave behavior in the sample (motion parallel to the substrate surface) is largely unaffected by the presence of the microspheres. Rayleigh wave propagation, on the other hand, is strongly modified. Where the Rayleigh wave frequency approaches the natural frequency of the sphere–substrate contact resonance, an “avoided crossing” is seen due to hybridization of the two modes. This behavior can be reproduced using a surprisingly simple analytical mass–spring system model (inset in Figure 7b) from which the microsphere–substrate contact stiffness can then be extracted.
Application of transient grating spectroscopy (TGS) to probing 2D colloidal crystals. (a) Schematic illustrating the TGS arrangement for measurement of the collective dynamics of microspheres deposited on an aluminum-coated fused-silica substrate. (b) Dispersion relations on spheres (red symbols) and off spheres (black symbols) for the arrangement in (a). Black lines show calculated longitudinal (subscript L), transverse (subscript T), and Rayleigh (subscript R) waves in fused silica. The blue dashed line shows the contact resonance frequency of the silica spheres. The solid red lines show the dispersion for the substrate–microsphere system predicted using the mass–spring model shown in inset in (b). Agreement between the simulations and experimental results is surprisingly good given the simplicity of the assumed model. (a, b) Reprinted with permission from Reference Boechler, Eliason, Kumar, Maznev, Nelson and FangReference 66. © 2013 American Physical Society. (c) Experimental configuration for measuring SAW attenuation by 2D colloidal crystals (microspheres). Reprinted with permission from Reference Eliason, Vega-Flick, Hiraiwa, Khanolkar, Gan, Boechler, Fang, Nelson and MaznevReference 69. © 2016 AIP Publishing. Note: f 0, microsphere resonance frequency; v L, substrate longitudinal wave speed; v T, substrate transverse wave speed; v R, substrate Rayleigh wave speed; u z,0, substrate surface displacement; Z, microsphere displacement.
A fine sampling of TGS wave vectors is desirable to map the dispersion curves in detail. Vega-Flick et al.Reference Vega-Flick, Eliason, Maznev, Khanolkar, Abi Ghanem, Boechler, Alvarado-Gil and Nelson47 provided an elegant solution to this, using a tilted phase mask to generate a continuous variation in the TGS excitation wavelength. Their approach allows much more detailed examination of the avoided crossing and phononic bandgap. This is key for the design and testing of phononic materials with specific, engineered dispersion responses. The responses associated with other higher-order dynamic modes, such as rocking of colloids, can also be examined using SAWs.Reference Otsuka, Mezil, Matsuda, Tomoda, Maznev, Gan, Fang, Boechler, Gusev and Wright67,Reference Hiraiwa, Abi Ghanem, Wallen, Khanolkar, Maznev and Boechler68
An interesting question, particularly for the design of acoustic filters, concerns the attenuation of SAWs due to the presence of colloids. Eliason et al.Reference Eliason, Vega-Flick, Hiraiwa, Khanolkar, Gan, Boechler, Fang, Nelson and Maznev69 proposed a configuration with spatially separated excitation and probe beams to examine SAW attenuation by a strip of microspheres (Figure 7c). Two counter-propagating SAWs are generated by the excitation, one of which then traverses the microsphere strip and is detected at the probe location using the heterodyne setup previously described. Their results showed a strong attenuation of SAWs at the contact resonance of the microspheres with a corresponding 1/e attenuation length (the distance over which the signal dacays to 1/e of its original magnitude) of less than two SAW wavelengths. Since microspheres can be easily deposited and removed, this opens up interesting new avenues for the manufacture of reconfigurable SAW devices with easily controllable structure and frequency selectivity (e.g., controlled by microsphere size). The Hertzian contact stiffness could also be modified (e.g., by functionalizing the surface of microspheres). Such devices could then serve as sensors where adsorption of species on the microsphere surface is detected based on the resulting modification of contact stiffness.
Evolution of thermal-transport properties
Thermal conductivity is a key parameter for materials used in high heat load applications such as power generation, microelectronics, and aerospace. A particularly important example can be found in tungsten tiles used as plasma-facing armor in the divertor of future fusion reactors.Reference Rieth, Dudarev, Gonzalez de Vicente, Aktaa, Ahlgren, Antusch, Armstrong, Balden, Baluc, Barthe, Basuki, Battabyal, Becquart, Blagoeva, Boldyryeva, Brinkmann, Celino, Ciupinski, Correia, De Backer, Domain, Gaganidze, García-Rosales, Gibson, Gilbert, Giusepponi, Gludovatz, Greuner, Heinola, Höschen, Hoffmann, Holstein, Koch, Krauss, Li, Lindig, Linke, Linsmeier, López-Ruiz, Maier, Matejicek, Mishra, Muhammed, Muñoz, Muzyk, Nordlund, Nguyen-Manh, Opschoor, Ordás, Palacios, Pintsuk, Pippan, Reiser, Riesch, Roberts, Romaner, Rosiński, Sanchez, Schulmeyer, Traxler, Ureña, van der Laan, Veleva, Wahlberg, Walter, Weber, Weitkamp, Wurster, Yar, You and Zivelonghi57 Unexpected reduction of thermal conductivity caused by irradiation damage would lead to higher thermal stresses and larger surface temperatures, the key drivers of failure of these components.Reference Norajitra, Giniyatulin, Hirai, Krauss, Kuznetsov, Mazul, Ovchinnikov, Reiser, Ritz, Ritzhaupt-Kleissl and Widak70,Reference Norajitra, Antusch, Giniyatulin, Kuznetsov, Mazul, Ritzhaupt-Kleissl and Spatafora71
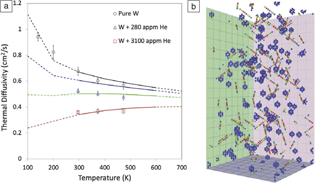
Hofmann et al. carried out the first prototypical study using TGS to probe the effect of helium-ion implantation damage on the thermal-transport properties of tungsten.Reference Hofmann, Mason, Eliason, Maznev, Nelson and Dudarev35 The results (Figure 8a) show that even a small amount of implanted helium, 0.03 at.%, causes a reduction of room-temperature thermal diffusivity by ∼30%. Surprisingly, further increasing the implanted dose by a factor of 10 only causes an additional ∼20% drop in thermal diffusivity, suggesting the onset of a saturation regime. The question is how these changes can be understood in terms of the underlying defect population.
The thermal diffusivity of tungsten as measured by transient grating spectroscopy (TGS) is reduced following helium-ion implantation. (a) Experimentally measured thermal diffusivity (markers) of unimplanted tungsten, and tungsten implanted with approximately 300 appm and 3000 appm of helium, plotted as a function of measurement temperature. Superimposed are predicted curves of thermal diffusivity for tungsten with Frenkel defect concentrations of 0 appm (black), 300 appm (blue), 900 appm (green), and 3000 appm (red). (b) Snapshot of the molecular statics model used to predict thermal diffusivity. Atoms are colored by electronic scattering rate from low (blue) to high (red).Reference Hofmann, Mason, Eliason, Maznev, Nelson and Dudarev35 The volume shown is 10.1 ×10.1 × 20.2 nm3 in size (32 × 32 × 64 unit cells).

In metals above the Debye temperature, thermal conductivity is dominated by electron-mediated transport.Reference Ziman72 Implantation defects act as electron-scattering sites, thereby reducing thermal conductivity. Surprisingly, while the effect of defects on phonon-mediated thermal transport is reasonably well understood and can be effectively modeled using atomistic simulations,Reference Cahill, Ford, Goodson, Mahan, Majumdar, Maris, Merlin and Phillpot73,Reference Cahill, Braun, Chen, Clarke, Fan, Goodson, Keblinski, King, Mahan, Majumdar, Maris, Phillpot, Pop and Shi74 predicting the effect of complex crystal defects on electron-mediated transport remains challenging. Hofmann et al.Reference Hofmann, Mason, Eliason, Maznev, Nelson and Dudarev35 proposed the use of an atomistic model where the electronic scattering rate at atomic sites is assumed to be a function of the energy of each atom. A snapshot of this model is shown in Figure 8b with atoms colored by electronic scattering rate. Vacancies appear as cages of eight atoms with increased scattering rate, while self-interstitial atoms, which in tungsten delocalize to form ½ 〈111〉 crowdions,Reference Derlet, Nguyen-Manh and Dudarev75 appear as strings of atoms with increased scattering rate. Predicted profiles of thermal diffusivity for different defect concentrations agree surprisingly well with the experimentally measured curves (Figure 8a). While rather simplistic, this model provides a straightforward approach for predicting changes in thermal diffusivity due to complex crystal defect structures. The key challenge is knowing which defect population(s) should be simulated, since there are still monumental challenges associated with atomistic simulations of large levels of displacement damage.Reference Nordlund, Zinkle, Sand, Granberg, Averback, Stoller, Suzudo, Malerba, Banhart, Weber, Willaime, Dudarev and Simeone76,Reference Sand, Byggmästar, Zitting and Nordlund77
TGS measurements of thermal transport can also be used as a tool to pinpoint irradiation dose and to understand microstructural evolution. A recent example by Ferry et al.Reference Ferry78 explored the changes in thermal diffusivity upon the irradiation of single-crystal niobium (Figure 9), chosen for its high melting point and correspondingly low defect mobility at room temperature. Using TGS, the thermal diffusivity of Nb was found to drop by a factor of four, consistent with previous data that showed a rapid buildup of point defects at low irradiation doses.Reference Loomis and Gerber79 Upon further irradiation, the thermal diffusivity then recovered to half its pre-irradiation value.
Monitoring radiation-induced microstructural evolution via transient grating spectroscopy (TGS) in single-crystal niobium cold worked to various levels.Reference Ferry78 (a) A drop in thermal diffusivity signifies the generation of radiation point defects, while further irradiation causes fewer, larger clusters to form. (b) Transmission electron microscopy results from a previous study shows this defect clustering behavior occurring in single-crystal Nb at similar radiation doses and varying levels of oxygen impurity. No effect of cold work on the TGS signal was found. Reprinted with permission from Reference Loomis and GerberReference 79. © 1973 Elsevier.
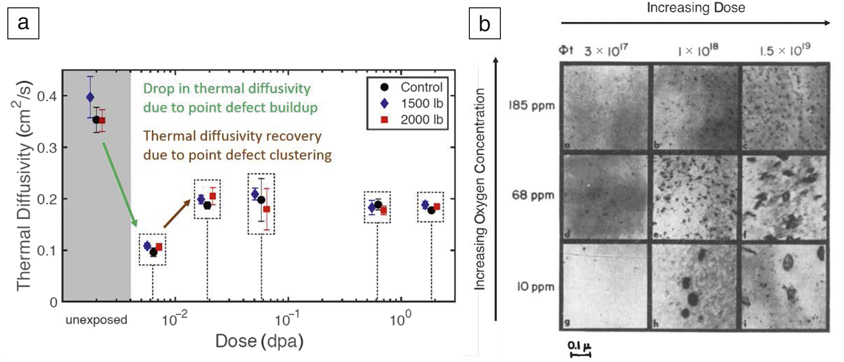
This can be explained by considering TEM data from Loomis and Gerber that showed initial generation of many tiny defects, followed by subsequent generation of larger defect clusters.Reference Loomis and Gerber79 This “microstructural cleanup,” or clustering of radiation defects into fewer, larger agglomerates, is well known in radiation materials science, though using thermal diffusivity to detect it with TGS is a new development. Importantly, TGS allows rapid identification of these phenomena, without the need for slow microscopy sample preparation. This could be quite important in, for example, the design of radiation-damage-resistant materials to pinpoint key stages of microstructural evolution. Given the similarities between the studies of Hofmann et al. and Ferry et al., it would be most useful to create an analytical, predictive model of TGS-measurable changes in thermal diffusivity upon irradiation, allowing for TGS-based determination of the dose to materials a posteriori in certain limited cases. This represents a first attempt at a potentially useful inverse problem—linking TGS-measurable material property changes to a dose in dpa, or more directly to material properties of direct interest.
The ability of TGS to selectively probe behavior of the thin ion-implanted layer is key for all of this. More bulk thermal analysis techniques such as laser flashReference Fujitsuka, Tsuchiya, Mutoh, Tanabe and Shikama80–Reference Peacock, Barabash, Dänner, Rödig, Lorenzetto, Marmy, Merola, Singh, Tähtinen, van der Laan and Wu82 would not have worked here, not to mention the small, irregularly shaped specimen sizes being ill-suited to these more traditional techniques.
Length-scale-dependent thermal transport
The characteristic length scale introduced by the transient grating wavelength is not only useful as a means of selecting the thickness of the surface layer probed, but also provides a convenient tool for examining the scale-dependence of thermal transport (i.e., the dependence of thermal conductivity on the distance over which thermal transport happens). In semiconductors, thermal conductivity is dominated by phonon-mediated transport.Reference Ziman72 Despite a book value of phonon mean free path in silicon on the order tens of nm,Reference Blakemore83 experimentally measured values of thermal diffusivity are known to be reduced when the length scale of the system in question is on the micrometer scale.Reference Johnson, Maznev, Cuffe, Eliason, Minnich, Kehoe, Torres, Chen and Nelson84 The reason is that a large contribution to thermal diffusivity comes from low-frequency phonons with mean free paths of up to several micrometers. TGS experiments have proven useful in exploring this length-scale dependence, making it possible to select portions of the phonon spectrum available to transport heat. As the grating period is reduced, phonons transition from a diffusive to a ballistic propagation regime, with phonons that have mean free path longer than the grating wavelength contributing little to thermal transport, thereby reducing the effective thermal diffusivity. The beauty of TGS is that different transport length scales can easily be probed experimentally simply by selecting different applied grating wavelengths. Thus far, TGS has been used to characterize the scale dependence of thermal diffusivity in a range of different semiconductors, such as silicon,Reference Johnson, Maznev, Cuffe, Eliason, Minnich, Kehoe, Torres, Chen and Nelson84 germanium,Reference Dennett and Short43 SiGe,Reference Huberman, Chiloyan, Duncan, Zeng, Jia, Maznev, Fitzgerald, Nelson and Chen85 and GaAs.Reference Johnson, Eliason, Maznev, Luo and Nelson86
Conclusion and outlook
TGS is a powerful tool for the evaluation of key material properties ranging from elastic constants, to thin-layer thermal transport properties, to phonon attenuation. Importantly, since TGS only requires a reflective surface or a transparent sample, it is readily applicable to a whole host of different materials and systems. By correlating TGS-measurable changes with microstructural evolution, TGS can further be envisioned as a nondestructive testing tool for straightforward, nondestructive material health monitoring. For example, TGS could be used to inspect mission-critical components in light water nuclear reactors, such as reactor pressure vessels or core barrels, to monitor material evolution and degradation. Using a miniaturized, portable TGS system, this could be performed on components during service, perhaps even without halting operation.
The most exciting prospect for TGS is to move beyond static measurements to in situ science. TGS allows for much faster probing than most traditional microscopy techniques, and since it does not require sample contact, it is perfectly suited to monitoring the in situ evolution of properties during complex material processing. We have discussed the current, rather limited number of in situ investigations, which focus on temperature and irradiation as the key driving forces. Many more applications could be envisaged, for example, strain and electrical driving forces to monitor the in situ microscale behavior of actuation materials, perhaps even in miniaturized devices.
TGS could also be used to monitor in situ chemical reactions, such as the growth of oxide films, making it an ideal tool for studying ultrafast corrosion kinetics as long as the input laser energy does not affect the chemical reactions taking place. Indeed, provided the experimental geometries retain the necessary optical access for TGS monitoring, any combination of these driving forces may be applied simultaneously and synergistic effects studied. In all of these scenarios, detailed knowledge of different microstructural evolution kinetics, ranging from precipitation/dissolution, to grain growth, to recrystallization via in situ TGS oversampling will allow for better tuning and validation of models and simulations. Such multiproperty evolution maps may also be used to identify meaningful positions at which detailed characterization through other methods may be carried out to discover the underlying mechanisms controlling the evolution kinetics at hand. Developing and fully exploiting the in situ potential of TGS will be key for addressing the “characterization bottleneck,” which is the time-limiting step for material innovation.
Acknowledgments
F.H. acknowledges support from the European Research Council under Grant No. 714697. M.P.S. acknowledges support from the MIT-SUTD International Design Center and the US Nuclear Regulatory Commission (NRC) faculty development program under Grant No. NRC-HQ-84–15-G-0045 for funding the bulk of the transient grating spectroscopy work in his group to date. C.A.D. acknowledges the US Department of Energy NNSA Stewardship Science Graduate Fellowship under cooperative agreement No. DE-NA-0003864.

Felix Hofmann has been an associate professor of engineering science at the University of Oxford since 2013. His research concentrates on developing new x-ray and electron microscopy tools to probe the structure of atomic-scale crystal defects. These are combined with new micromechanics and laser-based techniques to clarify how defects modify mechanical and physical materials properties. Hofmann can be reached by email at felix.hofmann@eng.ox.ac.uk.

Michael P. Short is an associate professor in the Department of Nuclear Science and Engineering at the Massachusetts Institute of Technology. His research focuses on designing and diagnosing high-performance materials for extreme service environments. Specific projects include the optical-based design of antifouling coatings for energy production, noncontact, nondestructive evaluation of materials degradation, and new ways of rapidly measuring corrosion and damage to materials. Short can be reached by email at hereiam@mit.edu.

Cody A. Dennett is a doctoral candidate in the Department of Nuclear Science and Engineering at the Massachusetts Institute of Technology. His research focuses on the development of multimodal, noncontact, and nondestructive materials evaluation techniques and the application of these methods for in situ monitoring of materials evolution during processing. He has been a US Department of Energy National Nuclear Security Administration Stewardship Science Graduate Fellow since 2016. Dennett can be reached by email at cdennett@mit.edu.