1 Introduction
The role of cost–benefit analysis (CBA) in policy-making has been discussed for decades both in the USA (Arrow et al., Reference Arrow, Cropper, Eads, Hahn, Lave, Noll, Portney, Russell, Schmalensee, Smith and Stavins1996); the European Union (EU) (Löfstedt, Reference Löfstedt2004; Rose-Ackerman, Reference Rose-Ackerman2007; Delbeke et al., Reference Delbeke, Klaassen, van Ierland and Zapfel2010; European Commission, 2015; Carrigan & Shapiro, Reference Carrigan and Shapiro2016; Mouter, Reference Mouter2017; Sunstein, Reference Sunstein2017), and the OECD (Casullo & Zhivov, Reference Casullo and Zhivov2017). Since a commonly assumed reason for the delegation of authority from a legislature (politicians) to government authorities (bureaucrats) is that the bureaucrats have an information advantage over the politicians (Hiriart & Martimort, Reference Hiriart and Martimort2012; Iaryczower et al., Reference Iaryczower, Lewis and Shum2013; Khalil et al., Reference Khalil, Kim and Lawarrée2013), bureaucrats’ information search activities, including a CBA are central for both policy-making and the implementation of legislation. But it is reasonable to assume that the bureaucrats have, and in that case, use their information advantage?
In the present paper, we investigate how different features of the bureaucrats, and the policy-making context may influence the use and impact of CBA information. It is possible to discern at least three reasons why a CBA may not influence decision-making by bureaucrats. Firstly, it is possible that a CBA is not done in the first place.Footnote 1 Secondly, it is possible that the politicians, who have the final say in deciding about legislation, ignore the recommendations made by bureaucrats.Footnote 2 Finally, it is possible that bureaucrats themselves do not take CBA results into consideration when making policy recommendations.Footnote 3 This is the aspect investigated in this study.
As in most countries, civil servants or bureaucrats (the two terms are used interchangeably) have a central role in policy-making in Sweden where the study in this article is made. To study how personal characteristics of bureaucrats, institutional norms, and information influence response behavior, we posed the same transport-related policy questions to civil servants at five different Swedish government agencies. These are the agencies that work with the attainment of transport sector climate goals, namely, that the emissions of greenhouse gases (GHG) from the transport sector should fall by 70 % compared with 2010 values by 2030. The study contributes to the literature on knowledge utilization in government.
From a policy perspective, the motivation for this research is the arguments put forth by Cass Sunstein in several articles that the use of CBA is an institutional safeguard against arbitrary decision-making in government (Sunstein, Reference Sunstein2017). In particular, he focuses on the need for CBA in relation to analysis of risks. He argues that without systematic assessment, unintentional and costly outcomes can result.Footnote 4 In the case of Sweden, corporatist traditions make it difficult to introduce policy innovations like the CBA, however. These traditions result in thick relational webs between politicians and bureaucrats as well as within the civil service and organized interests (Radaelli, Reference Radaelli2010).Footnote 5 In addition, Hansson and Nerhagen (Reference Hansson and Nerhagen2019) conclude that the Swedish policy tradition, where the national government relies on consensus-based coordination between agencies, might counteract a more explicit assessment of different policy options. Currently, transport infrastructure planning and the selection of pharmaceutical drugs for national subsidies are the only two areas where bureaucrats use CBA systematically in Sweden (Hultkrantz, Reference Hultkrantz2009; Eliasson & Lundberg, Reference Eliasson and Lundberg2012; Eliasson et al., Reference Eliasson, Börjesson, Odeck and Welde2015; Hultkrantz & Svensson, Reference Hultkrantz and Svensson2017; Andersson, Reference Andersson2018; Andersson et al., Reference Andersson, Hultkrantz, Nilsson and Lindberg2018) but even in the case of infrastructure investments, the results have often been criticized and put into doubt (Börjesson et al., Reference Börjesson, Eliasson and Lundberg2014; Hammes & Nilsson, Reference Hammes and Nilsson2016).
Another question that motivated this study is how an institutional framework with established norms and policy goals may influence how civil servants consider and compare costs and benefits in decision-making. Sweden has ambitions to be a world-leader in many areas, for example, in sustainable environmental development. Lindvall and Rothstein (Reference Lindvall and Rothstein2006) describe how the national administrative agencies since the 1980s have been set up with ideology production as their main aim instead of being designed to implement specific policies based on laws and superior information. This change in the role of government agencies makes the separation of power between politics and administration blurred. This problem is also identified by Hansson (Reference Hansson2019) who ends her paper with the question: “Who upholds impartiality in the policy process?”
The theoretical framework used in this study is that of delegation models. Bureaucratic decision-making has often been studied using delegation models (for an overview, see Bendor et al., Reference Bendor, Glazer and Hammond2001). The delegation model-literature deals with the circumstances under which decision-making power is delegated from a principal (e.g., a parliament or congress, a chief, etc.) to an agent (an agency, a bureaucrat, an employee, etc.) (Bendor & Meirowitz, Reference Bendor and Meirowitz2004). For example, Alesina and Tabellini (Reference Alesina and Tabellini2007, Reference Alesina and Tabellini2008) study the normative criteria used for allocating policy tasks to elected policymakers (politicians) or non-elected bureaucrats. They show that it is preferable to allocate a policy task to a bureaucrat if time inconsistency and short-termism is an issue, or if vested interests have large stakes in the policy outcome. Nevertheless, nothing in Alesina and Tabellini’s model ascertains that a bureaucrat chooses a socially optimal policy.
The paper is organized as follows: In the next section, we construct a model of delegation by a bureaucrat to a CBA. In Section 3, we describe the questionnaire and the data collected. Section 4 presents results both from non-parametric and parametric analyses based on the hypotheses formulated in the theoretical part of the paper. Section 5 summarizes the results and concludes the article.
2 The model
2.1 The economy, the bureaucrat, and incentives to do a CBA
The model in this section is an application of the model of delegation developed by Bendor and Meirowitz (Reference Bendor and Meirowitz2004). Consider an economy consisting of
 $ H $
individuals denoted by superscript
 $ h=\left\{1,2,\dots, H\right\} $
. Also assume a finite set,
 $ \left\{1,\dots, J\right\},1\le J\ll H $
of bureaucrats. Besides utility from private goods, individuals derive utility from a non-rival and non-excludable public policy outcome,
 $ g\in G $
. Utility derived from the public policy outcome is given by a function
 $ {q}^h(g) $
,
 $ {q}^h $
being increasing and concave in
 $ g $
, that is,
 $ {q}_g^h>0 $
,
 $ {q}_{gg}^h\le 0 $
, the subscripts denoting differentials. The preferences for the public policy outcome are continuously distributed with mean
 $ {\mu}_g $
and variance
 $ {\sigma}_g^2 $
. We denote the socially optimal level of the policy outcome by
 $ {g}^{\ast } $
.
An individual bureaucrat
 $ j\in \left\{1,\dots, J\right\} $
has a unique preference point for the public policy outcome, denoted by
 $ {g}^j\in G $
. We assume that the bureaucrat always prefers a higher level of the public policy outcome than the socially optimal one, that is,
 $ {g}^j>{g}^{\ast } $
.Footnote
6
A particular policy is given by
 $ p\in P $
, the policy being for example a carbon tax, an emissions trading system, a low carbon fuel standard, or a bonus-malus system for low-emission vehicles. The policy is perturbed by a random shock (
 $ \epsilon $
). The shock reflects society’s response to a given policy, which is not known in advance. For example, the price elasticity of fuel demand could be much lower (or higher) than believed. We assume that the shock is symmetrically distributed with a mean of zero,
 $ \overline{\epsilon}=0 $
, and variance of
 $ {\sigma}_{\epsilon}^2 $
, and that the influence of the shock is linear so that
 $ g=p+\epsilon $
. The outcome
 $ g $
is then a random variable that depends on policy so that the cumulative distribution function of
 $ g $
given policy
 $ p $
is
 $ F\left(g\left|p\right.\right) $
.
 $ g $
reflects the attainment of policy goals, for example, the Paris Agreement target of no more than 2 °C average global warming or the Swedish goal of reducing GHG emissions from the transport sector by 70 % compared with 2010 values by 2030.
Given uncertainty about the mapping from policies to outcomes, each bureaucrat has an optimal policy. The bureaucrat can, if they so choose, inform themselves about the mapping from policy to outcome, that is, they can learn the value of the shock. This requires effort, however. The cost of effort is denoted by
 $ {c}^j $
, with the cost increasing in effort. The greater the effort, the more likely the bureaucrat is to find the value of the shock,
 $ \epsilon $
. In practice, the cost of effort can be seen as the cost of performing a CBA or taking in and using information from one. Moreover, knowing the perturbation (
 $ \epsilon $
) permits complete “shock absorption”; if a decision-maker chooses a policy (
 $ p $
) after they observe the disturbance (
 $ \epsilon $
), they can always find a policy that, when combined with the shock, yields any desired (feasible) outcome (
 $ g $
) (Bendor & Meirowitz Reference Bendor and Meirowitz2004, p. 298). We can define the shock as a function of the cost of effort,
 $ \epsilon \left({c}^j\right) $
, with
 $ {\epsilon}_c\left({c}^j\right)<0 $
if
 $ \epsilon >0 $
(
 $ {\epsilon}_c\left({c}^j\right)>0 $
if
 $ \epsilon <0 $
), that is, the impact of the shock on the outcome approaches zero as the cost of effort increases. Furthermore, there exists some maximum level of effort,
 $ {c}^{\mathrm{max}} $
, such that
 $ \epsilon \left({c}^{\mathrm{max}}\right)=0 $
, that is, that given enough effort, the true value of the shock can be found.
The extensive form of the game is then as follows: A bureaucrat has the authority to propose policy
 $ p $
.Footnote
7 Before making their proposal, they decide whether to do/use information from a CBA or not. The bureaucrat consequently faces the following problem: They prefer an outcome
 $ {g}^j>{g}^{\ast } $
but cannot reach that outcome with certainty due to the shock. In the absence of a CBA, they choose policy to maximize their expected utility, given their expectations of the cumulative distribution of outcomes,
 $ F\left(g\left|p\right.\right) $
. Because the bureaucrat’s preferences are strictly single-peaked and because
 $ F\left(g\left|p\right.\right) $
is non-degenerate for all
 $ p $
, the expected utility of the bureaucrat is strictly less than the utility obtained by getting the ideal outcome with certainty.
Because utility varies continuously in outcomes, the bureaucrat has certainty equivalents (CE) in outcome space. The CE form a set of outcomes such that the bureaucrat would be indifferent between getting any such outcome for sure and taking a policy that maximized their expected utility.Footnote 8 This set of certainty equivalents defines the bureaucrat’s CBA set (the CBA set corresponds to the delegation set in Bendor & Meirowitz, Reference Bendor and Meirowitz2004, p. 299). It defines the bureaucrat’s propensity to do/use information from a CBA; the larger the CBA set, the more likely a bureaucrat is to carry out a CBA. We examine the determinants of the CE in the next proposition:
Proposition 1. Of two bureaucrats, the one with a higher Arrow-Pratt measure of risk aversion has a higher risk premium than the one with a lower measure.
Proof: The proof of the risk premium being higher for a more risk-averse bureaucrat, that is, the one with a higher Arrow-Pratt measure, than that for a less risk-averse one follows Jehle & Reny (Reference Jehle and Reny1998, pp. 208–211) and will not be repeated.
 $ \qed . $
The result in Proposition 1 is ambiguous, however. What is the bureaucrat risk averse toward – the CBA outcome or the environmental outcome? This cannot be determined on theoretical grounds. Therefore, we formulate two alternative hypotheses that we can test empirically:
Hypothesis 1. A more risk-averse bureaucrat is afraid of getting a policy outcome far from the social optimum. Therefore, a more risk-averse bureaucrat has a larger CBA set than a risk-neutral/loving one.
Hypothesis 2. A more risk-averse bureaucrat is afraid of not reaching the environmental goal. Therefore, a more risk-averse bureaucrat has a smaller CBA set than a risk-neutral/loving one, opting for policies that reach a given goal with a greater certainty.
Turning to the question of the impact of attitudes on the choice of policy, consider a bureaucrat who must make a proposition for public policy,
 $ p $
, which together with the shock,
 $ \epsilon \left({c}^j\right) $
, determines the outcome of the public policy,
 $ g $
. Considering a discrete problem, the probability of
 $ \epsilon $
taking any given value is
 $ {\pi}_i,i\in \left\{1,\dots, n\right\} $
. The bureaucrat’s problem is to choose the effort cost to maximize the expected utility from
 $ g $
:
 $$ \underset{{\mathsf{g}}^{\mathsf{j}}}{\max}\sum_{\mathsf{i}=\mathsf{1}}^{\mathsf{n}}{\pi}_{\mathsf{i}}{\mathsf{q}}^{\mathsf{j}}\left(\mathsf{p}+\mathsf{\epsilon}\left({\mathsf{c}}^{\mathsf{j}}\right)\right),\mathrm{s}.\mathrm{t}.0\le {\mathsf{c}}^{\mathsf{j}}\le \mathrm{C}, $$
where
 $ C $
is some upper limit of the possible effort cost.
What happens to the effort put into finding the value of the shock as the bureaucrat’s policy preference,
 $ p $
, increases? We formulate the following proposition:
Proposition 2.
If bureaucrat i has a higher preference for the policy outcome than bureaucrat j, that is,
 $ {g}^i>{g}^j $
, bureaucrat i will be less likely to do a CBA than bureaucrat j.
Proof: We prove Proposition 2 by totally differentiating (1) with respect to (w.r.t.)
 $ p $
and
 $ {c}^i $
and rearranging. We find
 $$ \frac{d{c}^i}{dp}=-\frac{\sum_{k=1}^n{\pi}_k{q}_g^i\left(p+\epsilon \left({c}^i\right)\right)}{\sum_{k=1}^n{\pi}_k{q}_g^i\left(p+{\epsilon}_c\left({c}^i\right)\right)}<0.\qed $$
Thus, as
 $ p $
increases, the cost of effort, and consequently the effort put into finding
 $ \epsilon $
, falls. Therefore, a bureaucrat with higher preferences regarding the public policy outcome is less likely to put more effort into finding out the true value of
 $ \epsilon $
, that is, they are less likely to do a CBA than bureaucrats with less extreme preferences.
However, how the situation is perceived is also related to education and experience. With little experience with CBAs, a bureaucrat may perceive that the CBA does not reveal all necessary information about the shock. This case is analogous to that of informationally imperfect agents in the model of Bendor and Meirowitz (Reference Bendor and Meirowitz2004, p. 300). Thus, even if the bureaucrat does a CBA, it is possible that they will have to make an uninformed decision. This puts them in the worst of all possible worlds: There is policy bias but no compensating adaptation of the policy to the state of the world.
Thus, assume that with probability
 $ {\rho}^j $
the CBA reveals the true state of nature, the probability of the state of nature remaining unknown being
 $ \left(1-{\rho}^j\right) $
. Hence, the expected value of doing a CBA increases in the bureaucrat’s own competence, measured by
 $ {\rho}^j $
. As
 $ {\rho}^j $
falls, the CBA set contracts. We formulate the following proposition:
Proposition 3. Uncertainty about the CBA results diminishes the CBA set.
To illustrate Proposition 3, assume that with full certainty (
 $ {\rho}^j=0\Big) $
, the expected CBA result equals the bureaucrat’s certainty equivalent, that is, the bureaucrat is indifferent between doing a CBA or not. Now introduce uncertainty about whether the CBA will reveal the true value of the shock or not. The value of the CBA is reduced by uncertainty. This means that the expected value of the CBA falls outside the bureaucrat’s CBA set and the bureaucrat under uncertainty is not willing to do a CBA.
We summarize the findings from Hypotheses 1 and 2, and Propositions 2 and 3 regarding the size of the CBA set in Table 1. A minus sign in Table 1 indicates that a bureaucrat with that particular property has a smaller CBA set and a plus sign that the CBA set is larger, the first sign referring to the individual’s risk aversion, the second to their policy preferences, and the third to the level of uncertainty about CBA results.
The impact of risk preferences (Hypotheses 1 and 2, first sign), policy preferences (Proposition 2, second sign) and the uncertainty about CBA results (Proposition 3, third sign) on the CBA set.

A minus sign indicates a smaller CBA set; a plus sign a larger one.
Abbreviation: CBA, cost–benefit analysis.
Two unambiguous cases arise in Table 1 for Hypothesis 1 and Hypothesis 2, respectively. The bureaucrat who is risk averse with respect to the CBA outcome (Hypothesis 1), who has low policy preferences (Proposition 2), and low uncertainty about the CBA results (low cost of carrying out a CBA, Proposition 3) is the most likely to use information from a CBA, that is, they have the largest CBA set. The bureaucrat who is risk-neutral/loving with regard to the CBA outcome, with high policy preferences, and high uncertainty about the CBA results (high cost of carrying out a CBA) has the smallest CBA set.
On the other hand, a bureaucrat who is risk averse with respect to the environmental outcome (Hypothesis 2), who has high policy preferences (Proposition 2), and who experiences high uncertainty about the CBA results (Proposition 3) has the smallest CBA set while the corresponding risk-neutral/loving bureaucrat with low policy preferences and with low uncertainty about the CBA results has the largest set. All the other cases are of indeterminate size.
2.2 The influence of institutional norms on the use of CBA
In addition to the influence of individual characteristics, institutional norms may influence bureaucrats’ behavior and their search for information. An important norm of this type is the requirement that government agencies have to consider the implications of a regulation on the government’s budget. Hammes (Reference Hammes2017) argues that one difference between government agencies that regularly conduct CBAs and those that do not is that the former seems to be acting under a binding governmental budget constraint while the latter does not. A governmental budget constraint can, when binding, impose an upper limit on the supply of public goods. It may then be impossible for a bureaucrat to reach their ideal point. If, however, the bureaucrat, by doing a CBA, can get the government to relax the budget constraint, they may have an incentive to do so.
Consequently, if the governmental budget constraint limits the supply of the public good to a level below the bureaucrat’s optimal point, including the CBA set, the incentives to do a CBA depend on the bureaucrat’s expectations about the social optimum. An expected social optimum that corresponds to the budget constraint will not induce them to do a CBA since the CBA results would not make the government to relax the budget constraint. If, however, the CBA results likely lie closer to the bureaucrat’s ideal point, they will do a CBA since by doing one they can demonstrate the benefits of relaxing the budget constraint. The bureaucrat’s CBA set may consequently increase in this case. This is because the social optimum, though non-desirable for the bureaucrat, lies closer to their ideal point than the budget-constrained level of provision.
Proposition 4. A binding governmental budget restriction increases the probability of a bureaucrat doing a CBA.
Proposition 4 is illustrated in Figure 1. The null of Proposition 4 is that there are no systematic differences between bureaucrats working for government agencies acting under a binding budget constraint and those not so constrained.
The impact of a binding governmental budget constraint (
 $ {g}^B,\mathrm{the}\ \mathrm{thick}\ \mathrm{line} $
) on the bureaucrat’s incentive to do a CBA. If a CBA demonstrating that
 $ {g}^{\ast } $
is preferable to
 $ {g}^B $
can move the budget constraint from
 $ {g}^B $
toward
 $ {g}^{\ast } $
, the bureaucrat’s CBA set expands from the original to the “expanded CBA set.”

To test the four propositions, we designed a choice experiment that was sent to civil servants at five government agencies. In the next section, we describe the questionnaire and data collection.
3 Questionnaire, data collection, and the data
3.1 Description of the questionnaire and the data
The choice experiment tested the influence of CBA information on the participating civil servants’ response behavior. The questionnaire dealt with government policy to encourage the production of biofuels from forestry. The questions were based on a number of recent studies (Bosted et al., Reference Bosted, Mustonen and Gong2015; Henning, Reference Henning2015; Swedish Energy Agency, 2015, 2016; Apaydin, Reference Apaydin2016; Konjunkturinstitutet, 2016; Kungliga ingenjörsveternskapsakademien (IVA), 2016; Ministry of Enterprise and Innovation, 2016; Nationellt skogsprogram, 2016; Swedish Transport Administration, 2016). A pre-study was conducted on a reference group consisting of representatives from the Swedish Energy Agency (SEA), the Swedish Environmental Protection Agency (SEPA), the Swedish Transport Administration (STAdmin), the Swedish Transport Agency (STAgency), and Transport Analysis (Trafa), that is, the same agencies that answered the questionnaire.
As an introduction, the respondents were given information about the current policy landscape in Sweden with a political ambition of creating a fossil-free vehicle fleet by 2030. They were also informed that biofuels from forests could be part of the solution and about current energy use and CO2 emissions from the car fleet in Sweden. Finally, they were told that the government in different ways encourages the transformation of the car fleet, for example, through government grants (see online Appendix).
The questions were divided into three sections. The first concerned the respondents’ education and previous work experience. The second part consisted of five choice experiment questions, four of a standard type evaluating the trade-offs between different attributes, and a fifth, which is the one analyzed in this study. Hence, when answering the fifth question, the respondents had already been forced to consider the possible trade-offs involved. The questionnaire ended with questions about individual characteristics (age, sex, income, etc.) and attitudes both to risk and more generally.
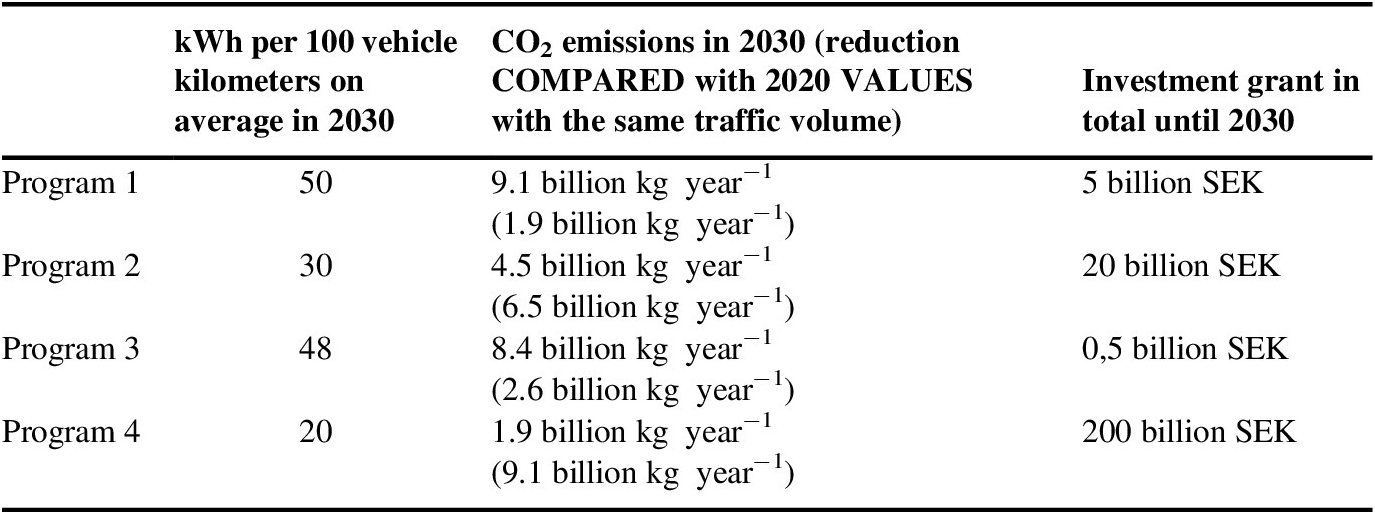
The aim of the fifth choice question was to create a scenario that resembles a real-life choice context. The assumption is that the choice situations that the bureaucrats encounter in their everyday work include a description of both the benefits and the costs of undertaking a certain action. To mimic this, the questionnaire contained information about the estimated societal benefit of reducing CO2 emissions (0.8–1.2 SEK per kg CO2 reduced) and the cost of four different action programs to reduce these emissions from the transport sector over the 10-year period 2020–2030; see Table 2.Footnote 9 The respondents also had the option to reject all alternatives, hence choosing the status quo. This we assumed to imply a zero willingness to pay.
Action programs were presented to respondents in the questionnaire.

For Programs 1–3 (P1–P3), total benefits exceed the total costs. P1 is inefficient compared with P3, which results in approximately the same climate impact at a much lower cost. Which of the two alternatives, P2 or P3, is to be preferred depends on the choice of benefit estimate and decision rule (net present value (NPV) or benefit–cost ratio).Footnote 10 The upper benefit estimate, 1.2 SEK per kg CO2, yields a higher NPV for P2 while the lower estimate of 0.8 SEK per kg CO2, yields a higher estimate for P3. The average benefit estimate, 1 SEK per kg, yields the same NPV for P2 and P3. P2 makes a larger contribution to the reduction of CO2 emissions, however. Using the benefit–cost ratio as the decision criterion, P3 is superior to P2. P4 is the only alternative that reaches the goal of reducing GHG emissions from the transport sector by 70 % by 2030 but at a very high cost.
In the third part of the questionnaire, we started by gauging the respondents’ risk preferences. The respondents were asked to choose between a series of small sums of money with certainty (starting from 10 SEK; about 1 EUR or 1.2 USD and running up to 200 SEK) or a lottery with a 50 % chance of winning 300 SEK (31 EUR or 35 USD), the game stopping when the respondent chose the sum of money with certainty over the lottery. The answers were used to construct the variable Risk neutral/loving (RN/RL), which takes the value of one if the respondent is risk neutral or loving and zero if risk averse.Footnote 11
The third part of the questionnaire ended with a large number of questions examining the respondents’ attitudes. We used this information to construct two indexes of attitudes and aptitudes. Each index was constructed using the first components of principal component analysis. The first index (economic preferences) is composed of responses to questions about the importance of CBA, rationality, and cost-effectiveness. The variable is used as a proxy for the cost of doing a CBA (Proposition 3). The second index (environmental preferences) is composed of responses to questions about the importance of the natural environment, ecological sustainability, and reduced oil dependency. This variable is used as a proxy to test the intensity of preferences for the environment (Proposition 2). The responses to both these questions range from 1 (not at all important) to 6 (great importance). The correlation between economic and environmental preferences is 0.1032 (at the 5 % level of statistical significance).
Altogether there were
 $ 4\times 2=8 $
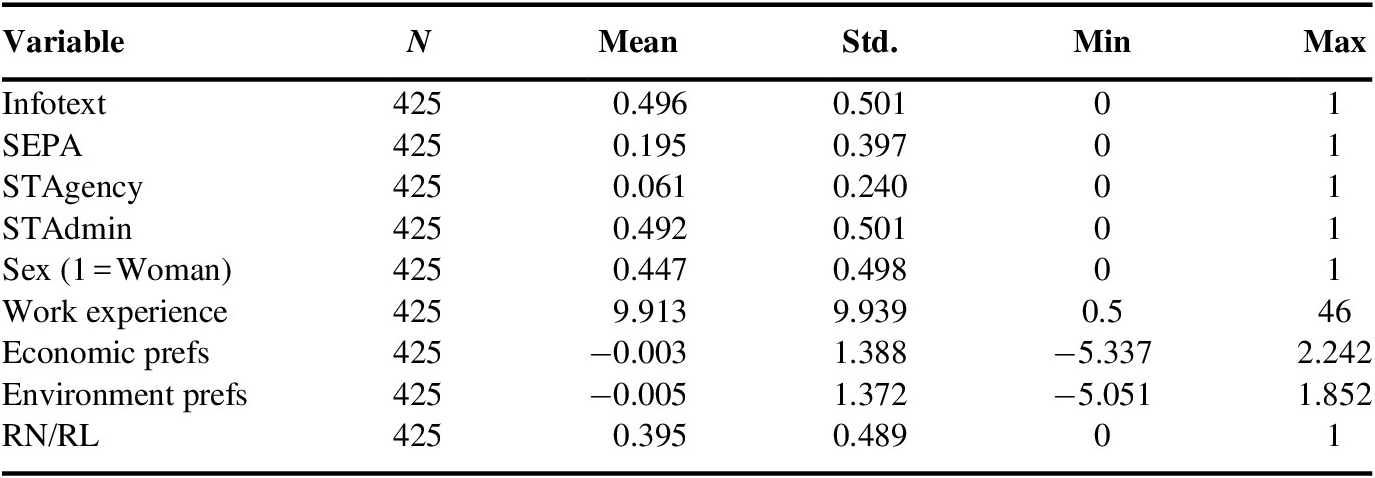
different versions of the questionnaire; four versions of the basic choice experiment questions, and two versions where half of the respondents received additional information about the policy context. The extra information contained, first, an explicit reminder of the CO2 reduction goal for the transport sector to be achieved by 2030, that is, a reduction by 70 % compared with 2010 levels, and second, a reminder of the alternative cost of public funds. This is similar to an ordinary willingness to pay study where respondents are reminded about their own income and budget constraint. The binary variable Infotext captures this aspect of the questionnaire; it takes the value of one for those who got the additional information and zero otherwise. The variables used are summarized in Table 3.
Descriptive statistics of the variables included in the regressions.

Abbreviations: SEPA, Swedish Environmental Protection Agency; STAdmin, Swedish Transport Administration; STAgency, Swedish Transport Agency; RL, Risk loving; RN, Risk neutral.
3.2 Data collection
The questionnaire was sent to 1,488 civil servants at five Swedish government agencies: the SEA, the SEPA, the STAdmin, the STAgency, and Trafa. These are the main agencies working with the transition to a fossil-free vehicle fleet by 2030. The data were collected in May 2017.Footnote 12 As noted above, eight versions of the questionnaire were used, and 185–188 copies of each version were sent out.
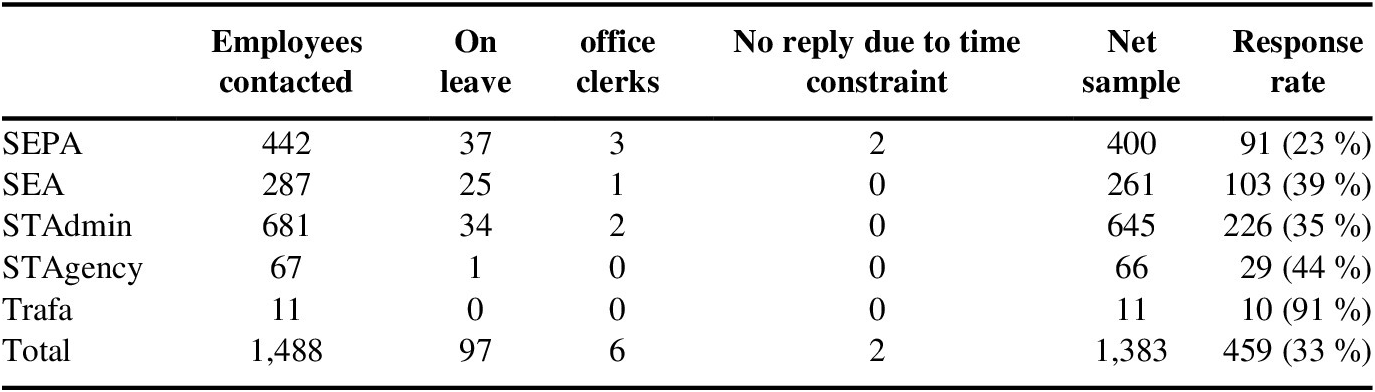
At SEA, SEPA, and STAdmin, we could send the questionnaire to all staff involved in policy-related work, including heads of office. Only office clerks were excluded from the sample at these agencies. At the STAgency, we received permission to send the questionnaire to a random sample of 67 out of about 243 relevant workers, and at Trafa to the 11 employees working with the economic analysis. The results of the data collection are summarized in Table 4. As can be seen, some respondents were on leave of absence or were not relevant for other reasons. Hence, the valid sample consists of 1,383 respondents.Footnote 13
Summary statistics for respondents from government agencies.

Abbreviations: SEA, Swedish Energy Agency; STAdmin, Swedish Transport Administration; STAgency, Swedish Transport Agency; SEPA, Swedish Environmental Protection Agency; Trafa, Transport Analysis.
The response rate varied considerably between the agencies. SEPA had the lowest response rate at 23 %, and Trafa the highest at 91 %. From comments sent by personal e-mail to the lead author as well as comments in the questionnaire, we found that there are several reasons for the variation in the response rate. An important one appears to be that bureaucrats are hesitant to answer questions outside their area of expertise. This may explain why the response rates from STAgency and Trafa are comparatively high while not all staff at SEA and SEPA work with transport-related questions. Moreover, the time available to answer the questionnaire appears to have been a limiting factor, and it seems the questions were considered complicated. Other comments along this line were that the choice questions do not reflect current management practices and/or that the questions do not fully reflect a more complex reality. Some respondents therefore deliberately chose not to answer the questionnaire. One person claimed that the reason for not replying was that bureaucrats only provide information to the decision-making process while the decisions and trade-offs are made by politicians. It is possible that only persons with a more favorable attitude to questionnaires of this type responded, which may above all bias the answers obtained from SEPA.
3.3 Description of respondents
Descriptive statistics of the respondents are provided in Table 5. A zero after the name of an agency indicates that the questionnaire version they received did not contain information about the emissions reduction goal and budget constraint (variable Infotext), and a 1 that the information was included.
Summary statistics for respondents per agency and questionnaire version (minima and maxima in parentheses).

Abbreviations: SEA, Swedish Energy Agency; STAdmin, Swedish Transport Administration; STAgency, Swedish Transport Agency; SEPA, Swedish Environmental Protection Agency; Trafa, Transport Analysis.
a 99 is used for those with a recorded time of over 1 h. In these cases, it is likely that they started to fill in the questionnaire, took a break and then came back later to complete.
The bureaucrats at STAdmin have worked the longest at the agency and also have the longest work experience. SEPA and STAdmin have the highest average ages of workers. Respondents at SEA, STAgency, and Trafa have relatively few years of work experience at their respective agency but especially employees at the STAgency have a lot of work experience from other jobs. One explanation for this is that STAgency is the result of a merger between previous regulatory agencies; hence, some of the employees have been working with these issues for a long time. A similar explanation applies for Trafa, which was created at the same time as STAdmin and STAgency. STAdmin together with STAgency have the lowest share of employees with a degree in economics, while Trafa has the highest. Regarding gender, there is some variation across agencies, with Trafa and STAgency having the lowest shares of women.
Summary statistics for risk preferences are shown in Table 6. The majority of individuals are risk averse, which is in line with standard economic theory. Breaking the numbers down by agency, we see that while risk aversion remains the biggest category in each case, there are marked differences in the degree of risk aversion, risk neutrality, and risk loving across agencies. These differences, however, are not statistically significant.
Results from analysis of risk aversion.

Abbreviations: SEA, Swedish Energy Agency; STAdmin, Swedish Transport Administration; STAgency, Swedish Transport Agency; SEPA, Swedish Environmental Protection Agency; Trafa, Transport Analysis.
The differences between individuals who have a degree in economics and those with other degrees are statistically significant (see bottom boxes of Table 6). Thus, workers with economics degrees are significantly less risk averse than individuals with other degrees, and significantly more risk neutral and risk loving.
We analyze the responses to the choice question in two ways. First, we provide non-parametric information on the response behavior of the different agencies. Secondly, we add the influence of individual-specific characteristics with a multinomial logistic regression.
4 Results
4.1 Non-parametric analysis of the influence of institutional norms
We start by examining the difference between the group that received extra information about a budget constraint and the emissions reduction goal and the group that did not receive this information (variable Infotext). In these analyses, 27 observations were excluded since those individuals chose P1.Footnote 14 We have applied the non-parametric approach in Kriström (Reference Kriström1990), testing the difference between the groups receiving different “treatments” as in Frykblom (Reference Frykblom1997). Figure 2 shows the empirical survival functions for the two groups in four of the five government agencies included. The data underlying the graphs are presented in the online Appendix A3.Footnote 15 Trafa is not included because of too few observations. The x-axis shows the average costs of, that is, the bids for, the status quo (the alternative of not choosing any of the programs) and P2–P4. On the y-axis are the shares accepting a certain bid. The black curve shows responses without Infotext and the grey curve displays the responses with it.
Empirical survival curves for STAdmin, STAgency, SEPA, and SEA. The grey curve shows responses with (indicated by 1) and the black curve shows responses without Infotext.

From the graphical presentation, we can see that there is heterogeneity in the response behavior. Based on the results from Eggert et al. (Reference Eggert, Kataria and Lampi2016), this was to be expected. There are some clear patterns in the behavior. First, a majority of the respondents at all agencies prefer P2, for which total cost is approximately equal to total benefit. This is illustrated in Figure 2 by the distance between points P3 and P2. As described in the online appendix, the share accepting this bid is in most cases above 50 %. Furthermore, the share of respondents choosing P4, which would achieve the 70 % reduction goal in CO2 emissions by 2030, is fairly stable for those not receiving additional information, at around 20 % (distance between point P2 and the end point, P4). It is somewhat higher for SEPA and STAgency and lower for STAdmin and SEA. However, providing additional information changes the response behavior by lowering the share of respondents accepting each bid, the difference being statistically significant for all agencies except STAdmin. In other words, with the additional information, a larger share of the respondents chose lower bids or status quo.
We use Pearson’s
 $ {\chi}^2 $
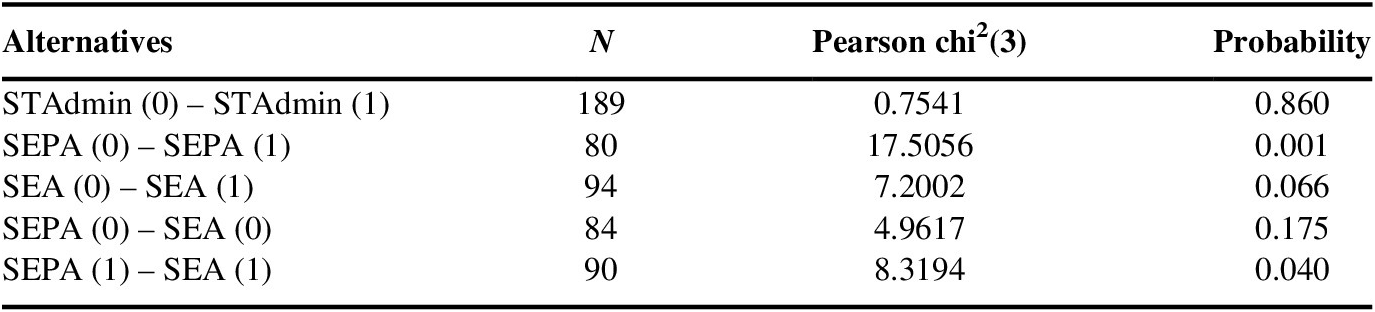
-test to examine whether the share accepting different bids at each agency varies systematically. Moreover, we test whether the responses differ systematically between SEA and SEPA. The results are presented in Table 7. Due to the small number of observations, these tests were not done for STAgency or Trafa.
Results from an
 $ {\chi}^2 $
test for the treated (1) and non-treated (0) groups.

Abbreviations: SEA, Swedish Energy Agency; STAdmin, Swedish Transport Administration; SEPA, Swedish Environmental Protection Agency.
Based on Table 7, we can reject the null hypothesis of no influence of the information text for SEPA but not for SEA and STAdmin. Moreover, there are statistically significant differences in response behavior between the respondents from SEPA and SEA.
The difference in response behavior between the different government agencies suggests support for Proposition 4 about the influence of a binding governmental budget constraint. The reasoning is as follows: Out of the three agencies studied, STAdmin is the one where the bureaucrats regularly work under a budget restriction since the investment funds available for the building of, maintenance of, and reinvestment in infrastructure are limited. It may then be that the bureaucrats at this agency automatically take a governmental budget constraint into consideration, without any extra reminders. The SEA is an “intermediate” case where, for example, those working with research funding regularly meet a budget constraint, while analysts probably more rarely have to consider one. As noted by Hultrantz (Reference Hultkrantz2009), environmental and energy policies more seldom meet a governmental budget constraint; instead, such policies are either revenue neutral for the state or generate an income. The exposure of the bureaucrats at SEPA and, to some extent, SEA to a budget constraint is limited.
Finally, we find that economic information appears to influence the response behavior. This is illustrated by the majority of respondents choosing the alternative where the total cost is approximately equal to the total benefit (P2). Including information about a budget constraint for SEPA and SEA reduced the share accepting the alternative with the highest bid (P4), which would achieve the politically stated reduction goal. These results therefore strongly suggest that having information about the economic costs of policy will put restraints on bureaucrats’ decision-making and force them toward an outcome that is closer to a social optimum. To examine the issue further, we next turn to regression analysis.
4.2 Regression analysis of the influence of both institutional norms and individual characteristics
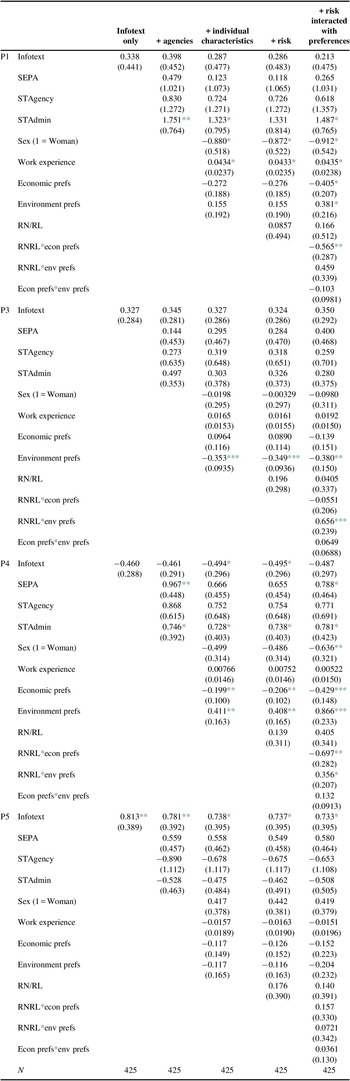
To further investigate the response behavior, we undertook a multinomial logistic regression. The results are presented in Table 8. We present five models, the first with only the two treatment groups (Infotext), the second with SEPA, STAgency, and STAdmin added, and SEA and Trafa thus being treated as the base agencies, the third with individual characteristics added, the fourth with an indicator of being risk neutral/loving, and finally a model that includes an interaction between being risk neutral/loving and economic and environmental preferences.Footnote 16 The base program in the regressions is P2 (see Table 2).
Results from a multinomial logistic regression.

Abbreviations: RL, risk loving; RN, risk neutral; STAdmin, Swedish Transport Administration; STAgency, Swedish Transport Agency; SEPA, Swedish Environmental Protection Agency.
* p < 0.1.
** p < 0.05.
*** p < 0.01.
Looking at the results for the first model, they confirm the findings from the non-parametric analysis. Including additional information (Infotext) implies that respondents are more likely to choose the status quo option (=P5 in the table) and are less likely to choose P4 in some specifications. Including the government agencies (the second model), we find that respondents at SEPA are more likely to choose P4 than those at SEA and Trafa, and that this seems to be driven by higher environmental preferences (the third model).
Turning to individual characteristics, work experience is only (weakly) significantly positive in the case of P1. Female bureaucrats are less likely to choose P1 in all models and less likely to choose P4 in the full (fifth) model. Stronger environmental preferences are significantly and negatively related to the choice of P3, and significantly and positively related to the choice of P4. Similarly, strong economic preferences are significantly and negatively related to the choice of P4 but are insignificant in the choice of P3. The latter result may reflect the fact that both P2 and P3 can be justified on economic grounds, and therefore economic preferences do not play a significant role in the choice between the two. However, P2 does result in a greater reduction of emissions compared to P3, which may explain why environmental preferences play a role in the choice between the two.
Risk preferences on their own do not play a significant role in the choice of program to recommend but the interactions between risk preferences on the one hand and economic and environmental preferences on the other are significant in some cases. To aid the interpretation of the relationship between risk, preferences and choice of program, we summarize the properties of the five programs and the predicted properties these have in the left-hand panel of Table 9, which is based on Table 1. The right-hand panel of the table contains a summary of the significant regression results from Table 8, model 5. The base case, against which we compare the results, is P2, which has the profile of being chosen by a risk-averse bureaucrat with medium environmental preferences and a low cost of doing a CBA. From Table 6, we see that the majority of bureaucrats are risk averse, and a majority of the bureaucrats also chose P2 (56.24 % of the respondents). Moreover, the average bureaucrat has slightly negative economic (−0.003) and environmental preferences (−0.005).
Properties predicted to raise the probability of choosing the respective programs in the left-hand panel, and an interpretation of the regression results from model 5 in the right-hand panel.

Abbreviations: RL, Risk loving; RN, Risk neutral.
Interpreting the right-hand side of Table 9, we note that the impact of the cost of doing a CBA (economic preferences) has the expected sign for P1 – those with a low cost of doing a CBA are less likely to choose the inefficient P1. Moreover, the finding that risk-averse individuals with high environmental preferences prefer P1 lends support to Hypothesis 2.
The impact of environmental preferences on the probability of choosing P3 over P2 is as predicted by Proposition 2 and lowers the probability of choosing the cost-efficient alternative P3. The other significant coefficient, the interaction between RN/RL and economic preferences indicates that risk neutral/loving individuals with low cost of doing a CBA choose P3. This finding, too, lends support to Hypothesis 2, besides supporting Proposition 3.
Finally, the impact of the cost of doing a CBA (economic preferences) on the probability of choosing P4 is as expected according to Proposition 3, that is, bureaucrats with a low cost of doing a CBA are less likely to choose the cost-inefficient alternative. Even the impact of environmental preferences is as predicted by Proposition 2, that is, bureaucrats with high ideological beliefs choose the program that reaches the environmental goal. Moreover, the fact that the risk-neutral/loving individuals with high environmental preferences are less likely than their risk-averse peers to choose P4 lends support to Hypothesis 2 and Proposition 2. Finally, the risk-neutral/loving individuals with high economic preferences (low cost of doing a CBA) were in fact predicted to choose P2 or P3 by Hypothesis 2. That they are also less likely to choose P4 than the risk-averse individuals with a low cost of doing a CBA is in line with the model.
We conclude that the model fares very well when confronted with data. Thus, we find support for all three of the tested Propositions, that is, 2, 3, and 4. Moreover, the data lend support to Hypothesis 2. We thus reject Hypothesis 1 and conclude that the bureaucrats behave as if they are risk averse with respect to environmental outcome.
5 Summary and conclusions
This paper has examined a bureaucrat’s incentives to carry out or to take into consideration information from a cost–benefit analysis (CBA). The theoretical framework for this choice is a delegation model, where CBA is a form of delegation since we assume that not doing a CBA leads to decision-making under uncertainty. The main contribution of the paper is the surveying of civil servants at five Swedish government agencies, data from which is used to test the theoretical model against empirical data.
The theoretical model in the paper rests on a few assumptions. The most important is that the bureaucrats’ assessment of the uncertainty pertaining to the policy outcome is heterogeneous among bureaucrats. The second one is that the bureaucrats are risk averse. Without risk aversion, the civil servants would be indifferent between obtaining the expected value of their preferred policy with and without certainty. The third assumption is that uncertainty about the policy outcome can be mitigated by doing a CBA. We do not assume a specific distribution of the shock. The model, therefore, applies for fairly general circumstances.
According to theory, the three main factors driving a bureaucrat’s propensity to do a CBA are their risk averseness, their preferences for environmental quality, and the cost of doing a CBA. The data lend support to these hypotheses. Thus, a bureaucrat who is risk averse with respect to the environmental outcome, that is, who is afraid of not reaching their desired environmental outcome, is less likely to do a CBA than a risk-neutral/loving one. Moreover, a bureaucrat with high preferences for environmental quality is less likely to do a CBA than a bureaucrat with less extreme environmental preferences. Finally, increasing the cost of doing a CBA reduces the probability of doing one. Thus, a risk-averse bureaucrat with high environmental preferences and a high cost of doing a CBA is the least likely candidate to do a CBA and tends to choose the most environmentally far-reaching alternative with a greater probability than other bureaucrats. On the other hand, bureaucrats who are more neutral in their preferences, who are risk neutral/loving, and who have a low cost of doing a CBA are more likely to choose a cost-efficient environmental policy, however, with less environmental benefits than the equally cost-efficient base case.
We also examine a fourth possible explanation to the propensity to do a CBA, namely an institutional aspect. The presence of a governmental budget constraint may raise the probability of a bureaucrat doing/using information from a CBA. We find that a reminder of the existence of a budget constraint makes the bureaucrats more likely to choose less costly alternatives or even the status quo. Thus, we find support for this hypothesis.
CBA as a delegation mechanism within this simple model can explain some circumstances in which a bureaucrat would not be interested in doing/using information from a CBA. These include risk aversion with regard to the environmental outcome, high preferences for the environment, and the cost of doing a CBA. Other reasons for the lacking use of CBAs have been studied by Hammes (Reference Hammes2017). That paper identifies cognitive dissonance as an important factor and notes that a binding governmental budget constraint can induce an otherwise unwilling bureaucrat to do a CBA. The present paper adds the importance of educating bureaucrats about the uses of a CBA.
Supplementary Materials
To view supplementary material for this article, please visit http://dx.doi.org/10.1017/bca.2020.23.