Surgical site infections (SSI) are the most common healthcare-associated infection in the United States.Reference Anderson, Pyatt, Weber and Rutala 1 , Reference Magill, Hellinger and Cohen 2 SSI account for 31% of healthcare-associated infections 3 and constitute $3.5 billion to $10 billion annually in healthcare costs.Reference Anderson, Podgorny and Berrios-Torres 4 Despite the tremendous impact of SSI on healthcare, however, our knowledge of some SSI risk factors remains poorly understood.
The risk of SSI following surgical procedures may vary on the basis of season. For example, Gruskay et alReference Gruskay, Smith and Kepler 5 identified higher SSI rates following spinal procedures during the summer months in a single-center study at an academic medical center. Kane et alReference Kane, Chen, Post, Radcliff, Orozco and Ong 6 identified higher SSI rates following total joint arthroplasties during the summer and fall versus the winter and spring in another single-center study at an academic medical center. These studies, however, were limited to single academic centers and specific surgery types.
We recently identified higher rates of SSI during the summer following laminectomies and spinal fusions in a multicenter study of community hospitals.Reference Durkin, Dicks and Baker 7 Following this analysis, we wanted to determine whether this same seasonal trend was present after expanding our scope to other commonly performed procedures, including nonspinal surgeries.
The objective of our study was to determine whether the rate of SSI following common surgical procedures varies by season in a network of community hospitals.
METHODS
The Duke Infection Control Outreach Network is a network of community hospitals in the southeastern United StatesReference Anderson, Miller and Chen 8 ; it provides infection control consultation and educational services to more than 40 hospitals in 5 states. Infection preventionists at each hospital use standardized National Healthcare Safety Network definitions to prospectively identify SSI cases.Reference Mangram, Horan, Pearson, Silver and Jarvis 9 Cases are identified through review of microbiology records, hospital readmissions, and postdischarge questionnaires. These methods have been previously validated.Reference Kaye, Engemann, Fulmer, Clark, Noga and Sexton 10 , Reference Kaye, Sloane, Sexton and Schmader 11 Infection preventionists prospectively enter demographic, clinical, surgical, and microbiologic data into a local database. Patient identifiers are removed from the data before transmission to a centralized surgical database in the Duke Infection Control Outreach Network.
We performed a retrospective analysis of surgical surveillance data collected from January 1, 2007, through December 31, 2012, from 20 network-affiliated hospitals (median size, 291 beds [range, 50–490 beds]). These 20 hospitals were included in this analysis because they contained complete surgical surveillance data for the entire 6-year study period. Except for 2 hospitals, all facilities included in our analysis were nonteaching institutions. Analyses excluding the 2 teaching hospitals did not change our findings (data not shown).
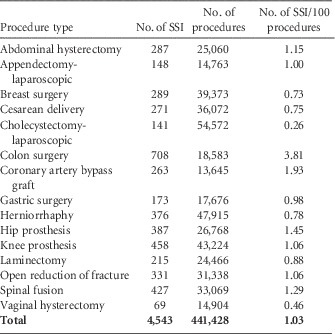
Only the 15 most common surgical procedures in our network were included in the analysis (Table 1). Other variables included patient age, procedure date, procedure type, American Society of Anesthesiologists classification score, and wound classification score. SSI were defined using National Healthcare Safety Network criteria.Reference Anderson, Podgorny and Berrios-Torres 4 Prevalence rates for SSI were calculated as number of SSI per 100 procedures.
Summary of 4,543 Surgical Site Infections (SSI) Isolated in 20 Community Hospitals From January 1, 2007, Through December 31, 2012, Stratified by Procedure Type

We evaluated the seasonality of SSI following common procedures using 3 approaches. First, we performed unadjusted Poisson regression analysis and calculated prevalence rates, prevalence rate ratios (PRRs), and 95% CIs. Summer was defined as July through September, which corresponds to the conventional definition of summer used in other studies.Reference Gruskay, Smith and Kepler 5 , Reference Anderson, Richet and Chen 12 – Reference Eber, Shardell, Schweizer, Laxminarayan and Perencevich 14 Season was defined by month that surgery was performed (not date of infection). We repeated the unadjusted regression after stratifying by procedure and organism type. Second, we created a multivariable Poisson regression model with “summer” as the a priori dependent variable of interest while controlling for known risk factors for SSI routinely collected in our database, including American Society of Anesthesiologists score, wound classification score, and operative duration. Age was modeled as a continuous variable. Operative duration cutoff points were selected on the basis of published Centers for Disease Control and Prevention National Healthcare Safety Network score criteria.Reference Mangram, Horan, Pearson, Silver and Jarvis 9 Parameter estimates were calculated using least squares mean with variables-added-last method. Third, we constructed models using polynomial Poisson regression to visualize the trend in risk of SSI by month of the year. We first defined month as a categorical variable to calculate specific SSI rate point estimates by month. Then, we modeled month as a continuous variable, using first-, second-, and third-order polynomial terms to visually asses a best-fit regression line. The polynomial analyses were performed for SSI due to all organisms, SSI due to gram-positive cocci, and SSI due to gram-negative bacilli.
We performed a sensitivity analysis to determine whether findings varied on the basis of the definition for summer. We repeated the above approaches using alternative definitions of summer based upon temperature definitions (June through August) and both temperature and equinox-based definitions (June through September). In addition, we performed an analysis of variance stratified by season to confirm that “summer” SSI rates were statistically higher than those of the other seasons.
All statistical analyses were performed using SAS, version 9.3 (SAS Institute). P<.05 was considered statistically significant for all analyses.
RESULTS
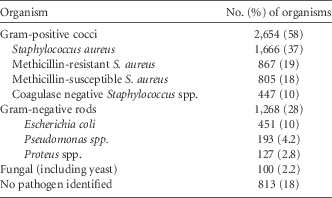
A total of 4,543 SSI were observed following 441,428 procedures during the 6-year study period (overall prevalence rate, 1.03/100 procedures). SSI rates varied by procedure type from 0.26/100 procedures for laparoscopic cholecystectomy to 3.18/100 procedures for colon surgery (Table 1). SSI were caused by a variety of pathogens including gram-positive cocci (2,654 [58%]), gram-negative bacilli (1,268 [28%]), and fungal pathogens (100 [2.2%]) (Table 2). Staphylococcus aureus (1,666 [37%]) was the most common cause of SSI.
Summary of Pathogenic Organisms Causing 4,543 Surgical Site Infections Following 15 Commonly Performed Procedures in 20 Community Hospitals From January 1, 2007, Through December 31, 2012

NOTE. Organisms from polymicrobial infections were counted more than once in total. List contains only most commonly identified organisms and is not exhaustive or exclusive.
Analyses of All SSI
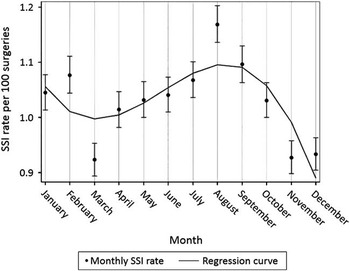
Unadjusted Poisson regression analysis of all procedures revealed that the rate of SSI in the summer was higher than the rate in the remainder of the year (1,223/109,996 procedures vs 3,320/331,432 procedures; unadjusted PRR, 1.11 [95% CI, 1.04–1.19]; p=.002) (Table 3). Summer remained an independent risk factor in our multivariable regression model after adjusting for other common SSI risk factors (PRR, 1.11 [95% CI, 1.10–1.12]; P<.001). Polynomial regression analysis for all SSIs revealed significant variation of SSI by month (Figure 1).
Surgical site infection (SSI) prevalence rate per 100 procedures by month for all organisms and common procedures. Polynomial regression analysis resulted in a best-fit line that shows statistically significant seasonal variation with the highest SSI prevalence rate during the summer months.

Prevalence Rate and Prevalence Rate Ratios of Surgical Site Infections (SSI) per 100 Procedures Stratified by Spinal and Nonspinal Procedures and by Pathogen Type in 20 Community Hospitals From January 1, 2007, Through December 31, 2012

NOTE. GNR, gram-negative rods; GPC, gram-positive cocci.
a Summer was defined as July through September.
Analyses of SSI Stratified by Pathogens
The rates of SSI remained higher during the summer months after stratification by pathogen (Table 3). Specifically, SSI due to either gram-positive cocci (PRR, 1.09 [95% CI, 1.00–1.19]; P=.04) or gram-negative bacilli (1.24 [1.10–1.40]; P<.001) were more common during the summer (Table 3). Polynomial regression analysis also revealed a peak in SSI cases during the summer months for both gram-positive cocci and gram-negative bacilli (data not shown).
Analyses of SSI Stratified by Procedure
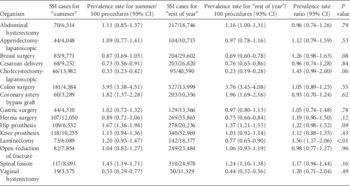
The rates of SSI were higher during the summer months when we stratified our results by spinal and nonspinal procedures (Table 3). Specifically, SSI following both spinal procedures (PRR, 1.29 [95% CI, 1.08–1.52]; P=.004) and nonspinal procedures (1.08 [1.01–1.16]; P=.03) were more common during the summer. When we stratified our results by individual procedure type, several procedures demonstrated a trend towards seasonal variation, but this difference was statistically significant only for laminectomies (Table 4).
Overall Rate of Surgical Site Infections (SSI) per 100 Procedures and the Rates of SSI per 100 Procedures Stratified by Spinal and Nonspinal Surgical Procedures in 20 Community Hospitals From January 1, 2007, Through December 31, 2012

Sensitivity Analysis
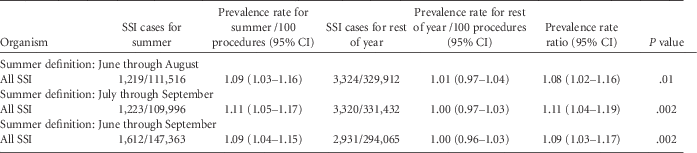
SSI rates remained higher during the summer when we defined summer as June through August (PRR, 1.08 [95% CI, 1.02–1.16]; P=.01) or June through September (1.10 [1.03–1.17]; P<.01) (Table 5). These findings were also statistically significant both when we performed stratified analysis by pathogen type and when we performed an analysis of variance specifically comparing summer with other seasons (data not shown).
Overall Rates and Prevalence Rate Ratios of Surgical Site Infections (SSI) per 100 Procedures and the Rates of SSI per 100 Procedures Using 3 Definitions of Summer in a Network of 20 Community Hospitals From January 1, 2007, Through December 31, 2012

DISCUSSION
Our large, multicenter study demonstrated that rates of SSI after surgical procedures commonly performed at community hospitals were highest during the summer months. This seasonal effect was present among both gram-positive and gram-negative SSI and for spinal and nonspinal surgical procedures. In addition, our findings were robust on the basis of a sensitivity analysis and were independent of other common SSI risk factors. To our knowledge, our study contains 2 “firsts” in the surgical literature. Specifically, our study was the first to demonstrate seasonal variation in a cohort of commonly performed surgical procedures. Our study was also the first to clearly demonstrate the seasonality of gram-negative SSI following surgical procedures.
Several studies have previously demonstrated an increase in bloodstream infections, urinary tract infections, and dialysis-associated peritonitis due to gram-negative rods in the warmer, summer months.Reference Anderson, Richet and Chen 12 , Reference Falagas, Peppas, Matthaiou, Karageorgopoulos, Karalis and Theocharis 15 , Reference Cho, Badve and Hawley 16 Proposed risk factors for the increase in infections due to gram-negative rods in the summer include temperature, humidity, and human behavior (eg, dietary habits and recreational activities).Reference Eber, Shardell, Schweizer, Laxminarayan and Perencevich 14 , Reference Freeman, Anderson and Sexton 17 – Reference Barben, Hafen and Schmid 19 For example, Ramos et alReference Ramos, Rocha and Tuon 20 concluded that the incidence of Pseudomonas aeruginosa infections in a 660-bed tertiary care medical center in Brazil increased with climatic changes. Urinary tract infections were associated with higher precipitation (P=.04) and temperature (P=.02), whereas hospital-acquired pneumonia was associated with humidity (P=.03) and precipitation (P=.03).
Several other nonsurgical gram-positive cocci infections peak during the summer. For example, S. aureus skin and soft-tissue infections peak during the summer. In fact, Leekha et alReference Leekha, Diekema and Perencevich 21 performed a systematic review on S. aureus epidemiology and found that 31 (76%) of 41 studies on S. aureus infection or colonization varied on the basis of season. In particular, all 10 studies that specifically addressed skin and soft-tissue infections noted higher rates in the summer and fall compared with the rest of the year. Similarly, a recent time series analysis of 51,287 pediatric skin and soft-tissue infection clinical encounters found that rates of S. aureus infection were highest in the summer months.Reference Wang, Towers, Panchanathan and Chowell 22 In addition, Mermel et alReference Mermel, Machan and Parenteau 23 determined that seasonal variation of S. aureus, specifically community-acquired methicillin-resistant S. aureus, occurred in both adult and pediatric populations. Peritonitis infections involving coagulase-negative Staphylococcus also appear to be more common during the spring and summer.Reference Cho, Badve and Hawley 16
Seasonal variation of infections may occur for several reasons. First, skin and soft-tissue infections due to S. aureus seem to occur in warmer environments. For example, Wang et alReference Wang, Towers, Panchanathan and Chowell 22 identified a significant correlation between the incidence of methicillin-resistant S. aureus skin and soft-tissue infections in children and the mean temperature and humidity in Maricopa County, Arizona. McBride et alReference McBride, Duncan and Knox 24 also found that S. aureus bacterial populations on the skin are significantly higher during warm and humid months. Second, skin-to-skin contact, one of the easiest methods to transmit bacterial pathogens, may increase in frequency during the summer. In fact, Hens et alReference Hens, Ayele and Goeyvaerts 25 performed mathematical modeling that suggested that human skin-to-skin contact was most common during the weekends or school holidays–such as the summer in the United States. Third, skin disruption may be more common during the summer. For example, Skull et alReference Skull, Krause, Coombs, Pearman and Roberts 26 identified that skin sores and ulcers were a significant risk factor for S. aureus infections during an outbreak investigation performed during the summer months. Finally, summer months also have higher rates of trauma-related admissions, and trauma is a known risk factor for SSI.Reference Mu, Edwards, Horan, Berrios-Torres and Fridkin 27
Our study has limitations. First, our study included surveillance data with limited patient information. Thus, we were unable to address multiple other known risk factors for SSI following surgery, including diabetes mellitus, prior SSI, trauma, and presence of obesity. However, we took some of these factors into account by including the American Society of Anesthesiologists score in our multivariable model. In addition, repeat analyses restricted to only nonemergency surgeries also demonstrated statistically higher SSI rates during the summer (data not shown); thus the higher observed SSI rates during the summer were unlikely to be related to trauma. Second, the PRRs demonstrating seasonal variation, although statistically significant, were low and close to the null. However, our results were robust because seasonal variation was identified after stratification based on organism type and using multiple definitions of summer. In addition, multivariable regression analysis demonstrated summer as an independent risk factor for SSI after controlling for other known risk factors. Given the morbidity and cost associated with an individual SSI, further investigation into both elucidating the underlying factors driving the observed variation in seasonal site and determining ways to mitigate these risks is warranted.
CONCLUSIONS
To our knowledge, our multicenter study is the first to evaluate the seasonality of SSIs following common surgical procedures performed in a network of community hospitals. SSIs were more common during the summer months compared with the rest of the year after controlling for multiple known SSI risk factors; this finding was present for both gram-positive cocci and gram-negative rods.
Acknowledgments
Financial support. None reported.
Potential conflicts of interest. All authors report no conflicts of interest relevant to this article.