


Introduction
Here we report the results of crushing experiments using a crushing friction apparatus primarily as an indentor. The apparatus permits visual observation of the contact zone between ice specimens and the crushing friction surface. New insights have been gained into the crush¬ing phenomenon by extensive use of video equipment for visual analysis of the experiments.
Of particular importance was the question of what mechanism acts as the major energy consumer in the indentation/impact process. At several points in this paper, rough estimates have been calculated for various quantities. This has been done with the goal of demonstrating the consistency of the data with the present interpretation of the ice behavior, rather than to provide accurate values for the various parameters involved, which is left for future work.
Apparatus
The crushing friction apparatus (Fig. 1) and data acquisition system have been described in detail byGagnon and Mølgaard (Reference Gagnon, Mølgaard, Jones, McKenna, Tillotson and Jordaan1989). The crushing friction apparatus consisted of an ice specimen holdersupported by an actuator which crushed ice by pulling specimens onto the outer surface of a hydraulically driven rotating wheel. In the tests described here, the actuator was servocontrolled to move at a constant rate of displacement. The response to error signals was within 12 ms. The apparatus was housed in a portable cold room which had a window installed at the level of the ice holder so that video records of the experiments could be made. Recently, the apparatus was modified by cutting a 50 mm circular view port through the bottom of the ice holder. A glass plate with a thickness of 19 mm was then put in the bottom of the holder for the ice specimens to rest on. A mirror mounted beneath the ice holder and specimen permitted a view through the window of the cold room up through the clear ice samples to the top surface of the ice where the indentation process took place. A flood lamp positioned beside the video camera provided illumination along the same view path. All tests were performed at —9°C.
Crushing friction apparatus: A) hydraulic actuator; B) load cell; C) mild steel wheel (indentor); D) load cell for measuring tension and bending (required in friction experiments); E) ice specimen; F) specimen holder; G) video camera; H) mirror.

The compliance of the indentor apparatus was measured directly, using a hydraulic jack positioned between the ice holder and the indentor wheel. Load was applied with the jack and the displacement of the specimen holder relative to the indentor was measured with a displacement device accurate to within0.01 mm. The measured compliance was 5.2 × 10⁻⁸ m N−1 ±5%. In the analysis below, this compliance was used to calculate the displacements of the specimen holder and associated energies corresponding to the drops in load which occurred in the indentation load records (Fig. 2). Tests were run at two actuator displacement rates, 3.3 and 7.0 mm s−1.
A Panasonic Super VHS video camera and JVC video cassette recorder were used for these experiments. This provided 30 frames per second with shutter durations down to 1/1000 s. The video cassette recorder enabled slow motion and frame-by-frame playback, so that regions in frames of interest could be traced out on overlaying transparent film and then digitized using a HI-STATE Precision Coordinate Digitizer. A shutter duration of 1/500 s was used for the indentation tests. Some of the rapid action recorded during the tests was blurred even at the highest shutter speed. Consequently, for the small-scale impact tests described below, it was necessary to use a stroboscope in conjunction with the video camera to obtain effective shutter durations of ~ 11 μs which could freeze all of the action. Synchronization of the video record with the data acquisition system was achieved by taking the video output from thevideo camera and feeding it directly into one channel of the data acquisition system. At the start ofa test, the flood lamp was blocked by an opaque sheet of cardboard which was suddenly pulled away from the lamp to shed illumination on the indentor apparatus. The sudden increase in illumination showedup abruptly on the video output and consequently in the data record. This method yielded synchronization to within 1/60s. When necessary, more accurate synchronization was attained by comparing video events, such as specific load drops, with the load record.
Time-series load record for a typical indentation test. The actuator speed is 0.33 cm s−1.

Sample Preparation
Samples were produced by freezing filtered, degassed, deionised water in containers with insulated walls and bottom. The water was left unseeded on the surface so that large ice platelets formed, resulting in large-grain (>3cm diameter) columnar, bubble-free ice. Specimens were cut into 10 × 10 × 8 cm3 blocks with shallow truncated peaks on top to localize the initial contact in the central region of the sample during tests. The tops of the specimens were glove-smoothed to remove any small irregularities that would lead to premature failure. Once the samples had been prepared for testing they were installed in the indentation apparatus with the columnar grains orientated parallel to the axis of loading. Since the focus of the tests was to obtain visual documentation of the crushing process by viewing through the ice specimens, it was very important to minimize the number of large cracks through the bulk sample during indentation tests which might obscure the view of the region of interest. This was achieved by first ensuring that the samples were bonded to the glass plate which rests on the bottom of the ice holder. This confined the base of the sample. The surface of the plate was sandblasted except for a circular region directly over the view port in the holder. Specimens were melted onto the top of the glass plate and placed in a cold room where the mcltwatcr froze, thus securely bonding the ice to the roughened glass. The sample and glass plate were then placed in the ice holder. The small space (~ 1 mm) between the sides of the holder and the ice was partially filled with snow, and then water at 0°C was added which quickly froze to provide additional confinement around the specimens. These precautions ensured that a specimen usually stayed intact throughout the region between its base and the area of indentation, thus providing, in most cases at least, an unobstructed view of the region of interest.
Description of a Typical Indentation Test
A typical indentation test proceeded as follows. When the indentor first made contact with the ice, the specimen stayed intact until a sufficiently high load (around 10 kN) caused large cracks to occur in the bulk sample. During this time of initial stress buildup (A in Fig. 2; three to eight frames onthe video record, depending on the actuator displacement rate), the video record of the view through the bottom of the ice holder clearly showed a transparent, nearly circular or elliptical area where the indentor made contact with the ice. This area had a liquid-like appearance and sometimes a shiny ridge visible at the perimeter. This developed whether the indentor was stationary or rotating. Table 1 shows data corresponding to both cases. Pressures (90 ± 24 MPa) determined from the digitized areas (ranging from ~ 16 to 210 mm 2),and the load records for the case where the indentor wheel was not rotating, were comparable to the pressures (99 ± 38 MPa) obtained when it was rotating. For the tests where the wheel was rotating, thefriction coefficient was very low during the initial segment of stress buildup, indicating that a lubricating layer was present. Tusima (Reference Tusima1977) reported contact pressures in the 90 MPa range for friction experiments with a steel ball on a single crystal of ice at — 10°C. The phase diagram of water indicates that ice is near the melting point at 90 MPa and -9°C (Hobbs, Reference Hobbs1974). A lip of ice around the rim of the contact area between the ice and a steel indentor has also been observed in indentation hardness experiments and has been attributed to refrozen liquid produced by pressure melting (Barnes and Tabor, 1960). These observations arc consistent with the presence of a thin layer of liquid water between the ice and the indentor, produced by pressure melting.
Initial contact pressure and actuator displacement rates for tests with the indentor wheel stationary and rotating

As load increased, the size of the contact area increased. Eventually the ice abruptly cracked and the ice holder rapidly moved forward (~ 0.5 mm) relieving elastic strain in the apparatus, and the indentation load registered on the data acquisition system immediately dropped (B in Fig. 2). After the first break in the ice specimen, the actuator continued to move ahead and load began to accumulate on the remaining ice until an other fracture occurred. After each failure the visual record usually showed an irregular-shaped darktransparent patch(es) that was obviously in direct contact with the indentor, since the indentor surface was sometimes clearly visible through it. This patch (Fig. 3) was usually surrounded by very tinydensely packed ice crystals with a powder-like appearance, and small ice pieces resulting from spalling. Hence the patch appeared dark in comparison. Unlike the contact patch during the initial stress buildup (A in Fig. 2), the size and shape of the patch seen at this stage hardly changed as the load rose until another failure occurred resulting in a sudden drop again in the indentation load. The nextvideo frame then showed a different transparent patch with powdered ice around the edges. The frequency of the failure episodes, which make up the sawtooth load pattern, depended on the rate at which the actuator pulled the ice holder against the indentor. After a few of these episodes, the sample had usually taken on the shape of a truncated mountain peak or ridge (sometimes multiple) where the very top, which corresponded to the clear patch in the videos, was flush against the indentor. A conglomerate of powdered ice and small ice particles were present around the top and slopes.
View of the ice/indentor contact zone through the bottom of the specimen liolder. Lines radiating out from, the central area correepond to features on the slope of the peak-shaped ice specimen.

A sawtooth load pattern is typical of many indentation experiments reported in the literature (e.g. Määttänen, Reference Määttänen1983; Michel and Blanchet, Reference Michel and Blanchet.1983; Evans and others, 1984; Sodhi and Morris, Reference Sodhi and Morris.1984; Timco and Jordaan, 1987). In the present work, the heights of the sawtooth peaks usually increased as an indentation experiment progressed because of the confinement of the sample by the specimen holder.
Interpretation
It was clear from these observations that most of the forward motion of the ice holder (Fig. 4) occurred during the sudden drops in load which accompany failure in the ice specimens (e.g. Β in Fig. 2). In these episodes, the elastic energy stored in the indentor apparatus and the ice specimen was dissipated. The motion was very rapid (~ 6 cm s−1) compared to the actuator speed of 0.33 or 0.70 cm s−1. The rapid load drops are interpreted as follows.
Time-series displacement records for the ice holder and the actuator for the same test illustrated in Fig. 2. The ice holder displacement was obtained by subtracting the product of the time-series load record (Fig. 2) and the compliance of the apparatus from the actuator displacement.

After each failure and drop in load, the actuator continued to move forward and load the contact area, which consisted of undamaged ice and surrounding conglomerate of powdered ice and spalls. The strength of the surrounding conglomerate probably provided some degree of confinement for the undamaged ice. The load accumulated until a part of the remaining ice broke away causing a large reduction in contact area (Fig. 5). Because the contact area was then greatly reduced, the pressure on the contact region was very high, though the net force exerted by the ice was less. This caused rapid pressure melting and extrusion on top of the peak-shaped undamaged ice, allowing the ice holder to jump ahead. Theinertia of the rapidly moving ice holder (mass ~ 70 kg) contributed to the pressure on the remaining ice as it decelerated. Eventually, the increase in contact area of undamaged ice, and the reduction in load as the strain in the equipment and ice was released, reached a point where the load of the indentor could be borne by the ice. At this point the ice holder stopped its forward motion. Then load began to accumulate on the contact area until another piece(s) spalled away starting the cycle again. This cycle repeated itself fairly regularly during the indentation experiment.
Schematic diagram of the spalling process.

Itagaki and others (Reference Lemieux1989) noted the possibility of rapid ejection and refreezihg of high pressure liquid from under the runners of sleds used in ice friction experiments to explain the surface structureof the runner tracks left on the ice, though it was not clear from the tests how the liquid was produced (i.e. by pressure melting and extrusion and/or by frictional heating).
Small-Scale Impacts
Occasionally, during some indentation experiments, a video frame would capture the behavior of the ice at the instant of one of the failures. These frames indicated that the pressure melt spot was formed continuously as the ice holder moved forward; ejected material could be seen moving rapidly away from the high pressure contact zone. To confirm further that a continuous process of pressure melting and extrusion was occurring rapidly during the drops in the sawtooth load pattern of these indentationtests, a series of small-scale impact tests was performed at —9°C and recorded visually. Hand-held samples of ice were smashed onto the surface of a thick (19 mm) glass plate. A video camera recorded each test by viewing the contact zone from the other side of the plate using the macro feature of the camera to improve resolution. A stroboscope flashing at 60 Hz provided short duration (~ 11/µs)light pulses so that all motion during the impact was frozen. In each instance where the video cameracaptured an impact, there was a transparent undamaged area (similar to Fig. 3) in direct contact withthe glass. This area was surrounded by small ice pieces that had spalled from the sides of the contact zone and by powdered ice which presumably had recrystallized from the water extruded from the high pressure contact zone. After each impact, a small mass of powdered ice and spalls was bonded to the glass, evidence that the extruded material was partially liquid and had quickly frozen to the glass. Other researchers (e.g. Kheysin and Cherepanov, Reference Kheysin and Ν. V.1970) have also reported the presence of liquid water mixed with the damaged ice produced by impacts. In the crushing friction experiments reported here and in previous experiments (Gagnon and Mølgaard, in press), it was observed that each failure in the ice specimens resulted in a small mass of very fine powdered ice freezing to the rotating indentor wheel.
On close inspection of the portion of the samples which experienced the impacts, one could sometimes see a very thin shiny intact plate of refrozen ice. This plate radiated out from the high pressure contact zone and covered the damaged ice conglomerate of powdered ice and spalls which surrounded the high pressure zone. The thickness of the plate was estimated to be much less than 1 mm. A true thickness measurement was not possible because the refrozen plate was bonded to the ice conglomerate. This observation further supported the existence of a thin layer of water flowing in the region of high contact pressure during the indentation process.
Energy Dissipation
In this section, it will be shown that the magnitude of the transparent pressure melt area and the displacement of the ice holder at the load drop correlate. From this, the volume of ice removed by the melt/extrusion process
Ice holder displacement, transparent pressure melt area and associated load drop energy for tests with the indentor wheel stationary

Failure energy versus melt area. Each point corresponds to the energy dissipated during a specific load drop, as determined from the stiffness of the apparatus, and an associated melt area, as determined from the video record. The data come from, several indentation experiments.

and the associated energy, assuming a contact pressure of 90 MPa for a typical load drop, will be calculated. The energy will be compared with the actual mechanical work done by the apparatus and shown to be adequate to cause a portion of the ejected material to be in liquid form.
The load record for a typical indentation test is shown in Figure 2. In general, it was observed thatthe higher the drop in load at each failure, the larger the size of the pressure melt spot which appeared on the video record. To estimate what fraction of the energy of the indentation process goes into pressure melting and extrusion, several measurements were taken of the transparent undamaged areas which appear in the video records after the load drops (Table 2). These data come from several experiments where the indentor wheel was not rotating. It was found that the energy associated with the load drop correlated with the size of the subsequent undamaged contact area (Fig. 6) according to the following equation, obtained by a least-squares fit

where Ais area in m2 and Εis energy in joules given by
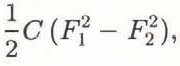
where C, F 1 and F 2 are the apparatus compliance, and load before and after the load drop, respectively. The scatter in the data was due in large part to the inaccuracies involved in the process of tracing out and digitizing the areas from the video records. The correlation coefficient, r, was 0.89. Due to the manner in which the ice failed, i.e. higherloads generally resulted in larger drops in load at failure, the displacement of the ice holder at each failure correlated with the associated energy (Fig. 7) according to the equation
Failure energy versus ice holder movement, as determined from load records and the known stiffness of the apparatus. Each point corresponds to the displacement of the ice holder at a particular load drop and the associated work done, by the apparatus.


where Εis energy in joules and Dis displacement in meters. The correlation coefficient, r, was 0.97. Equations (1) and (3) were combined to obtain an expression for the undamaged contact area Aas a function of the displacement Dof the ice holder. Integration over a displacement typical of the maximum values in Table 2 yielded an estimate for the volume of ice removed by the pressure melting and extrusion process for that failure event

Assuming a contact pressure of 90 MPa during the pressure melting and extrusion process, one obtains an associated amount of mechanical work:

This can be compared with the actual work dissipated by the apparatus, 2.51 J, as determined from Equation (3). Clearly, at least 50% of the total mechanical work performed can be attributed to this process. The rest of the work was probably dissipated as heat in the apparatus caused by vibration, and in the viscous extrusion (discussed by Jordaan and Timco, Reference Jordaan and Timco.1988) of the conglomerate ice surrounding the pressure melt zone. Pressure melting and heating by liquid extrusion at interparticle contacts within the crushed layer may be one of the underlying mechanisms governing the process described by Jordaan and Timco (Reference Jordaan and Timco.1988). Wetting of the particles in the crushed layer by liquid produced at the indentor/ice interface may also play a role. The 90 MPa contact pressure was conservative, since it corresponded to near static conditions in the apparatus; higher contact pressures were certainly present whenwater was being rapidly extruded during the rapid movements of the ice holder during the load drops. A conservative estimate, then, for the work performed in removing ice through the mechanism of pressure melting and extrusion is 90 MJ m−3. This implies that a fraction of the extruded material will be in liquid form since the latent heat of fusion of ice is 334 MJ m−3. This is consistent with the observation from the small-scale impact experiments and crushing friction experiments that extruded material bonds to the glass plate and the friction surface. Raising the temperature of the extruded material from -9° to 0°C requires 19 MJ m−3, which leaves 71 MJ m−3 of available energy for melting. Hence ~ 20% of the extruded material was liquid, since its kinetic energy, based on the velocity estimate above, was negligible.
An accurate measurement of the thickness of the liquid layer was beyond the scope of this paper. However, a rough estimate for the layer thickness was obtained by taking the volume calculated in Equation (4) (0.18 × 10⁻⁷ m3) and noting (from the load record) that ejection ofthis material occurred in ~ 0.01 s, which yielded an average flow rate of 0.18 × 10⁻⁵ m3 s−1. Some of the videotaped tests, where the shutter speed was 1/500 s, had frames which captured the behavior of the ice during the short time interval when the extrusion process was taking place. The material which was ejected from the high pressure zone was blurred on the video frame because of its high velocity. The blur streak was typically 1 cm in length which implied a velocity of 5 m s−1. Assuming a circular contact spot shape, the mid-area from Figure 6 (4 × 10⁻⁵ m2) was used to obtain the circumference of the spot. This perimeter multiplied by the thickness of the layer yields the instantaneous area through which the extruded material must flow at the prescribed rate and velocity above. From this calculation, a liquid layer thickness of ~ 16 μm was obtained. It is interesting that various studies of ice friction indicate a liquid layer thickness ~ 1 μm (e.g. Furushima, Reference Furushima1972).
In summary, the following scenario emerges from the above observations and calculations. As ice breaks away from the contact zone, the contact pressure jumps to a high value, and pressure melting and fluid flow begin. The thin layer of water (Fig. 8) flows rapidly because of the extreme pressure, and, in doing so, it generates heat due to viscosity. Some of this heat is conducted directly into the surface of the ice below providing energy for further melting. As the flow leaves the high pressure region and the freezing point is elevated, the bulk of the flow refreezes by dumping heat into the ice below and the indentor, while a portion of the flow stays in liquid form.
Implications
The implications of these results are far-reaching. Until now, no evidence has been presented to indicate that pressure melting and heat generation by viscous flow of the melt plays a role in ice indentation or impacts. It has, therefore, not been included as a candidate for energy consumption in situations involving ice impacts and indentation, such as in the operation of icebreakers. It is interesting to note that phase changes, including melting, have been discussed in the context of high velocityimpacts on icy bodies throughout the solar system (e.g. Ahrens and O’ Keefe, Reference Ahrens, D. and Keefe1984; Gaffney, Reference Gaffney, Klinger, Benest, Dollfus and Smoluchowski1985; McKinnon, Reference McKinnon1989).
The present results support the conclusion that in sliding friction on ice under relatively small loads, the contact pressure on asperities can be high enough to induce pressure melting. Depending on the test configuration, the presence or absence of lubricating pressure melt, along with melt due solely to friction, may help to explain the inconsistencies that often arise in ice friction studies. A theory which includes both methods of water film production may be required before a complete understanding of sled runner and skate blade dynamics is realized.
Schematic diagram of the pressure melting and extrusion process.

Model tests of marine vessels in ice towing tanks are also affected by the phenomenon, since pieces of broken ice and edges of the intact sheet can present points and sharp ridges to the surface of the model. The net forces may be modest, but the contact pressures may be adequate for pressure melting.
Summary
A considerable amount of visual and numerical information has been analyzed from the present series of indentation and small-scale impact tests. The proposal that pressure melting and extrusion of melt plays a major role in the tests described here is supported by the following evidence. Measured pressures at the start of indentation tests were high enough for pressure melting and the contact spots had a liquid-like appearance. The friction coefficient was also very low at the beginning of indentation experiments (observed in crushing friction tests), indicating lubrication. The central region of the contact areas, throughout the duration of indentation tests, was transparent and the ice beneath was undamaged. The transparent spots generated in the small-scale impacts and indentation tests were surrounded by extruded material consisting of very tiny particles mixed with some liquid water, as would be expected in the extrusion process illustrated in Figure 8. A very thin platelet of refrozen ice,radiating out from the edge of the contact zone, was observed after some small-scale impact tests. Estimates for the volumetric rate at which ice was removed from the transparent contact zones in the indentation tests and the velocity of the ejected material indicate that the process of removal occurred in a very thin layer, ~ 16 μm in thickness.
Clearly there is a great need to confirm further the existence of this phenomenon through higher resolution visual methods and also by looking at the microstructure of the liquid layer. Thermal measurements at the ice/indentor interface during indentation and impact tests would also shed light on the processes involved and possibly confirm the presence of liquid. It is hoped that the conclusions presented here will encourage others to investigate this area. In some cases this may not require new experiments, but rather a fresh look at previous work, keeping in mind a possible new interpretation.
Acknowledgements
The authors are grateful to several N.R.C. scientists, Dr Ed Lozowski of the University of Alberta and Dr Richard McKenna of Memorial University for perusing the first draft of this paper and making helpful suggestions.



