


Introduction
As Bruce Kaye noted in his editorial for the first issue of this journal in 2003, ‘Anglicanism stands out ... in that, in the main, it was spread around the globe on the back of a colonizing power in the form of an established church of that power. In a postcolonial environment that very fact creates special and distinctive issues for Anglicans.’Footnote 3 This is especially true for New Zealand. As the farthest outpost of the British Empire, let alone ‘God’s farthest outpost’,Footnote 4 New Zealand’s beginnings were steeped in all things English, including Anglicanism. But even then there was some diversity. There were also small but still significant contributions from the Irish, who tended to be Catholics and Scots, who were predominantly Presbyterians. Scottish Presbyterians played a central role in building Otago and Southland and, to the present day, the statue of Scottish poet Robbie Burns in the central square (octagon, to be precise) of Otago’s largest city Dunedin is one illustration of this abiding link. Otago University (New Zealand’s oldest) was also founded by Presbyterian men, and Dunedin remains the home of the Presbyterian theological college. Secularism was also a feature of New Zealand’s early migrants. Despite the predominance of the Anglican Church, New Zealand’s first British migrants fiercely resisted an ‘establishment’ church; a feature of their home country that they were glad to leave behind. That said, a church that played a stable, meaningful role in society, which provided intellectual leadership, and was not overly disturbed by secularism, was positive, even vital, for its time. The Anglican Church sat alongside community-minded organizations, such as Boy Scouts, Post Offices, the Temperance Union, as a significant player in building and maintaining social cohesion in nineteenth and early twentieth-century New Zealand. And, like the Anglican Church, all of these organizations subsequently recorded a decline in adherents and a concomitant loss of influence.
The story of New Zealand’s population was until the mid-1970s at least a story of the British and the Irish.Footnote 5 In 1901, 93 per cent of New Zealand’s population was born in New Zealand, Ireland, Scotland or England.Footnote 6 This carried through until well into the twentieth century: from its colonial period through to the 1970s New Zealand’s immigration story was of the arrival of immigrants from the UK and Ireland.Footnote 7 As Paul Spoonley and Richard Bedford note, ‘[t]he [early] immigrants who arrived in New Zealand were homogeneous in origin, ethnicity and religion, as well as occupational’.Footnote 8 This continued for the next century-and-a-half. For most of its history (if we take as a starting point the signing of the Treaty of Waitangi between Māori and the Crown in 1840), New Zealand was overwhelmingly white, British, English-speaking, Christian, and Anglican. To hold these attributes and affiliations, especially the latter, was also to hold a privileged place in New Zealand society of the time, and for the century that followed. The Anglican ruling elite who, not just being Anglican but were also British, were from farming, the professions, in government and universities; well connected; and destined for a path of upward social mobility. They were, as we note below, present at many of the pivotal points of New Zealand’s history. To be an Anglican in the New Zealand of 1850 or even 1950 was to be someone of social importance, even dominance. This situation, as we shall see, was to radically and fundamentally change in the latter part of the twentieth century. In this way the experiences of the Anglican Church in New Zealand may be instructive to Anglican churches elsewhere in the world.
The arrival of the Anglican Church – and of Christianity itself – in New Zealand is traditionally marked with the arrival of the missionary Samuel Marsden and the sermon he preached (and tradition holds as the first sermon ever preached in New Zealand) on Christmas Day, 1814. Anglicanism, however, arrived not just in the company or solely by the efforts of Marsden but may also be seen as part of a package brought across by all English settlers to this ‘Better Britain’ of New Zealand. A former British colony, New Zealand is approximately 990 miles from its nearest neighbour Australia, 12,000 miles from Britain, and has a population of only 4.3 million people. It was as close to the end of the world as the British Empire, perhaps even Western civilization itself, could get. This vast distance from the colony to its colonizer possibly reinforced rather than diminished the ties between the two. Jamie Belich has asserted that this ‘Better British ideology ... maintained that New Zealanders were even more loyal and more closely linked to Old Britain than other neo-Britains.... The collective identity asserted New Zealandness and Britishness, with an assumption of compatibility so strong that it required no stating.’Footnote 9 Indeed, so much better than Britain would it be that New Zealand came to be known as ‘God’s Own Country’: ‘an exemplary paradise’.Footnote 10
Even so, the Anglican Church, while well established in England was contested in New Zealand and variously: in response to the challenge posed by the Roman Catholic French Bishop Pompallier and the potential consequence that this British outpost could pledge allegiance to Rome rather than to the Queen; through the statement of religious toleration which recognized and protected ‘the several faiths of England, of the Wesleyans, of Rome, and also the Māori custom’; and in the wider emerging reality in Europe that the monopoly of one faith or denomination was being challenged.Footnote 11 In the context in which it arrived in New Zealand, the Anglican Church, its missionaries and priests, were facing a receding tide.
But despite a challenging context, the Anglican Church in New Zealand did much to bridge the bicultural divide between New Zealand’s indigenous people, Māori and British settlers. In large part this reflected the close relationship that key Anglican clergy and missionaries had to the representatives of the British Crown and the political and social establishment; a privileged position that was not shared in any sense by other denominations at the time. Anglican missionary Henry Williams played a pivotal role in drafting and translating the Treaty of Waitangi between Māori and the Crown in 1840. For this act Williams (and several generations of his offspring) materially benefited. But his translation was not without its significant flaws, which have caused problems to the present day, and it may be argued that it has aggravated rather than ameliorated subsequent bicultural relations.
Williams’ contemporary, Bishop Selwyn, desired that the missionary-Māori church should be blended, though this never really transpired. The Pākeha (that is, broadly, European) church dominated more often than not, despite later efforts to adapt. Positive efforts did, however, continue into the next century. In 1992, in response to social as much as political pressures of the time, a revised Church constitution sought to enable each tikanga (stream) of Māori and Pākeha to take responsibility for its own mission; it also gave the same authority to Polynesia, reflecting both New Zealand’s increasing population of Polynesians and its geographical place in the South Pacific.Footnote 12 Over time, the Anglican Church has recognized Māori in its governance and in its own institutional culture in ways that many other parts of New Zealand, and many other denominations, were slow to achieve. In so achieving, it credits the Anglican Church for taking deliberate, albeit difficult, steps toward cross-cultural engagement. We shall return to this point in our conclusion. However, as is discussed in detail below, the Anglican Church has been much less successful in addressing let alone welcoming migrants to New Zealand from Asia and then positively responding to the consequent ethnic diversification of New Zealand’s population.
The ethnic diversification of a population is not, in most respects, unique to New Zealand. What we witness in New Zealand, in particular in its largest city of Auckland, is a super-diversity true of other multicultural global cities. Characteristics of this super-diversity, and points where New Zealand diverges from others, are noted below. The rapid ethnic and cultural diversification of cities presents genuine challenges for Christian churches of any denomination and on a wide range of issues, from pastoral care of foreign communities, to playing a constructive role in inter-faith dialogues, to accommodating the different beliefs and acts of a diverse population. This is arguably no more challenging than for the Anglican Church, in England as elsewhere in the Communion, given its ties to the establishment, its prominence in society, and its strong association with England and things English. In some cases, churches of all denominations have responded to this changing social climate by successfully delivering social services, contributing to public policy debates, and actively welcoming migrants of all faiths and none. How the Anglican Church in New Zealand in particular has – and hasn’t – responded to this super-diversity will provide a case study, if not also something of a cautionary tale, for Anglican churches facing similar challenges in other multicultural contexts.
But New Zealand’s context is not wholly replicable. New Zealand differs in key respects to other classic countries of immigration (which, for our purposes, include Australia, Canada and the United States). New Zealand has a significant indigenous population at almost 15 per cent of the population.Footnote 13 In comparison in 2011 in Canada, the indigenous population was only 4 per cent of its total populationFootnote 14 and in Australia only 3 per cent.Footnote 15 New Zealand has also had migration flows from a very narrow range of source countries, which was disrupted first in the 1960s by labour migration from Polynesian Pacific and then in 1990s onwards from Asia.Footnote 16 Indeed, at the peak of immigration in 2002–2003, Asian immigrants constituted 40 per cent of all immigrants to New Zealand. The changes to these immigration flows and the resulting cultural diversity of New Zealand have affected the ways New Zealand communities have regarded these new New Zealanders and the nature of their interactions with them.Footnote 17 It is this migration from Asia, and its impacts, which concern us here.
Empirically, this paper draws on New Zealand’s Census data and from there extrapolates future trends. Before we consider Census data in detail, some clarification on terminology is required. Census data are important but are never comprehensive. Not everyone fills out the Census form truthfully or answers every question, especially when it comes to religion. These data also obscure a range of experiences, nuances and encounters of the day-to-day life of religious believers and of those with no religion. That is not to dismiss these data: they tell us what they tell us. But we should be careful about putting undue weight on them. Similarly we need to take care with our understanding of ‘migrants’ and the general categories of ‘Asian’ and ‘Pacific’. These categories, while in common usage, nevertheless obscure the remarkable variation within these broad groups and unhelpfully lend themselves to generalization and assumption-making. ‘Asia’ as defined, measured and reported by Statistics New Zealand (and therefore in the Census) ‘includes a vast sweep of countries – from Uzbekistan and India, to Japan and Laos’.Footnote 18 As Tahu Kukutai rightly notes, the broad term ‘Asian’ also hides the different identities, cultural legacies and migration histories of, say, Chinese and South Koreans, even though the average New Zealander will ascribe a generic Asian label and proceed on that basis.Footnote 19 Within these various broad groups are a multitude of languages, practices, beliefs, dress, diet and experience. Richard Bedford regards ‘Asia’ ‘as a complete nonsense term’ because, as we have noted, ‘it spans 60 per cent of the world’s population and most would never call themselves Asian’.Footnote 20 This speaks to the problem of what David Pearson calls ‘ethnification’; that is ‘the process by which diverse ethno-cultural groups come to be attributed with a common ethnic core’.Footnote 21 This illustrates that ethnicity is not easily measured; it is a fluid category (by nature of it being self-ascribed, albeit to set names and terms, it can change over time) and it is multi-dimensional, in that it is not only expressed, it is also perceived and observed.Footnote 22 Most New Zealanders, surveys reveal, identify an ‘Asian’ as being ‘East Asian’ and usually someone from China;Footnote 23 this is informed somewhat by reality, given the high number of Chinese among Asians in New Zealand.Footnote 24 This differs from other parts of the world where an ‘Asian’ might be identified as someone from ‘South Asia’.
This article examines the impact of migration flows (as part of demographic shifts generally) on the Anglican Church. In that way it examines mega-trends, informed by data. But migration is, ultimately, a human story.Footnote 25 It is the story of a person, or group of people, departing from one place and arriving in another, bringing with them their experiences and expectations, their beliefs and behaviours, their ways of doing things. It is also the story of their diversity. Behind the numbers, trend lines and tables are priests and parishioners, chaplains and other clergy, Bishops and vestries who are going about living out their Christian faith as best they know how, often in difficult circumstances and on hard terrain, but with a conviction that motivates them to faithfully live forth their faith. Coming to terms with a diversifying community is only one of a multitude of tasks and worries that a parish priest contends with regularly and takes its place (if it takes a place at all) alongside, for example, a priest’s sacramental administration, her pastoral visiting, the blessing of children and the taking of funerals, balancing church budgets and attending Synod. This is not to diminish the ambition of many who labour in such a way toward greater sociological understanding and clearer theological expression but rather it is to acknowledge that these trends will be responded to and interpreted by those whose lives are a cycle of response and interpretation, to the Spirit, to the world, to the church at large. In this way the experience of a priest in New Zealand will be sympathetic to the situation of a priest elsewhere, especially elsewhere in the Western world: the specific issues may be different but the broad trends are the same. Does this mean that a diversifying population (and, perhaps, therefore, a diversifying congregation) is an extra problem for the clergy and the Anglican Church writ large? Not necessarily. But for a church so steeped in its English heritage, so connected with the establishment, so used to operating within liturgical boundaries and barriers, the ability for it to adjust to ethnic diversity will not be something it comes to naturally, or is necessarily equipped to do. It may be that for some migrants the Anglican Church is simply not known, nor attractive; that will be true in some cases, but not all. Given the precipitous decline in its number of congregants, however, the burden may fall heavier on the Anglican Church itself to actively respond to this super-diversity.
We shall return to the implications of a diversifying population for the Anglican Church in the last part of the article. In the meantime, however, we consider first and in detail New Zealand’s diverse population, by ethnicity, age, country of birth and languages spoken. We then consider New Zealand’s changing religious profile, noting with evidence the declining number of people who declare themselves to be Christians. Third, our attention turns specifically to the Anglican Church, in particular how it compares to the Catholic Church, in terms of population trends, birthplace, ethnic composition, and age distribution.
The Diversification of New Zealand’s Population
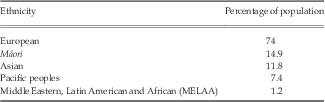
New Zealand’s Census of Population and Dwellings in 2013 revealed the ethnic diversity of New Zealand, as illustrated in Table 1.Footnote 26
New Zealand’s population by ethnicity, 2013

While Table 1 reveals ethnic diversity at a point in time, it hides how rapidly this diversity occurred. Demographically, as Bedford and Ho illustrate, between 1986 and 2006, New Zealand’s resident population that had been born in countries in Asia increased almost sevenfold from 32,685 to 248,364. In 2006 the population that identified with Asian ethnicities (including the New Zealand-born) increased by 550 per cent in the same period. The Chinese and Indian components of the Asia-born population increased even more – over 800 per cent during that 20-year period. In 2006 nearly 20 per cent of the Chinese and Indian populations in New Zealand were local-born, reflecting their long-standing presence in New Zealand, in some cases going back to the nineteenth century.Footnote 27 The 2013 Census reveals a significant increase (of 138.2 per cent) among ethnic Filipinos in New Zealand since 2006, with smaller increases for most other Asian ethnic groups (ranging from 16.2 per cent for Chinese to 48.4 per cent for Indians) except for Koreans, which declined by 2 per cent over that same period. This echoes increases for all Asian ethnic groups in the period between 2001 and 2006, with the largest increases in that period for Indians (68.2 per cent) and Koreans (61.8 per cent).Footnote 28
Within a generation, New Zealand’s population changed socially, demographically, religiously and economically. New Zealand has, over time, become less religious. In 1961, Christians made up 90 per cent of the population but by 2013 were only 48 per cent. Within those figures the biggest shifts are for those who affiliate with no religion, between 2006 and 2013 this had increased from 30 per cent to 39 per cent, and those with religions other than Christianity, which increased from 4.5 per cent to 6 per cent over the same inter-censal period.Footnote 29 To foreshadow what follows, while Christianity in general is on the decline, all Christian denominations have nonetheless recorded an increase of those of Asian ethnicity. At the 2013 Census both Catholics and Baptists recorded over 10 per cent of their populations as being of Asian ethnicity, with a smaller yet still significant increase for Presbyterians. If current trends continue, by the next Census Asians who identify as ‘Pentecostals’ (9.7 per cent in 2013) and ‘Christian not further defined’ (8.7 per cent in 2013) could meet or exceed 10 per cent of those categories. The outlier for these figures is Anglicans. In 2013 Anglicans only had 1.7 per cent of their population of Asian ethnicity, which was only a marginal increase from 1.3 per cent in 2006.
This is a significant change from what was standard for most of New Zealand’s history post-European settlement. In 1901, 93 per cent of New Zealand’s population was born in New Zealand, Ireland, Scotland or England.Footnote 30 From its colonial period through to the 1970s New Zealand’s immigration story was overwhelmingly of the arrival of immigrants from the UK and Ireland.Footnote 31 As Spoonley notes:
The colonial project of settling Aotearoa and constructing New Zealand echoed the ‘framing assumptions of the British state’ that privileged ‘whiteness’ and equated ‘Christian’ with ‘civilised’. Compared to the mix of arrivals in the other classic immigrant-receiving societies of the period, such as the US, Canada and Australia, the Eurocentric approach to the ‘civilising’ of New Zealand was the almost exclusive focus of British (and to a lesser extent Irish) settlement, and the creation of a ‘Britain in the south seas’. As Pool points out, this resulted in extremely high levels of homogeneity in terms of the origin, ethnicity, religion and occupation of those arriving. This was further reinforced by marriage patterns, the maintenance of customs, standardised education, internal mobility and shared pro-British jingoism. In the European colonisation projects of the eighteenth and nineteenth centuries, such hyper-homogeneity of immigrant flows (98 per cent were from the UK and Ireland for much of this history) was unusual, as were some of the resulting consequences for the construction of community (including nationality), institutions and values.Footnote 32
For older New Zealanders, more familiar with a largely ethnically homogeneous New Zealand the rapid ethnic diversification of its population with first large-scale Pacific and then Asian migrant flows provoked anxiety and fear. In reaction to migration from the Pacific, especially Samoa, to New Zealand were social attitudes that these migrants threatened the jobs of New Zealanders, were responsible for urban decline and criminal behaviour, and were over-staying their visas and so should be forcibly expelled.Footnote 33 Similar attitudes, which were augmented with attacks on Asians’ ‘ostentatious houses’ and driving,Footnote 34 were also expressed about Asian migrants two decades later. These attitudes, whether expressed by politicians, an independent Pentecostal preacher with a fabulous life-style among the poor,Footnote 35 or a (recently deceased) right-wing Christian journalist,Footnote 36 were given significant airing in the media. These sharp voices and strongly held views had their supporters. But public attitude surveys reveal a more nuanced picture.Footnote 37 In a survey in 2014 by the Asia New Zealand Foundation, a think-tank, 49 per cent of New Zealanders agreed that Asians mixed well with New Zealanders (the highest recorded figure to that time).Footnote 38 A summary of Asia New Zealand Foundation’s surveys from 1997 to 2011 by Gendall, Spoonley and Butcher noted that, in this period, there was ‘clearly … increasingly positive attitudes to Asian immigration’;Footnote 39 that, in 2011, there was almost unanimous agreement (90 per cent) that it was important to develop economic and cultural ties with the people and countries of Asia, and that New Zealanders’ warmth towards people from Asia was comparatively better than similar surveys in Australia or Canada, which were typically 10–15 percentage points lower.Footnote 40
New Zealand, in these attitudes, almost stands alone. But while these attitudes are generally positive, they are not wholly so, as the public comments noted above reveal. These negative attitudes echoed similar comments by former Archbishops of Canterbury.Footnote 41 As in the New Zealand case, if not more so, these comments received coverage because of the privileged and high-profile position of those making them. In so doing, they gave legitimacy to members of the public who may also share their negative views. Such attitudes reflected racist and discriminatory attitudes, and used migrants as scapegoats for wider social and economic changes. But, in New Zealand’s context, they also reflected some level of discomfort about the rapidity of demographic change and the implications of those changes. All social institutions, including the church at large, had to address this change, through ignoring it or confronting it or adapting to it.
Super-diversity
The pace and scale of change places New Zealand in a category of what are known as ‘super-diverse’ societies. Super-diversity is a term intended to underline the level and kind of complexity surpassing anything a country has ever experienced, especially in relation to: the multiplicity of immigrants’ countries of origin, the growth of multilingualism, religious diversity, and varied channels of migration (e.g. students, workers, spouses and family members, asylum-seekers and refugees, illegal immigrants and new citizens).Footnote 42 Super-diversity also refers to a city or area in which a large percentage of residents (typically over 25 per cent) are foreign-born, as is the case for London, Toronto, California and Auckland, New Zealand.Footnote 43 Large-scale Asian immigration to New Zealand may be explained by immigration-policy changes from favouring source countries (that is, Western) to favouring skills in 1987, and the relative attractiveness of, and ability to find work in, New Zealand during the Asian financial crisis in the late 1990s and again during the global financial crisis of 2008.Footnote 44
Let’s consider this super-diversity in further detail and as it is reflected in age, birthplace, languages and geography. These demographic measures reveal not just diversity but also foreshadow a New Zealand that will: be both older and white and yet also younger and ethnically diverse; have an increasing number of people who can speak more than one language; and have clear urban/rural dividing lines where the former is very diverse and the latter is less so. This measure also captures a potential weakness of the Anglican Church in New Zealand, where one of its strengths (historically) was its significant presence in rural New Zealand rather than in urban cities. The following tables illustrate these demographic measures.
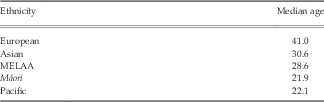
New Zealand’s population, by age, 2013 Census

Source: Data derived from the New Zealand Census of Population and Dwellings, 2013, available at: www.stats.govt.nz (accessed 14 October 2016).
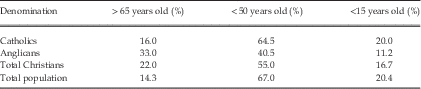
As seen in Table 2, the median age of New Zealand’s population differs significantly from that of the Anglican church in New Zealand, which is both older (33 per cent of Anglicans are over the age of 65,Footnote 45 compared to 14.3 per cent of the national population)Footnote 46 and whiter (88.8 per cent of Anglicans are European compared to 74 per cent nationally).Footnote 47
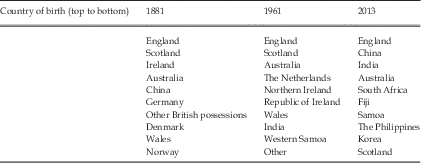
The birthplaces of New Zealanders have changed dramatically since its first settlers arrived. As can be seen in Table 3, England still dominates but Western countries of birth have been largely replaced by countries in the Asia Pacific. Considering this, the Royal Society of New Zealand, in a major report on New Zealand’s multiple demographic futures, notes that:
Multiple ethnicities can also mean multiple birthplaces – and this is the case in New Zealand in 2013. The number who were born overseas now equate to one in every four New Zealand residents (compared with one in five in 2001 and one in seven in 1961). This reflects a scale of immigration over the last 25 years that has not been seen for a century.Footnote 48
Countries of birth of New Zealanders, 1881, 1961 and 2013

Source: Data derived from: McCarthy, ‘Migration and Ethnic Identities’, p. 178; Paul Bellamy, ‘Immigration Chronology: Selected Events 1840–2008’, Parliamentary Library Research Paper, 2008/01, http://www.parliament.nz/resource/en-nz/00PLSocRP08011/754befd1150a25f0c4057d9c32e53a92b5a3071a (accessed 9 December 2014); Statistics New Zealand, ‘QuickStats about Culture and Identity’.
New Zealand is also becoming increasingly multi-lingual. The 2013 Census recorded that 18.6 per cent of New Zealanders could speak more than one language (up from 15.8 per cent in 2001) and of those 60.4 per cent were born overseas.Footnote 49 Given that 79.5 per cent of Anglicans were New Zealand-born in 2013 we may assume that far fewer Anglicans relative to the national population are multi-lingual although, given the predominance of both Māori and English in the New Zealand Prayer Book, we may assume that many are at least nominally bi-lingual.
The Decline of Christianity
The Anglican Church in New Zealand, like all Christian denominations, is nevertheless facing a social context in which Christianity as a faith is on the decline. Kevin Ward explains:
In 1961 Christians made up almost 90 per cent of the population. By 2006 it was down to 56 per cent and by 2013 48 per cent. The biggest increase was in those stating no religion which rose from just over 30 per cent to 39 per cent of the population, a 26 per cent increase. If these trends continue it is clear that by the next census those saying they have no religion will be the largest group of New Zealanders and perhaps within a decade be over half the population. Those identifying with religions other than Christianity also increased from about 4.5 per cent of the population to 6 per cent. These three trends have been happening since the 1960s.Footnote 50
The Royal Society’s researchers expand on this theme:
One sphere in which the new ethnic diversity has brought other forms of diversity in its wake is religion. Over the last 30 years the number of New Zealanders declaring religious affiliation in the census has fallen dramatically.... The current situation is consistent with European countries, Australia and Canada (although not the United States). On the other hand there is a high proportion of practising Christians amongst the migrant population, which has contributed to the Catholic Church becoming the largest single denomination (11 per cent). Muslim migrants are smaller in number, but retain a high incidence of religious adherence. Māori may have relatively low levels of religious adherence, but 66 per cent [of Māori] in 2013 thought spirituality was important.Footnote 51
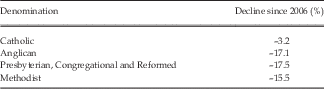
The major decline in Christian affiliation is happening among those who are New Zealand-born, most of whom now identify as ‘no religion’. Most Christian denominations have recorded overall declines, though some (including Anglicans) more dramatically as others, as Table 4 illustrates. The only increase has been for those who are Christian (no denomination specified), which went up 6.1 per cent since 2006.
Decline in selected Christian denominations between 2006 and 2013

Source: Data derived from the New Zealand Census of Population and Dwellings, 2013, www.stats.govt.nz (accessed 14 October 2016).
The Anglican Church Considered
One way we can illustrate the relative and absolute decline of the Anglican Church in New Zealand is to compare it to the Roman Catholic Church. The two denominations have always been among the largest Christian denominations in New Zealand and both are liturgical, experiencing a decline in adherents, part of large multinational faith organizations whose outside central authority sits in Lambeth and Rome respectively, and facing significant headwinds of change in the centre of gravity for Christian faith away from Europe and toward the Asia Pacific. The following tables illustrate these points.
Table 5 shows that while New Zealand’s population has increased, the number of Christians and the number of Anglicans has declined, while the number of Catholics has nominally increased.
Total populations of Catholics, Anglicans, Christians and New Zealand, 2001–2013

Source: Data derived from the New Zealand Census of Population and Dwellings, 2013, www.stats.govt.nz (accessed 14 October 2016).
Table 6 shows the relative strength by way of the proportion of Anglicans and Catholics compared to New Zealand’s total population.
Catholics, Anglicans and Christians in New Zealand as a proportion of New Zealand’s population, 2001–2013

Source: Data derived from the New Zealand Census of Population and Dwellings, 2013, www.stats.govt.nz (accessed 14 October 2016).
As Table 5 illustrates, in the period between 2001 and 2013 there were over 100,000 fewer Anglicans in 2013 than in 2001 whereas over the same period there were (only) just over 6,000 fewer Catholics. The decline in overall Christians was greater than both of these combined, with over 180,000 fewer Christians in 2013 than in 2001. That said, however, 68 per cent of the decline of total Christians in New Zealand can be attributed to the decline in Anglicans.
There will be various reasons for this decline, but for the purposes of this comparison it is instructive to look at those that are born in New Zealand and those born in England and in the Philippines for both Anglicans and Catholics. England is chosen because, as noted earlier, of the close and deep association between England, English-born and the Anglican Church in New Zealand. The Philippines is chosen because they are responsible for significant growth in the Catholic Church. Table 7 illustrates this.
Selected birthplaces of Catholics and Anglicans in New Zealand, in 2013

Source: Data derived from the New Zealand Census of Population and Dwellings 2013, www.stats.govt.nz (accessed 14 October 2016).
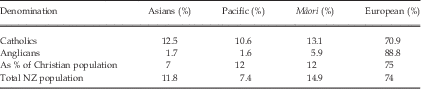
By comparison, 5 per cent of New Zealand’s total population in 2013 was born in England. Seventy per cent were New Zealand-born. Another way to illustrate this is to consider the ethnic composition of Anglicans and Catholics in New Zealand, as seen in Table 8. Note, however, that ethnicity is not synonymous with birthplace. As a self-identifying attribute, people born in New Zealand may identify with the broad categories of ‘Asian’ or ‘Pacific’ rather than ‘European’, especially if they have heritage of that particular ethnicity.
Ethnic composition of Anglicans, Catholics and New Zealand, 2013 Census

Source: Data derived from the New Zealand Census of Population and Dwellings 2013, www.stats.govt.nz (accessed 14 October 2016).
The third row illustrates that the total Christian population is reasonably representative of the New Zealand population. The extent to which Anglicans and Catholics in particular reflect the ethnic composition of New Zealand’s total population is revealing. Catholics are much closer than Anglicans to being representative of the total population whereas Anglicans are overwhelmingly dominated by those who are ethnically European. This is particularly striking for Anglicans given the priority they have given in their governance structure to the Māori and Pacific streams. Indeed, it may be fairly argued that the Anglican Church closer represents New Zealand of 1964 than 2014.
A further variable we may use to compare the populations of Catholics and Anglicans in New Zealand is age. Table 9 illustrates this.
Selected age distribution of Anglicans and Catholics compared to the New Zealand population, 2013 Census

Source: Data derived from the New Zealand Census of Population and Dwellings 2013, www.stats.govt.nz (accessed 14 October 2016).
Table 9 reveals that the population of the Anglican Church is significantly older than the national population. This presents challenges for its ongoing sustainability as well as explaining (in part, at least) its declining numbers. Again, these figures suggest that the Catholic Church better matches the New Zealand population in 2014.
Implications
What implications may we draw from this range of data? There are questions about what constitutes a New Zealander, not to mention New Zealand itself. But, more to the point, these data fundamentally challenge what it is to be the Anglican Church in New Zealand. Clearly, New Zealand is not the ‘Better Britain’ it was when its first settlers arrived; current debates (in 2015) about changing its national flag to rid it of the Union Jack are one example of the country’s changing orientation.
The downward trends in the Anglican Church in New Zealand do not bode well for its long-term sustainability, let alone its growth. Indeed, the direction of travel would suggest that the Anglican Church is on track to become a significant minority Christian denomination, rather than a majority Christian faith. This reflects a variety of factors: a shift for New Zealand away from Britain and much of what being a British colony stood for; a general and significant decline in Christian affiliation among New Zealand-born; and large migrant inflows from parts of Asia where the Anglican church has little or no historical or contemporary presence.
The Anglican Church may be found in the former British Empire: as in New Zealand, Australia and Canada, so also the Asian parts of the empire, in Malaysia, Singapore and Hong Kong. Migrant populations from these Southeast Asian countries to New Zealand has never been high, except as students in the mid-twentieth century, and migration from Hong Kong to New Zealand peaked after the handover of Hong Kong from Britain to China, and then dropped off as the situation there stabilized and those migrants returned home. India should also be considered, not least as being the largest Asian country in the former British Empire, and with Indians as one of the largest and most-established Asian populations in New Zealand. But where Indian migrants intersect with the Anglican church in New Zealand they tend to be as Anglo-Indians, who themselves took on many British attributes and traditions and were more likely to be Christian than not,Footnote 52 and even then more likely to be Catholic than Anglican.Footnote 53
Philip Jenkins has noted:
Let me suggest to you that in 30 years, there will be two sorts of church in the world. There’ll be the ones that are multi-ethnic, transnational, and multi-continental. They are constantly battling over issues of culture, lifestyle, worship, and constantly in conflict, debate and controversy. And those are the good ones. The other churches will have decided to let all these trends pass them by. They’ll live just like they’ve always done with an average age in their congregations of 80. Personally, I’d much rather be in one of the ones that is recognizing, taking account of the expansion with all the debates and controversies.Footnote 54
At first glance and on present trends the Anglican Church in New Zealand would fall into Jenkins’ second category, of small congregations full of old people. It would be seen to have failed to adjust to a post-colonial postmodern context in which New Zealand (and New Zealanders) is far less British and far less religious than it used to be. It would stand in stark contrast to other Christian denominations, notably (but not only) Catholics who have been reinvigorated by the inflow of migrants from Asia. It would have a history of playing a major role in the settlement of New Zealand to a much diminished role two centuries later.
But, to be fair, the story is not entirely negative. The experience of the Anglican Church in New Zealand reveals both highs and lows. In some respects the Anglican Church has stepped ahead of the trend. It appointed its first Archbishop and Primate of Māori ethnicity in 1980, (later Sir) Paul Reeves, who later went on to become New Zealand’s first Māori Governor General in 1985. However, we may also read Reeves’ elevation as significant for being the last instance where being a senior cleric was enough of a platform to rise to the top in this way; it may also have marked the apex of the influence of the Anglican Church in New Zealand. And, as with all such appointments, it may also have reflected political machinations of the time where the then Labour government looked to strengthen its Māori voter base. In 1988 the Church appointed its first Co-Presiding Bishop for Tikanga Māori, Whakahuihui Vercoe, who went on to become Primate in 2004.Footnote 55 In these ways the Church was following a role it had played in settler New Zealand in bridging Māori and Pākeha communities as well as demonstrating its close relationship with the political and social establishment of the time. New Zealand’s Christian history is in large part its Anglican history. As we have seen, however, this bicultural (and, from 1988, multicultural) governance arrangement is not necessarily reflected in multicultural congregations.
The three tikanga strategy has guaranteed the place of Māori within the structure of the Anglican Church in New Zealand, but it may be asked whether that has enabled or inhibited a growing together into genuine bicultural life and ministry. To what extent has the Pākeha-led church empowered the Māori- and Polynesian-led church? And, in contrast, to what extent has it divested responsibility and resources for the Māori and Pacific streams? We may speculate, and with some certainty, that the Pākeha stream is the best resourced of the three streams of the church. And, considering data presented earlier, we may also suggest that the Anglican Church has not embraced fully biculturalism, let alone multiculturalism, in its congregations. Therefore, in this way it could be seen as perpetuating mono-culturalism, and not advancing cross-cultural engagement nor actively representing a changed New Zealand from the time Anglicanism first arrived.
The Anglican Church has clearly made some effort, if not entirely successfully, to engage biculturally. But given how patchy its success is, how confident can we be in arguing that the Anglican Church’s experiment in bicultural relating could serve as a model for multi-cultural relating? Since the three tikanga solution is explicitly culture-specific, would the same approach require a multiplying of discrete cultural groups to accommodate more recent immigrants? This becomes more problematic if we assume, following comments cited in the front part of this article, that most New Zealanders do not make a distinction between one ‘Asian’ and another. Even more so, it would hardly be appropriate, though may well be fleetingly considered, to create a pan-Asian stream to match Māori and Pacific streams.
This is not to slip into essentialism on the other hand either: not all Anglican parishes are the same and some may be better at engaging biculturally and multiculturally than others. A notable exception is the long-standing Anglican Chinese Mission in Wellington, established in the early twentieth century.Footnote 56 It may be, and this is a supposition, that those Anglican parishes that are most successful in including Asians are those whose Anglican identity seems less important than their desire to engage in mission or build community in their particular current context, such as with university students for example. However, if this is the case, present evidence would suggest these parishes are a minority exception rather than the general rule and practice.
Conclusion
Anglicanism, more than any other Christian denomination in New Zealand, can trace its history in New Zealand to the beginning of European settlement in New Zealand; indeed, by some measures, to the beginning of New Zealand itself. It was an Anglican (Marsden) who preached the first sermon; Anglicans who beat the Roman Catholics to the punch in becoming a quasi-establishment church in New Zealand; an Anglican (Williams) who translated the Treaty of Waitangi into Māori; an Anglican Bishop (Reeves) who became the first Māori Governor-General. In each case, the success of these men also reflected the privileged position of the Anglican Church in New Zealand society. Given these significant historical touch-points, we may convincingly argue that Anglicans construct their identity diachronically, that is looking back at what they were and have become over time. It follows, then, that not only do most Anglicans know the story of these early missionaries; they also stand in continuity with them. Māori Anglicans may do likewise: they may be able to trace their whakapapa (heritage/ancestors) to the first encounters between missionary and Māori. In that way, and for both Pākeha and Māori, their part in the story of New Zealand is often (though not always) celebrated. Where that continuity breaks down, however, is in its inflexibility or perhaps inability to adapt to a diversifying population, including Asians, which is the focus of this article. In short, a top-down model of partnership in which the church aspires that ‘the three partners order their affairs in their own cultural context’Footnote 57 has had, at best, mixed success. Nor, as this study has demonstrated, has the Anglican Church (yet) successfully addressed the further diversification in New Zealand’s population toward Asia and Asian peoples. That is the task before it now.