





In contemporary liberal democracies, the keystone of political representation lies in the recurrent holding of free and fair elections for selecting representatives (Dahl Reference Dahl1998). While some citizens and political elites emerge triumphant, others contend with defeat, but the acceptance of both sides is required (Przeworski, Alvarez, Cheibub et al. Reference Przeworski, Alvarez, Cheibub and Limongi2003). Concerns about winners’ and losers’ reactions to electoral outcomes have motivated a vast literature on citizens’ attitudes towards democracy, which has documented a systematic winner–loser gap in democratic evaluations and preferences across indicators, political systems, and over time (for a review, see Daoust and Nadeau Reference Daoust and Nadeau2023). In contrast to voters, however, we know fairly little about whether a similar gap characterises politicians. While political unrest against electoral outcomes in Brazil (2022) and the US (2021) has increased the attention towards political leaders’ reaction to electoral losses (eg, Clayton and Willer Reference Clayton and Willer2023; Clayton, Davis, Nyhan et al. Reference Clayton, Davis, Nyhan, Porter, Ryan and Wood2021), whether rank-and-file politicians systematically differ in their democratic attitudes as winners or losers remains understudied.
Evidence that election outcomes relate to politicians’ cognitions dates back to Kingdon (Reference Kingdon1967, Reference Kingdon1968), who showed that winning and losing candidates develop systematically different beliefs about voters. More recently, single-country studies have shown that the winner–loser gap extends to politicians’ perceptions of electoral fairness and electoral trust (Kuipers Reference Kuipers2025; Schnaudt Reference Schnaudt2023; Senninger, Baekgaard and Seeberg Reference Senninger, Baekgaard and Seeberg2026). Yet, these studies focus on individual countries, leaving open whether the pattern generalises comparatively. In addition, they examine outcomes at a single level without distinguishing between individual (candidate) and collective (party) results, which may shape politicians’ attitudes differently. Finally, they focus narrowly on attitudes towards the electoral process rather than broader democratic attitudes.Footnote 1 Addressing these gaps, this paper examines whether the winner–loser gap among politicians holds systematically across cases and at different levels of electoral outcomes and extends to democratic attitudes beyond electoral fairness.
To do so, we build on the extensive literature on the winner–loser gap in democratic attitudes among voters and systematise these insights for political candidates. Three complementary perspectives have been proposed to explain the winner–loser gap: cognitive (dissonance and blame avoidance), affective (emotional reactions to victory and defeat), and utilitarian (policy implementation and personal career implications) (Anderson, Blais, Bowler et al. Reference Anderson, Blais, Bowler, Donovan and Listhaug2005; Kingdon Reference Kingdon1967; Schnaudt Reference Schnaudt2023; Senninger, Baekgaard and Seeberg Reference Senninger, Baekgaard and Seeberg2026). Building on the utilitarian dimension, we distinguish between the implications of winning and losing at the individual level and at the collective level. At the individual level, winning a parliamentary seat primarily provides career utility through direct access to office and limited policy utility through parliamentary policy-making. At the collective level, whether the candidate’s party enters government largely determines policy utility and access to additional office resources. We theorise that both levels generate a winner–loser gap, but that collective outcomes are more consequential than individual ones, such that party-level victories attenuate individual-level losses while party-level defeats dominate individual-level wins.
We expect that, as with voters, election outcomes are associated with politicians’ democratic evaluations and, in addition, shape their democratic perceptions and preferences beyond evaluations of electoral fairness. Given the accumulated evidence at the voter level, satisfaction with democracy (SWD) is our primary outcome. However, we build on the well-documented limitations of this indicator (Linde and Ekman Reference Linde and Ekman2003; Singh and Mayne Reference Singh and Mayne2023) and the broader trend in the literature to move beyond it (eg, Allinger Reference Allinger2024; Anderson and LoTempio Reference Anderson and LoTempio2002; Reller, Anderson and Kousser Reference Reller, Anderson and Kousser2022) to complement it with additional measures – perceptions of citizens’ trust in democracy and preferences for direct versus representative democracy – that capture the breadth of the gap.
Using data from 27 electoral contests in 15 democracies, we find a robust winner–loser gap across indicators, with lower democratic satisfaction among losers at both levels. In addition, election losers express higher support for direct democracy over representative institutions and tend to perceive a decline in citizens’ trust in democracy. The results broadly hold across European macro-regions and for mainstream and radical parties, suggesting that the pattern is general rather than driven by specific political contexts. Furthermore, the analyses shed light on the interaction between electoral outcome levels. The winner–loser gap appears both at the collective and individual levels. However, the individual-level gap is conditioned by the party’s collective outcome: it increases within winning parties and disappears within losing ones, providing evidence consistent with our expectation that collective outcomes dominate.
We complement the comparative analysis with a regression-discontinuity design using Icelandic administrative data across three national elections, where high response rates allow us to compare the last elected candidate with the next non-elected candidate within the same party list. The results are consistent with our observational analysis, providing evidence that the winner–loser gap at the individual level can plausibly be interpreted as, at least in part, causal.
Overall, our findings show that politicians’ democratic attitudes are related to election results in a similar fashion to that of voters. On top of that, we show that the level at which winning and losing occurs matters. Thus, we contribute to the literature on the winner–loser gap in democratic attitudes in two ways. First, we systematise existing theoretical insights about the winner–loser gap among politicians by distinguishing between individual and collective outcomes and deriving expectations about their interaction. Second, we provide the first comparative evidence of the winner–loser gap among politicians, extending the nascent literature on the topic (Kuipers Reference Kuipers2025; Schnaudt Reference Schnaudt2023; Senninger, Baekgaard and Seeberg Reference Senninger, Baekgaard and Seeberg2026) beyond perceptions of electoral fairness and trust in elections to a broader set of democratic attitudes.
These findings have important implications for democracy. Understanding how electoral outcomes shape politicians’ democratic attitudes matters because, to the extent that attitudes inform behaviour, elite evaluations of democracy may have downstream consequences for institutional stability. Evidence suggests that politicians’ beliefs can shape their conduct as representatives (Lucas, Sheffer and Loewen Reference Lucas, Sheffer and Loewen2024), and that elite messaging about democracy influences mass opinion (Clayton and Willer Reference Clayton and Willer2023; Clayton, Davis, Nyhan et al. Reference Clayton, Davis, Nyhan, Porter, Ryan and Wood2021; Esaiasson, Arnesen and Werner Reference Esaiasson, Arnesen and Werner2023). Our findings reveal that democratic attitudes among rank-and-file politicians are highly malleable and contingent on electoral outcomes. While these gaps do not necessarily signal democratic erosion – politicians on both sides maintain broadly positive evaluations, most losers remain above critical thresholds of dissatisfaction with democracy, and some preferences, such as for direct democracy, are not inherently problematic – the contingency of these attitudes on electoral fortunes shows that politicians’ democratic stances respond to losses rather than being grounded solely in stable principles. Whether and under what conditions this malleability translates into anti-democratic behaviour remains an open question, but the findings underscore the importance of understanding the psychological foundations of elite democratic attitudes, particularly in contexts where democratic norms face erosion (Valentim Reference Valentim2026).
The paper proceeds as follows. First, we review the literature on the winner–loser gap on democratic attitudes and provide our rationale for how different electoral outcome levels shape politicians’ democratic attitudes and preferences. Then, we introduce the research design and present the results of our empirical comparative analyses. We conclude by discussing our findings and their implications.
The winner–loser gap in democratic attitudes among voters and politicians
Concerns about winners’ and losers’ reactions to electoral outcomes have motivated extensive research on how electoral results shape citizens’ democratic attitudes. It is now well established that winners and losers systematically differ in their evaluations of democracy, with winners displaying more positive attitudes than losers across a range of indicators, in both proportional and majoritarian systems, and across established and new democracies, a phenomenon termed the winner–loser gap (inter alia Anderson and Guillory Reference Anderson and Guillory1997; Anderson, Blais, Bowler et al. Reference Anderson, Blais, Bowler, Donovan and Listhaug2005; Bäckström Reference Bäckström2026; Curini, Jou and Memoli Reference Curini, Jou and Memoli2012; Dahlberg and Linde Reference Dahlberg and Linde2017; Daoust and Nadeau Reference Daoust and Nadeau2023; Singh Reference Singh2014). Three complementary mechanisms have been proposed to explain this gap. First, the utilitarian perspective argues that winners display higher democratic satisfaction because their preferred policies are more likely to be implemented, while losers express lower satisfaction due to reduced policy influence (Anderson and Guillory, Reference Anderson and Guillory1997; Anderson, Blais, Bowler et al. Reference Anderson, Blais, Bowler, Donovan and Listhaug2005). Second, the affective perspective emphasizes emotional reactions to winning and losing: winners express higher satisfaction due to positive feelings associated with victory, while losers react negatively to defeat (Toshkov and Mazepus Reference Toshkov and Mazepus2023). Third, the cognitive approach suggests that voters adjust their evaluations of democracy to maintain consistency between the electoral outcome and their assessment of how well the democratic system is functioning (Anderson, Blais, Bowler et al. Reference Anderson, Blais, Bowler, Donovan and Listhaug2005; Bäckström Reference Bäckström2026). These explanations are not mutually exclusive but complementary; typically, all three perspectives apply.
In contrast to the extensive voter-level literature, research on political elites remains limited. Kingdon (Reference Kingdon1967; Reference Kingdon1968) first documented that election outcomes shape politicians’ cognitions: winners congratulate the electorate while losers rationalise defeat by downgrading voters’ competence. Kim and Racheter (Reference Kim and Racheter1973) later provide an empirical test of Kingdon’s ‘congratulation-rationalization’ hypothesis with a pre-post-electoral panel in the US to show that this gap is systematic. More recently, Schnaudt (Reference Schnaudt2023) shows electoral defeat drives skepticism about electoral integrity among German candidates. Senninger, Baekgaard and Seeberg (Reference Senninger, Baekgaard and Seeberg2026) provide causal evidence from Danish municipal elections that narrow losers are more concerned about electoral fairness. Finally, Kuipers (Reference Kuipers2025) provides panel evidence from the 2024 Indonesian election showing that losing candidates report larger declines in trust in electoral institutions, concentrated among those with high pre-election expectations of victory.
In all three recent cases, the proposed mechanisms driving the winner–loser gap are similar to those operating among voters: emotional reactions, cognitive dissonance, and utility calculations. In contrast to voters, however, politicians face additional cognitive pressures and distinct utilities. The cognitive dimension extends Kingdon’s congratulation-rationalisation logic into blame avoidance: politicians attribute electoral losses to external factors such as institutions, media, or voters’ incompetence, projecting their own dissatisfaction onto the electorate (Schnaudt Reference Schnaudt2023; Senninger, Baekgaard and Seeberg Reference Senninger, Baekgaard and Seeberg2026). On the utilitarian dimension, politicians, akin to their constituents, exhibit a keen interest in fulfilling their policy preferences (Senninger, Baekgaard and Seeberg Reference Senninger, Baekgaard and Seeberg2026), but manifest an intensified interest compared to the average voter, as they are more ideologically attached to a particular political project (May Reference May1973). On top of that, policy preferences constitute merely one facet of the electoral game for political elites. The democratic contest also encompasses the desired elective offices of these elites (Schnaudt Reference Schnaudt2023; Senninger, Baekgaard and Seeberg Reference Senninger, Baekgaard and Seeberg2026). The outcome of winning or losing directly influences political careers, either disrupting or fostering their trajectories.
However, existing elite-level studies share three important limitations. First, they rely on single-country analyses, leaving open whether the winner–loser gap among politicians generalises systematically across political contexts. Second, the studied primary outcomes have been perceptions of electoral fairness and trust in elections, with SWD largely absent from the elite-level literature despite being the central outcome in voter-level research. Third, and most importantly, existing studies examine outcomes at a single level – whether the candidate won or lost – without distinguishing between individual (candidate-level) and collective (party-level) results. Yet politicians, unlike voters, face two distinct levels of electoral outcomes: whether they personally secure a seat in parliament and whether their party enters government. These two levels generate different types of utility and may interact in shaping democratic attitudes. In the next section, we build on previous work to develop expectations about the winner–loser gap at different electoral outcome levels and derive hypotheses about SWD and other democratic attitude indicators.
Individual and collective electoral outcomes: asymmetric utilities and interactions
Unlike voters, politicians’ electoral outcomes can be defined at the individual (candidate) and at the collective (party) level. Winning or losing at each level can generate emotional reactions, though whether these operate symmetrically or asymmetrically remains unclear. Similarly, different outcome levels may trigger cognitive rationalisation to varying degrees, without a clear rationale for predicting which should dominate. In contrast, there are strong theoretical reasons to expect that winning at each level generates distinct sets of utilities that interact in predictable ways. We focus on these utility structures to theorise about the winner–loser gap among politicians.
At the individual level, electoral outcomes determine whether candidates secure a seat in parliament. Winning a seat provides direct career utility through access to elected office. In addition, those who become Members of Parliament (MPs) acquire additional avenues to pursue their policy preferences. They gain political influence within their party and assume an active role in parliamentary policy-making (Katz and Mair Reference Katz and Mair1993). However, individual MPs’ policy utility remains constrained by the party apparatus and the party’s overall performance in government formation (Ennser-Jedenastik and Müller Reference Ennser-Jedenastik and Müller2015). Thus, individual success generates substantial office utility but only limited policy utility, as MPs’ legislative influence depends heavily on their party’s position in the government.
At the collective level, electoral outcomes determine the candidate’s party chances of entering government. Political parties seek three primary organisational objectives: garnering votes, securing offices, and realising their policy agenda, with votes serving as the primary means to achieve the latter two goals (Strom Reference Strom1990). Elections constitute the main mechanism through which political parties pursue these objectives. Electoral performance translates from voting shares into seat shares, which serve as leverage for coalition making that may result in government entry. Government status is then primarily a function of electoral performance, though also coalition strategies (Döring and Hellström Reference Döring and Hellström2013), which determines access to executive resources, policy-making capacity, and office allocation within the public administration (Müller and Strom Reference Müller and Strom1999). For candidates, their party’s government entry generates substantial policy utility – parties in government are better positioned to enact their policy preferences than those in opposition – and additional office utility through increased chances of appointments to nominated offices and career advancement (Gulzar Reference Gulzar2021).
Individual candidates derive dual utility from their party’s electoral performance. First, their policy preferences are better integrated into the political system. Second, they also benefit from office-related utility, with increased chances of being appointed to nominated offices and advancing their political careers (Gulzar Reference Gulzar2021). Furthermore, their status as party elites may be influenced by the collective performance of the party. The survival of party leaders is heavily contingent upon their electoral success (Andrews and Jackman, Reference Andrews and Jackman2008; Ennser-Jedenastik and Müller Reference Ennser-Jedenastik and Müller2015), and such consequences can rebound among rank-and-file politicians, many of whom occupy key roles within the leader’s inner circle or whose candidacy status is influenced by the party leader (Hazan and Rahat Reference Hazan and Rahat2010). Therefore, political candidates derive strong utility gains from accessing office, both at the individual and collective levels.
These two levels of outcomes therefore generate different types of utility in interaction. Policy and individual utility are contingent on the results obtained at both the candidate and party levels. However, the influence of individual candidate results on policy utility is minimal, whereas collective party outcomes have significant implications for both policy and office utility. Party outcomes may even attenuate the utility derived from individual success – particularly with regard to holding office. For example, a candidate who loses their constituency race may still secure a nominated public office if their party enters government. Conversely, individual victories are unlikely to offset the policy utility losses that stem from a party’s electoral defeat. A winning candidate from a party in opposition may still face major constraints in pursuing their policy goals, despite having secured a seat. Given that party results shape both access to office and policy influence, while individual results primarily determine entry into elective office, we expect that the impact of individual success on democratic attitudes will depend heavily on party performance. In the next section, we develop specific expectations about how these outcome levels shape different democratic attitudes.
Hypotheses across democratic attitudes and outcome levels
The winner–loser gap in democratic attitudes among voters has been studied primarily through SWD, which captures evaluations of how well the democratic regime is functioning in practice and remains the most established outcome in the literature (eg, Anderson, Blais, Bowler et al. Reference Anderson, Blais, Bowler, Donovan and Listhaug2005; Bäckström Reference Bäckström2026; Curini, Jou and Memoli Reference Curini, Jou and Memoli2012; Daoust and Nadeau Reference Daoust and Nadeau2023; Dahlberg and Linde Reference Dahlberg and Linde2017; Singh Reference Singh2014). SWD serves as a key indicator because it reflects a mid-level form of political support – not principled commitment to democracy as a regime type, but evaluations of democratic performance that are responsive to political events and outcomes (Linde and Ekman Reference Linde and Ekman2003). The robustness and centrality of SWD in the voter literature makes it our primary outcome of interest.
However, the gap extends beyond satisfaction to other democratic attitudes, including trust in different political institutions (eg, Anderson and LoTempio Reference Anderson and LoTempio2002; Böhringer and Boucher Reference Böhringer and Boucher2024) and democratic preferences (Allinger Reference Allinger2024); and for politicians, evaluation of voters (Kim and Racheter Reference Kim and Racheter1973; Kingdo Reference Kingdon1967, Reference Kingdon1968). This broader scope reflects that the winner–loser gap operates across multiple dimensions of democratic attitudes, not only evaluations of regime performance, which together with the acknowledged vagueness of SWD as an indicator (Linde and Ekman Reference Linde and Ekman2003; Singh and Mayne Reference Singh and Mayne2023) has pushed researchers to study the winner–loser gap beyond it. Following this trend, we derive expectations about the winner–loser gap among politicians across three sets of outcomes, limited by data availability (as we discuss in the data section). These outcomes can be grouped into democratic evaluations (focused primarily on SWD), perceptions of citizens’ trust in democracy, and preferences for direct versus representative democracy. For each outcome, we derive hypotheses at the individual level (H1), collective level (H2), and their interaction (H3).
Democratic evaluations
We expect electoral outcomes to shape politicians’ evaluations of democracy. Our primary measure is SWD, given its centrality in the voter-level literature. Democratic evaluations tap into politicians’ assessments of how well democracy is functioning. As with voters, the utilitarian, affective, and cognitive mechanisms outlined earlier should generate a winner–loser gap in democratic evaluations among politicians. At the individual level, winning a seat provides office utility and limited policy influence, generating positive evaluations of the democratic system that delivered this outcome. Losing denies these utilities and triggers negative affective reactions and cognitive dissonance, depressing democratic evaluations. We therefore hypothesise:
Hypothesis 1a: Politicians who win at the individual level report higher democratic evaluations than those who lose at the individual level.
At the collective level, party government entry provides substantial policy utility and additional office resources, generating strong positive evaluations among candidates from winning parties. Conversely, party exclusion from government limits policy influence and triggers negative reactions, depressing evaluations among candidates from losing parties. The party’s entry into government is pivotal in translating their policy agenda into legislative action. Considering the inherently partisan nature of politicians compared to the general electorate, the attainment of policy preferences holds strong significance for them (May Reference May1973). Furthermore, candidates can also derive office utility if their party is in government, as parties in government gain supplementary resources and secure appointed positions within the public administration (Müller and Strom Reference Müller and Strom1999). Finally, their ingroup win should trigger a positive affective response and a negative response otherwise. Given the substantial implications of party outcomes for candidates’ policy objectives and political trajectories and politicians’ emotional involvement with their party, we expect:
Hypothesis 2a: Politicians from parties that enter government report higher democratic evaluations than politicians from parties that remain in opposition.
Finally, we expect the individual-level gap to be conditioned by collective outcomes. Policy and office utility are contingent on results obtained at both the candidate and party levels. However, as outlined above, the influence of individual candidate results on policy utility is minimal, whereas collective party outcomes have significant implications for both policy and office utility. Party outcomes may even attenuate the utility derived from individual success. For example, a candidate who loses their constituency race may still secure a nominated public office if their party enters government. Conversely, individual victories are unlikely to offset the policy utility losses that stem from a party’s electoral defeat. A winning candidate from a party in opposition may still face major constraints in pursuing their policy goals, despite having secured a seat.
Specifically, we expect party-level defeats to depress democratic satisfaction and institutional support across the board – even among individually successful candidates. In these cases, the dominant utility signal is one of collective loss, and thus we do not anticipate a meaningful winner–loser gap within losing parties. Conversely, party-level victories generate substantial utility gains, particularly in terms of policy influence and access to office. In this context, individual-level success compounds these gains: winning candidates from winning parties benefit both from personal office-holding and from their party’s governing position. This compounded utility should manifest in heightened democratic satisfaction and support. Therefore, the winner–loser gap in democratic attitudes should be most pronounced within winning parties, where individual- and party-level gains align. We therefore hypothesise:
Hypothesis 3a: The individual-level winner–loser gap in democratic evaluations is larger among politicians from parties that enter government than among politicians from parties that remain in opposition.
Perceptions of citizens’ trust in democracy
Beyond their own evaluations, we expect electoral outcomes to shape politicians’ perceptions of how citizens evaluate democracy. This expectation builds on social projection mechanisms documented in the elite attitudes literatures. Kingdon (Reference Kingdon1967, Reference Kingdon1968) showed that winning candidates congratulate the electorate for making the right choice, while losing candidates rationalise defeat by downgrading voters’ competence – a pattern rooted in the need to maintain self-esteem and avoid cognitive dissonance. Kim and Racheter (Reference Kim and Racheter1973) demonstrated that this congratulation-rationalisation effect is systematic, operating through social projection: politicians attribute their own attitudes to the broader public (Ross, Grene and House Reference Ross, Grene and House1977). This argument is further supported by recent literature showing that political elites project their policy positions onto voters and public opinion in general (Furnas and LaPira, Reference Furnas and LaPira2024; Pereira Reference Pereira2021).
Following a similar interaction of utilities at the individual and collective levels, we hypothesise the following:
Hypothesis 1b: Politicians who win at the individual level perceive higher levels of citizens’ trust in democracy than those who lose at the individual level.
Hypothesis 2b: Politicians from parties that enter government perceive higher levels of citizens’ trust in democracy than politicians from parties that remain in opposition.
Hypothesis 3b: The individual-level winner–loser gap in perceptions of citizens’ trust in democracy is larger among politicians from parties that enter government than among politicians from parties that remain in opposition.
Preferences for direct versus representative democracy
Finally, we expect electoral outcomes to shape politicians’ preferences for democratic institutional design, specifically their preference for direct democracy over representative democracy. The voter literature shows that preferences for direct democracy are determined by political distrust and dissatisfaction with the system (Bowler, Donovan and Karp Reference Bowler, Donovan and Karp2007; Jacquet, Niessen and Reuchamp Reference Jacquet, Niessen and Reuchamps2022; Neblo, Esterling, Kennedy et al. Reference Neblo, Esterling, Kennedy, Lazer and Sokhey2010; Seyd, Curtice and Rose Reference Seyd, Curtice and Rose2018; Werner, Marien and Felicetti Reference Werner, Marien and Felicetti2020). Citizens who perceive that representative institutions and the government do not align with their policy preferences tend to value direct democracy as a tool to get their voice heard in the political system. It has been argued that their inclination towards direct democracy ultimately results from political frustration (Werner, Marien and Felicetti Reference Werner, Marien and Felicetti2020). Recent evidence extends this pattern to the winner–loser gap: losing voters express stronger preferences for direct democracy as a means of bypassing representative institutions that failed to deliver their preferred outcomes (Allinger Reference Allinger2024).
We expect a similar dynamic among politicians, but with additional intensity due to their heightened frustration with exclusion from representative institutions. As candidates fail to secure office, their status as ordinary citizens becomes more salient than that of elected politicians. This means that losers cannot exert their influence as representatives to implement their preferred policies. Instead, they must rely on others, including their opponents, as their prospective political representatives. Moreover, the frustration generated by the electoral loss serves as a factor that fosters candidates’ preferences for direct democracy. The logic is similar to that operating among voters, but the stakes are higher: politicians are more ideologically committed to their policy positions (May Reference May1973) and may feel more frustrated by exclusion from the representative arena they sought to enter. Therefore, we expect that losing heightens preferences for direct democracy at the expense of representative democracy mechanisms. Following our outcome-level distinction and interaction, we hypothesise:
Hypothesis 1c: Politicians who win at the individual level express weaker preferences for direct democracy relative to representative democracy than those who lose at the individual level.
Hypothesis 2c: Politicians from parties that enter government express weaker preferences for direct democracy relative to representative democracy than politicians from parties that remain in opposition.
Hypothesis 3c: The individual-level winner–loser gap in preferences for direct democracy is larger among politicians from parties that enter government than among politicians from parties that remain in opposition.
Comparative evidence from 27 elections
Data description
To test our hypotheses, we use data from the Comparative Candidate Survey (CCS 2016, 2022) from 2005 to 2018. The Comparative Candidate Survey is a collaborative multinational project collecting information on candidates in national parliamentary elections using a standardised questionnaire. The CCS encompasses two waves: 2005–2012 and 2013–2018. Data collection takes place after the electoral events. Although there are slight variations in data collection procedures across countries, the methodologies remain largely consistent overall. Notably, differences arise concerning the candidate universe covered, with some countries encompassing candidates from all political parties while others focus solely on candidates affiliated with parties holding parliamentary representation.
The surveys are administered as self-completion questionnaires, utilising online, face-to-face, mail-back, or telephone completion methods. Table A1 in the online Appendix presents an overview of the fieldwork details for each electoral contest under analysis, including the candidate universe covered, fieldwork dates, and responsible data collectors for each study. The same table also reports response rates across countries, which show striking similarities, typically ranging between 20% and 50%, despite some notable exceptions – which then we exploit to provide a causal test.Footnote 2 Figure A1 in the online Appendix presents the distribution of fieldwork start and end dates relative to the electoral date, as well as the overall duration of data collection. In most cases, fieldwork begins shortly after the election – typically within a few months – and spans approximately three to four months. However, a few studies initiated fieldwork years after the election. This variation in timing constitutes a limitation that should be considered when interpreting our results. To assess whether distance from the election date biases our estimates, we perform additional analyses splitting the sample at the median fieldwork start date and re-estimate our main models separately for early-fieldwork and late-fieldwork elections. These results are reported later as robustness checks.
Finally, even though we lack a full record of administrative data for each of the countries covered by the CCS, a comparison of our sample from Germany to administrative data from candidates to the Bundestag in the 2017 German federal election suggests that the data are largely representative of the population of political candidates on the observed covariates, including party affiliation and gender.Footnote 3
For the empirical analysis, we use a subset of the data, including 27 electoral contests spanning 15 European countries. Our selection criterion was data availability. We have excluded all the cases that did not contain our main variables of interest: party affiliation and democratic attitudes. The resulting dataset comprises a total of 19,747 candidates for national parliaments, with substantial variation in key socio-demographic indicators. The mean age of our sample stands at 45.7 years, with a standard deviation of 13.9 years. The youngest candidate in our dataset is 17 years old, while the eldest candidate is 98 years old. Approximately 65% of our sample have attained tertiary education, while 31% have achieved secondary education, and only 3% have completed primary education or below. Our candidate dataset comprises 66% males and 34% females. Regarding party affiliation, following the PopuList classification (Rooduijn, Pirro, Halikiopoulou et al. Reference Rooduijn, Pirro, Halikiopoulou, Froio, van Kessel, de Lange, Mudde and Taggart2023), roughly 11% of candidates represent far-right parties, close to 9% have run for radical left parties, and the remaining 80% have affiliations with mainstream and other party families. Detailed descriptive statistics on gender, age, and education levels for each electoral contest are provided in Table A2 in the online Appendix.
Variables’ operationalisation
The empirical analysis hinges on several key concepts, including democratic evaluations, perception of citizens’ trust in democracy, democratic preferences, as well as collective party electoral outcomes, and individual electoral results. These concepts are operationalised using various items available in the CCS dataset.
Dependent variables
Our dependent variable selection is shaped by data availability. We use existing CCS items that tap into democratic attitudes, selecting all variables relevant to the winner–loser gap based on the literature. Each variable is independently motivated by previous research, as discussed below.
The primary outcome is SWD, the most established indicator in the winner–loser gap literature at the voter level, which taps into democratic evaluations. This is assessed through candidates’ responses to the question: ‘On the whole, are you very satisfied, fairly satisfied, not very satisfied, or not at all satisfied with the way democracy works in [country]?’ (CCS 2016, 2022). As discussed above, this question gauges support for the functioning of the democratic regime in practice rather than principled commitment to democracy as a regime type (Linde and Ekman Reference Linde and Ekman2003). Responses are measured on a scale from 1 to 4, with 4 indicating ‘very satisfied’ and 1 indicating ‘not at all satisfied’. To complement SWD and capture democratic evaluations more broadly, we also use candidates’ agreement with the statement: ‘Legislation represents the interests of the majority of citizens’. This variable is measured using a five-point Likert scale, ranging from 5 for ‘strongly agree’ to 1 for ‘strongly disagree’. This item allows us to capture candidates’ evaluations of parliament as a representative institution, connecting with items assessed at the voter level, such as trust in parliament (Anderson and LoTempio Reference Anderson and LoTempio2002).
Our second outcome captures politicians’ perceptions of citizens’ trust in democracy, motivated by the social projection mechanisms documented by Kingdon (Reference Kingdon1967, Reference Kingdon1968) and extended by Kim and Racheter (Reference Kim and Racheter1973). Candidates are asked to rate their agreement with the statement: ‘Our democracy is about to lose the trust of the citizens’. Responses are recorded on a Likert scale, where 1 signifies ‘strongly agree’ and 5 means ‘strongly disagree’. This variable captures how politicians perceive democracy performing in the eyes of the population, distinct from their own evaluations. By examining these perceptions, we can assess whether the winner–loser gap extends beyond politicians’ personal attitudes to their beliefs about public opinion.
The third set of outcomes captures democratic preferences regarding representative versus direct democracy, motivated by evidence that the winner–loser gap shapes institutional preferences among voters (Allinger Reference Allinger2024) and that preferences for direct democracy are driven by political distrust and frustration with exclusion from representative institutions (Bowler, Donovan and Karp Reference Bowler, Donovan and Karp2007; Werner, Marien and Felicetti Reference Werner, Marien and Felicetti2020). We use two questions, both assessed using a Likert scale, with 5 representing ‘strongly agree’ and 1 representing ‘strongly disagree’. The first statement, ‘Parliament, not voters, should make final decisions on law and policy’, enables us to measure the trade-off between representative and direct democracy. The second statement assesses candidates’ views on referendums, one of the most prominent direct democracy tools: ‘Referendums tend to be poorly thought out and make bad law’. Higher agreement with this statement indicates skepticism towards direct democracy mechanisms, while lower agreement suggests preference for direct democratic tools.
Independent variables
Our dataset includes not only MPs but also candidates who were unsuccessful in securing seats in parliament. This enables us to examine the winner–loser status at the individual level. Our operationalisation captures whether respondents succeeded in being elected. In certain countries, this information is obtained from administrative electoral data; in others, from survey self-reports. Our variable is binary and indicates whether respondents were elected to the office they ran for or not.
Our second independent variable captures the winner–loser status at the collective (party) level. We assign parties to candidates based on which party they ran for, then operationalise collective winning and losing as whether the candidate’s party entered government or remained in opposition. Government entry is commonly used to capture the winner status in the winner–loser gap literature (eg, Curini, Jou and Memoli Reference Curini, Jou and Memoli2012; Dahlberg and Linde Reference Dahlberg and Linde2017; Singh Reference Singh2014). Although alternative operationalisations tapping into electoral winning and losing exist – such as the largest share of votes or seats, or even subjective perceptions of winning (eg, Plescia Reference Plescia2019) – government entry is our preferred measure for three reasons. First, it aligns with our theoretical framework: government entry provides substantial policy utility, as parties in government are better positioned to enact their policy preferences than those in opposition, and additional office utility through access to appointed positions and executive resources (Müller and Strom Reference Müller and Strom1999). Second, recent evidence shows that the winner–loser gap stabilises over time after government coalitions are formed, suggesting that government participation – not just vote or seat share – is the key outcome that shapes democratic attitudes (Bäckström Reference Bäckström2026). Third, government formation remains strongly driven by electoral outcomes, as parties with more seats are more likely to enter government (Döring and Hellström Reference Döring and Hellström2013), ensuring that our measure is still anchored in electoral performance.
To operationalise government entry, we have compiled information from the ParlGov dataset regarding cabinet formationFootnote 4 (Döring, Quaas, Hellström et al. Reference Döring, Quaas, Hellström and Manow2023). We categorise parties as being in government if they held executive positions during the fieldwork period. Election studies conducted during periods of cabinet changes, such as coalition shifts or motions of censure, have been excluded from our analysis. To ensure our results are not sensitive to this operationalisation choice, we conduct robustness checks using alternative measures: whether the party was the largest by seat share and whether the party was the largest by vote share. These results are reported in the online Appendix and discussed later in the results section.
Control variables
To assess the robustness of the empirical relationships, our statistical models control for sociodemographic features, including candidate gender, age, self-reported ideology, and education level. We also add controls for two variables that capture political professionalisation. The first is a dummy variable that captures whether the candidate has previously held any public office or paid party office position. This includes nominated and elected national, regional, and local offices. Our second variable captures professionalisation at the party central office, indicating whether the candidate has held positions at the national, regional, or local levels. The average variance inflation factor (VIF) for all independent variables is around 4, which suggests no multicollinearity issues.
Estimation
Our empirical analysis examines five dependent variables ranging from 1 to 4 or 1 to 5 points. We estimate ordinary least squares regression models (OLS) with election fixed effects and clustered standard errors at the electoral contest level. Our fixed-effects models allow us to control for electoral context variables that could introduce bias into our estimates. We estimate the following specification, where Y is our dependent variable, x is the winner–loser status, X’ is a vector of individual-level control variables, and y is election fixed effects:
 ${{\rm{Y}}_{\rm{i}}} = \alpha + {\rm \beta _1}{x_i}{\rm{\;}} + {\rm{\;}}\beta _2^{'}{\rm{X}}_i^{'}\, + \,{\rm \gamma _{\rm{i}}}\, + \,{\epsilon _{\rm{i}}}$
Main results
Before testing our hypotheses, we provide a descriptive overview of our variables of interest. Figures A2 to A6 in the online Appendix show candidates’ democratic attitudes across electoral contests. Focusing on SWD, most candidates express high or moderate satisfaction, though Southern Europe, post-communist democracies, and the UK exhibit greater dissatisfaction, while Northern and Western democracies show higher satisfaction.
Moreover, disparities are also apparent in how politicians perceive the functioning of their parliaments. Candidates from the first subset of countries often believe that legislation inadequately reflects citizens’ interests, and there is a predominant perception that citizens are losing trust in democracy. Interestingly, these differences do not extend to democratic preferences, as politicians across all countries generally favor representative democracy over direct democracy. However, Switzerland stands out as an exception, where candidates prefer direct democracy over representative democracy. These observed patterns underscore the necessity of including election-fixed effects in our regression models.
Figure 1 presents the coefficients from our regression models for all five dependent variables: the perception that legislation reflects the majority’s interests, politicians’ perceptions of citizens’ trust in democracy, and the two measures of democratic preferences (parliament vs. voters should make decisions; views on referendums).
OLS election fixed effects with robust standard errors.
Note: SWD; 27 electoral contests. Majority interest; Portugal 2011 and Hungary 2010 missing. Citizens’ trust; Portugal 2011, Hungary 2010, and Romania 2012 missing. Parliament; Portugal 2011 missing. Referendum; Norway 2013 and Switzerland 2007 and 2011 missing.

Figure 1. Long description
The image contains five scatter plots, each representing different political factors and their effects on specific outcomes. Each plot has a vertical axis ranging from -0.5 to 0.5 and a horizontal axis with various political factors. The factors include not elected, party not in government, not previous public office, not previous central office, ideology, secondary education, tertiary education, years, and female. The outcomes measured are SWD, majority interest, citizens’ trust, parliament, and referendum. Each scatter plot shows data points with error bars, indicating the confidence intervals for each factor’s effect. The red vertical line at 0 serves as a reference point for no effect. Panel A: The scatter plot for SWD shows the effects of various political factors on SWD. Notable factors include not elected, party not in government, and not previous public office, which all have data points to the left of the red line, indicating a negative effect. Panel B: The scatter plot for majority interest shows the effects of various political factors on majority interest. Similar to SWD, factors like not elected and party not in government show negative effects. Panel C: The scatter plot for citizens’ trust shows the effects of various political factors on citizens’ trust. The data points for factors like not elected and not previous public office are also to the left of the red line, indicating a negative effect. Panel D: The scatter plot for parliament shows the effects of various political factors on parliament. Factors such as not elected and party not in government again show negative effects. Panel E: The scatter plot for referendum shows the effects of various political factors on referendum outcomes. The pattern is consistent with other plots, where factors like not elected and party not in government show negative effects.
At the individual level, we find that losing candidates display lower SWD, along with a weaker belief that parliament accurately represents the majority’s interests (H1a). The coefficients are substantively large. Losing at the individual level is associated with SWD that is 0.23 points lower on a 1–4 scale and a 0.34-point reduction in the belief that parliaments represent the interests of the majority on a 1–5 scale. These associations are larger than those for any other individual-level characteristics such as education or ideology. Additionally, individual candidates’ electoral outcomes are significantly associated with their perceptions of citizens’ trust in democracy; losing candidates are more inclined to perceive a decline in citizens’ trust compared to their successful counterparts (H1b). The coefficient is 0.31 points lower on a 1–5 scale among losers. Regarding democratic preferences (H1c), our findings indicate that winning candidates agree 0.14 points more (on a 1–5 scale) with the idea that parliaments, rather than voters, should make the final political decisions, although no discernible differences exist between winners and losers regarding opinions on referendums. The association for the parliament item is smaller than for our primary indicator (SWD), though the coefficient remains among the largest of our predictors. Therefore, our evidence regarding whether individual electoral results are associated with candidates’ preferences for representative versus direct democracy is mixed (H1c), while our results provide strong evidence for H1a and H1b.
At the collective level, our analysis yields support for H2a and H2b. We find that party government entry is significantly associated with candidates’ democratic evaluations. Candidates from parties that remain in opposition exhibit 0.21 points lower SWD and a 0.33-point reduction in the belief that parliament represents the majority’s interests compared to candidates from parties in government (H2a). We also observe that party government entry is positively associated with candidates’ perceptions of citizens’ trust in democracy, with opposition party-affiliated politicians expressing 0.28 points lower perceptions of citizens’ trust compared to those from governing parties (H2b). In contrast to the results for H1c, we find strong evidence that party outcomes are associated with politicians’ democratic preferences. Politicians from parties in government tend to prefer representative democracy over direct democracy, as evidenced in Figure 1. Our results indicate a stronger preference for parliaments over voters as the main policy-making actors among these politicians. Additionally, these politicians view referendums as worse policy-making instruments by 0.25 points on a 1–5 scale (H2c). The association is not just significant at the party level, but the effect size is substantively large for both indicators, much larger than at the candidate level, and larger than any of our control variables, which remain largely insignificant.
Figure 2 presents the interaction between individual and collective outcomes. Our analysis reveals that individual candidate results do not moderate the association of party outcomes with our dependent variables. On the contrary, the associations for individual candidate outcomes are moderated by the party’s status in government. Specifically, when politicians’ parties do not secure positions in government, the winner–loser gap at the individual candidate level dissipates. In other words, the party’s exclusion from government nullifies the association between individual candidate outcomes and democratic attitudes. This pattern is discernible across all dimensions of democratic evaluation, including SWD, the assessment of parliament’s responsiveness to the majority’s interests, and the perception of citizens’ trust in democracy (H3a and H3b). Regarding variables capturing democratic preferences, we find that individual candidate results lack significance once we introduce the interaction between collective and individual results. Instead, party outcomes significantly are associated with politicians’ preferences between direct and representative democracy, while the outcomes of individual candidates have no discernible association with these preferences (H3c). Therefore, we find strong supportive evidence for H3.
Margins of individual and collective result interaction.
Note: SWD; 27 electoral contests. Majority interest; Portugal 2011 and Hungary 2010 missing. Citizens’ trust; Portugal 2011, Hungary 2010, and Romania 2012 missing. Parliament; Portugal 2011 missing. Referendum; Norway 2013 and Switzerland 2007 and 2011 missing.

Heterogeneity analyses and implications
Exploiting the comparative nature of our data, we conduct exploratory descriptive analyses to examine whether the winner–loser gap varies across macro-regions and party types and to assess the potential democratic implications of the gap by analyzing gaps in democratic evaluations more thoroughly.
First, we assess whether the winner–loser gap generalises across political contexts by re-estimating our main models separately for four European macro-regions (Northern Europe, Western Europe, Southern Europe, and Eastern Europe) and Switzerland.Footnote 5 Figure A23 in the online Appendix presents these results. Coefficients for individual and collective losses are consistently negative across democratic evaluations and citizens’ trust, though significance varies by region. For SWD, both gaps are consistent in Western, Southern, and Eastern Europe, with Eastern Europe showing particularly large coefficients. In Northern Europe and Switzerland, the patterns are weaker and often not statistically significant. For democratic preferences, we find no consistent gap across regions. These regional differences may reflect variation in democratic quality, as recent evidence suggests the winner–loser gap is smaller in higher-quality democracies (Monsiváis-Carrillo Reference Monsiváis-Carrillo2022; Nadeau, Daoust and Dassonneville Reference Nadeau, Daoust and Dassonneville2023). However, patterns are not entirely consistent with this interpretation, and we lack sufficient statistical power to test these mechanisms directly.
Second, we examine whether the winner–loser gap differs between mainstream and radical parties. We interact party type (far-left, far-right, or mainstream/other, based on the PopuList classification; Rooduijn, Pirro, Halikiopoulou et al. Reference Rooduijn, Pirro, Halikiopoulou, Froio, van Kessel, de Lange, Mudde and Taggart2023), with individual and collective outcomes (Figures A16 and A17 in the online Appendix). For the association between collective results and democratic evaluations and citizens’ trust, we observe a larger gap among far-left and far-right candidates compared to mainstream parties, though differences are not statistically significant due to larger confidence intervals. Interestingly, the gap in democratic preferences appears among mainstream/other party candidates but disappears among far-left and far-right candidates, potentially reflecting populist orientations that shape institutional preferences independently of electoral outcomes. However, this interpretation is speculative. Overall, results suggest the winner–loser gap operates across party types with some variation in magnitude.
Our results show systematic mean differences in democratic attitudes between winners and losers and suggest larger gaps among far-left and far-right candidates in democratic evaluations. Yet our descriptive evidence shows that most candidates maintain broadly positive evaluations, which may obscure whether a minority falls below critical thresholds. Even if aggregate levels remain positive, concentrated pockets of very low satisfaction among specific subgroups could pose risks if these attitudes translate into anti-democratic behaviour. This is particularly salient given that the winner–loser gap may be asymmetrically driven by losses due to negativity bias (Kahneman and Tversky Reference Kahneman and Tversky2013). However, our cross-sectional design does not allow us to assess this possibility directly. We therefore explore this question descriptively by examining the proportion of candidates above the midpoint in each dependent variable (ie, reporting positive values) by winner–loser status and party type (Figures A7 and A8 in the online Appendix). Focusing on SWD (1-4 scale), where we categorise 3 or 4 as positive (1 or 2 as negative), and on individual-level outcomes, we identify substantial variation: approximately 64% of losers from mainstream/other parties express positive evaluations versus 75% of winners; among far-left candidates, 43% of losers versus 31% of winners (though far-left winners are particularly few); and among far-right candidates, 52% of losers versus 71% of winners. Far-left and far-right losers show substantially lower proportions of positive satisfaction compared to mainstream losers (43% and 52% versus 64%), and the pattern is similar for collective-level outcomes. While purely descriptive, this suggests negative evaluations concentrate among a minority of radical party losers.Footnote 6 Whether this translates into threats to democratic stability remains unclear, though these findings provide an initial assessment of potential democratic implications.
Robustness checks
We conducted additional analyses to assess the robustness of our main results to alternative statistical specifications, omitted variable bias, and alternative operationalisations of our key variables.
First, we employ ordered logistic regression with electoral contest dummies and clustered standard errors. Given that our dependent variables are ordinal rather than continuous, this specification is more appropriate. Figures A10 to A12 and Tables A8 and A9 in the online Appendix present the results, which remain consistent with our main findings. Second, jackknife analyses (Appendix A8) show our results are not driven by influential cases; coefficients remain statistically significant and substantively similar across iterations. We further grouped countries into five macro-regional categories and re-estimated models while sequentially excluding each region. Findings remain substantively consistent with no major changes in estimates.
Third, pre-election expectations may moderate the association between individual outcomes and democratic attitudes. We re-estimate models controlling for candidates’ self-assessed election chances. Figures A18 to A20 and Tables A10 and A11 in the online Appendix present results. Democratic evaluations and citizens’ trust perceptions remain robust, though Figure A21 in the online Appendix shows the gap is larger when losing is unexpected, consistent with Kuipers (Reference Kuipers2025). We supplement this analysis with pre-election polling data for a subset of elections, providing an alternative expectations measure assessed prior to the election.Footnote 7 Pre-election polls do not rely on candidates’ subjective perceptions and, unlike the subjective expectations measured in the CCS, are measured before the election, so they cannot be influenced by the outcome itself. We calculate the difference between parties’ actual vote shares and their projected support in pre-election polls and interact this measure with government status. Figure A22 in the online Appendix displays the predicted probabilities from this interaction. The results confirm that the winner–loser gap becomes more pronounced when a party outperforms expectations but still fails to join the governing coalition (H2). This finding highlights the importance of government inclusion beyond mere electoral performance.
Fourth, we assess whether fieldwork timing affects our results. Fieldwork start dates vary across electoral contests. Figure A1 in the online Appendix shows that most studies begin fieldwork within 0–2 months after the election, though some initiate fieldwork much later (up to 36 months post-election). If the winner–loser gap diminishes over time as candidates process electoral outcomes, surveys conducted long after the election might underestimate the gap. Conversely, if the gap reflects stable attitude differences, timing should not affect our estimates. To assess this, we split the sample at the median fieldwork start date (2 months post-election) and re-estimate our main models separately for early and late fieldwork elections. Figure A24 in the online Appendix presents the results. The winner–loser gap remains statistically significant across both subsets for all dependent variables, with no systematic pattern suggesting timing bias. These findings suggest the gap is not driven by temporal distance between the election and survey administration.
Finally, we examine whether our results are sensitive to the operationalisation of collective winning and losing. Government entry is our preferred measure, but alternative operationalisations based on electoral performance exist. To test sensitivity, we re-estimate our main models using two alternative measures: whether the party was the largest by seat share and whether the party was the largest by vote share. These measures correlate highly with each other (r = 0.97) but only moderately with government entry (r ≈ 0.4). Tables A12 to A15 in the online Appendix present the results. The main effects remain substantively similar and statistically significant for most dependent variables, with the exception of the referendum preference item. However, the interaction between individual and collective outcomes is not statistically significant under these alternative operationalisations. This suggests that government entry – not merely electoral winning – drives the interaction in our main results, consistent with our theoretical framework.
Overall, these robustness checks confirm our main findings. Individual losing is associated with lower democratic evaluations (H1a) and lower citizens’ trust perceptions (H1b), with mixed evidence for preferences (H1c). Party government entry is associated with democratic evaluations, citizens’ trust (H2a-b), and preferences for representative democracy (H2c). The individual-level gap is conditioned by party outcomes (H3).
Causal evidence on individual-level outcomes from close races in Iceland
To assess the plausibility that the winner–loser gap identified in our comparative analysis is, at least in part, a causal consequence of electoral outcomes, we provide complementary evidence from Iceland using a regression discontinuity design (RDD). A potential concern with our observational results is that winners and losers may differ on unobservable characteristics that determine their democratic attitudes independently of electoral outcomes. The Icelandic case addresses this concern by leveraging close races where winning a seat is quasi-random for candidates near the electoral threshold. Importantly, the RDD analysis focuses exclusively on the individual level (whether candidates win a parliamentary seat), as the design compares candidates within the same party list, holding party government status constant. It therefore cannot speak to party-level effects or the interaction between individual and collective outcomes, so any causal interpretation beyond this analysis must be made with caution.
We focus on Iceland for three reasons. First, exceptionally high response rates (70.6% in 2013, 65.1% in 2016, and 48% in 2017) provide our best approximation to a population sample within the CCS. Second, Iceland’s proportional electoral system with semi-closed party lists and compensatory seats creates a setting where individual winning among marginal candidates approximates a natural experiment (details in Appendix A9.3). Third, Iceland represents a least-likely case for observing a winner–loser gap: it is a small Nordic democracy (population approximately 330,000) with high democratic quality (Coppedge et al., Reference Coppedge, Gerring, Knutsen, Lindberg, Teorell, Altman, Angiolillo, Bernhard, Cornell, Fish, Fox, Gastaldi, Gjerløw, Glynn, Good God, Grahn, Hicken, Kinzelbach, Marquardt, McMann, Mechkova, Neundorf, Paxton, Pemstein, von Römer, Seim, Sigman, Skaaning, Staton, Sundström, Tannenberg, Tzelgov, Wang, Wiebrecht, Wig and Ziblatt2025), a proportional electoral system, and consensual politics, all conditions associated with smaller winner–loser gaps in the literature (Monsiváis-Carrillo Reference Monsiváis-Carrillo2022; Nadeau, Daoust and Dassonneville Reference Nadeau, Daoust and Dassonneville2023). Moreover, political professionalisation tends to be lower in small states (Paneque Reference Paneque2024), which should weaken the office-utility mechanisms central to our theory. Finding a gap in this setting provides conservative evidence for a causal relationship.
Importantly, the RDD identifies a local average treatment effect (LATE) applicable only to candidates near the winning threshold, which differs from the average treatment effect (ATE) captured in our comparative analysis. Close races may generate stronger emotional reactions than decisive outcomes, and the psychological impact of winning or losing may be most acute among marginal candidates (Senninger, Baekgaard and Seeberg Reference Senninger, Baekgaard and Seeberg2026). To contextualise this, we computed vote-share gaps between the first and second largest parties across our 27 electoral contests (a party-level proxy for electoral competitiveness). Approximately 30% of elections feature gaps of 5 percentage points or less, 41% fall between 5 and 15 points, and 30% exceed 15 points. This suggests that close races, where the mechanisms we theorise should be most salient, characterise a substantial share of our sample. Further discussion of LATE versus ATE and the implications for comparability is provided in Appendix A9.6.
We merged CCS survey data with administrative electoral data from Statistics Iceland across three national elections (2013, 2016, 2017), yielding 1,114 candidate-level observations. Our forcing variable is the distance between each candidate’s position on their party list and the number of seats won by their party in that constituency. We estimate a fuzzy RDD under local randomisation (Cattaneo, Frandsen and Titiunik Reference Cattaneo, Frandsen and Titiunik2014, Cattaneo, Arbor, Titiunik et al. Reference Cattaneo, Arbor, Titiunik and Vazquez-Bare2016), the recommended approach for discrete forcing variables and small samples. The estimated compliance is 96%. The recommended bandwidth includes approximately 160 candidates just below the threshold and 70 just above.
Table 1 presents the RDD results. We find substantial effects consistent with our comparative results. Being elected is associated with a 0.54-point increase (on a 1–5 scale) in the belief that parliament reflects majority interests (p < 0.001), a 0.57-point decrease in perceptions that citizens are losing trust in democracy (p < 0.001), and a 0.38-point increase in support for parliament over voters making final decisions (p < 0.05). The effect on SWD is in the expected direction (0.16 points) but not statistically significant at conventional levels (p > 0.1), though it becomes significant with wider bandwidths (Appendix A9.5), suggesting limited statistical power rather than a null effect. The referendum item shows an effect in the opposite direction (0.3 points, p < 0.1), consistent with the mixed evidence for H1c in our main analysis.Footnote 8
Fuzzy RDD under local randomisation

Table 1. Long description
The table presents the results of a fuzzy RDD under local randomization, showing the effects of being elected on different political perceptions and support. It includes five columns labeled SWD, Majority interest, Citizens’ trust, Parliament, and Referendum, and six rows labeled LATE, First stage, Finite sample p-value, Large sample p-value, Bandwidth, Effective N (left, right), and N. Each row provides specific values for each column, indicating the impact of being elected on various political metrics. For example, being elected is associated with a 0.54-point increase in the belief that parliament reflects majority interests, a 0.57-point decrease in perceptions that citizens are losing trust in democracy, and a 0.38-point increase in support for parliament over voters making final decisions. The effect on SWD is in the expected direction but not statistically significant at conventional levels, though it becomes significant with wider bandwidths. The referendum item shows an effect in the opposite direction, consistent with mixed evidence in the main analysis.
Note: Fuzzy RDD under local randomisation with the recommended window (Cattaneo, Frandsen, Titiunik Reference Cattaneo, Frandsen and Titiunik2014, Cattaneo, Arbor, Titiunik et al. Reference Cattaneo, Arbor, Titiunik and Vazquez-Bare2016). The signs of the estimates are reversed for easier interpretation.
Overall, the Icelandic RDD provides plausible causal evidence that individual-level electoral outcomes shape democratic attitudes, corroborating our observational findings at the individual level (H1a, H1b, and mixed evidence for H1c). Finding a winner–loser gap among candidates whose election is quasi-random strengthens the interpretation that the patterns identified in our comparative analysis reflect, at least in part, the consequences of winning and losing rather than pre-existing differences between winners and losers.
Discussion
Our findings demonstrate that electoral outcomes are systematically associated with politicians’ democratic attitudes. The winner–loser gap, well-established among voters, extends to political elites across multiple indicators and contexts.
At the individual level, candidates who fail to secure parliamentary seats report lower SWD and weaker belief that legislation reflects majority interests (H1a). They also perceive a decline in citizens’ trust in democracy (H1b), consistent with Kingdon’s (Reference Kingdon1967, Reference Kingdon1968) congratulation-rationalisation logic and social projection mechanisms. Evidence regarding democratic preferences is mixed (H1c): individual losing is associated with stronger support for voters over parliament in policy-making, though we find no consistent association with views on referendums.
At the collective level, candidates from parties excluded from government similarly report lower democratic evaluations (H2a) and lower perceptions of citizens’ trust (H2b). In contrast to individual-level results, we find consistent evidence that party government exclusion is associated with stronger preferences for direct over representative democracy (H2c), including both the parliament versus voters’ item and views on referendums. The contrast between individual and collective results for the referendum item may reflect that this question captures specific policy attitudes rather than the abstract principles measured by other indicators. While a non-elected candidate may distrust parliament due to exclusion, if their party holds government office they may prefer to avoid the risk of referendums given their party’s executive position. The interaction analysis supports this interpretation, showing that party government status, not individual election status, is associated with referendum views.
More broadly, the interaction analysis confirms our theoretical expectations. Party-level outcomes condition the association between individual outcomes and democratic attitudes. The individual-level winner–loser gap is most pronounced within winning parties and attenuates or disappears within losing parties (H3). This pattern is consistent across democratic evaluations and perceptions of citizens’ trust. For democratic preferences, party outcomes are associated with institutional preferences, while individual outcomes show no independent association once the interaction is considered. These findings align with our theoretical framework: party government entry provides substantial policy utility and additional office resources, generating gains that dominate individual-level success. Even MPs from opposition parties face constraints in pursuing policy goals, as their legislative influence depends on their party’s bargaining position with the executive. This supports our argument that the winner–loser gap among politicians is rooted in both policy and office considerations, which are asymmetrically affected by individual and collective outcomes and interact in predictable ways.
These main patterns prove robust across multiple specifications and alternative operationalisations. The winner–loser gap remains consistent in ordered logistic regressions, jackknife analyses excluding influential cases, and controls for pre-election expectations. Our causal evidence from Iceland, leveraging a RDD in close races, corroborates the observational findings at the individual level, strengthening the interpretation that electoral outcomes shape democratic attitudes rather than merely reflecting pre-existing differences.
Beyond these core findings, our exploratory analyses reveal interesting variation. The winner–loser gap generalises broadly across macro-regions, though it is consistent in Western, Southern, and Eastern Europe while weaker in Northern Europe and Switzerland, potentially reflecting variation in democratic quality. Across party types, the gap in democratic evaluations and trust perceptions operates similarly for mainstream and radical parties, with some suggestion of larger gaps among far-left and far-right candidates. Notably, the gap in democratic preferences appears among mainstream parties but disappears among radical parties, potentially reflecting populist orientations that shape institutional preferences independently of electoral outcomes.
Our findings connect with the extensive voter-level literature through SWD, the most established indicator in winner–loser gap research. However, we also demonstrate that the gap extends beyond satisfaction to other democratic attitudes, including perceptions of citizens’ trust and democratic preferences. This breadth aligns with recent trends in the literature to move beyond SWD as the sole indicator (Allinger Reference Allinger2024; Anderson and LoTempio Reference Anderson and LoTempio2002; Böhringer and Boucher Reference Böhringer and Boucher2024), showing that the winner–loser gap operates across multiple dimensions of democratic attitudes among politicians, not only evaluations of regime performance.
What do these findings mean for democratic stability? Our results reveal that politicians’ democratic attitudes are, like voters’, contingent on electoral fortunes rather than grounded in unconditional normative commitments. While most politicians maintain broadly positive democratic attitudes overall, our threshold analysis reveals important nuance. Negative evaluations concentrate among a minority of radical party losers rather than being evenly distributed. Among mainstream party candidates, 64% of individual losers report positive SWD compared to 75% of winners. Among far-left and far-right candidates, these proportions drop substantially: 43% and 52% of losers report positive satisfaction, compared to 31% and 71% of winners.
However, this does not necessarily signal a democratic threat. Politicians on both sides of the winner–loser divide maintain broadly positive evaluations, most losers remain above critical thresholds of dissatisfaction, and some preferences, such as for direct democracy, are not inherently anti-democratic. The malleability we document does not automatically translate into anti-democratic behaviour. Behavioural implications are context-dependent and negative downstream effects likely require additional triggering conditions, perhaps institutional crises, sustained exclusion from power, or, most notably, authoritarian leadership.
With these considerations in mind, the focus on rank-and-file politicians offers a new angle on the democratic backsliding literature. Following episodes of unrest after electoral defeats in the US (2021) and Brazil (2022), considerable attention has focused on authoritarian-oriented leaders. However, the role of ordinary politicians in these episodes remains understudied. We show that politicians’ democratic attitudes shift with electoral fortunes, complementing evidence that their assessments of electoral fairness are also contingent on winner–loser status (Kuipers Reference Kuipers2025; Schnaudt Reference Schnaudt2023; Senninger, Baekgaard and Seeberg Reference Senninger, Baekgaard and Seeberg2026). Yet the downstream behavioural implications of these shifts likely depend on the organisational hierarchies of parties and the actions of party leaders. Understanding the conditions under which rank-and-file politicians enable or resist leader-driven challenges to democratic norms after electoral defeat is an open question which, in our view, offers a particularly critical avenue for future research.
Conclusion
Do electoral outcomes shape politicians’ democratic attitudes? We provide both theoretical and empirical evidence that they do. Theoretically, we distinguish between individual and collective electoral outcomes and theorise their asymmetric interaction. Empirically, using 27 elections across 15 countries, we find that losers at both levels report lower democratic evaluations and perceptions of citizens’ trust, with party outcomes dominating and conditioning individual-level effects. Complementary causal evidence from Iceland corroborates these findings at the individual level.
Future research should pursue several directions. First, longitudinal designs with pre- and post-election measures would clarify the dynamic origins of the winner–loser gap among politicians and distinguish between winners’ gains and losers’ losses, uncovering potential asymmetries. While some efforts are underway (Kuipers Reference Kuipers2025), more case studies and comparative efforts are needed. Second, qualitative studies and original survey items could uncover the mechanisms through which electoral outcomes shape democratic attitudes, examining whether policy utility, office utility, or affective and cognitive processes dominate. Third, and most critically, research must identify when and how attitudinal shifts translate into anti-democratic behaviour. Our findings reveal that democratic attitudes among politicians are contingent on their winner–loser status. Understanding this contingency and its behavioural implications might shed light on pathways to maintain democratic stability in an era of elite-driven backsliding.
Supplementary material
The supplementary material for this article can be found at https://doi.org/10.1017/S1475676526101662
Data availability statement
The cumulative CCS datasets are proprietary data available on the online data repository SWISSU base. Electoral official data about Iceland is publicly available at Statistics Iceland. The code to homogenise the data and get the final variables used in the analysis, together with the replication code for the analysis, is available on Harvard Dataverse at https://dataverse.harvard.edu/dataset.xhtml?persistentId=doi:10.7910/DVN/2ANGID.
Acknowledgements
We thank the anonymous reviewers and the editors of EJPR. We also thank Aina Gallego, Alba Huidobro, Albert Falcó-Gimeno, Ignacio Lago, Roman Senninger, and Madeleine Siegel for their comments and insights. We also thank the participants at EPSA 2024, the Current Directions in Research on Political Support Conference at the University of Duisburg-Essen, and JCPOP Barcelona 2024 for their feedback on earlier versions of this manuscript. All remaining errors and omissions are our own.
Funding statement
The author(s) received no financial support for the research, authorship, and/or publication of this article.
Competing interests
The authors declared no potential conflicts of interest with respect to the research, authorship, and/or publication of this article.
Ethical considerations
Ethical approval was not required for conducting this study.
Consent to participate
Not applicable.


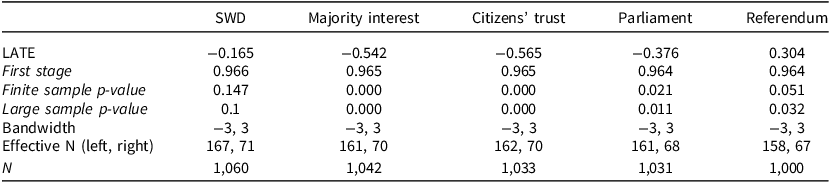


 Open access

