


Introduction
Cover crops can provide many agroecosystem benefits such as reducing soil erosion, increasing soil organic matter, and increasing nitrogen and water use efficiency in subsequent crops (Burket et al. Reference Burket, Hemphill and Dick1997; Dabney et al. Reference Dabney, Delgado and Reeves2001). Cover crop species are selected to fulfill a specific need, and each species will inherently have different benefits and characteristics based on its growth habit and functional traits. For example, forage radish (Raphanus sativus L.) roots can grow through compacted soils and provide channels for subsequent crop roots to grow deeper (Chen and Weil Reference Chen and Weil2010; Williams and Weil 2004). Cereal rye (Secale cereale L.), in addition to high biomass accumulation, also has allelopathic compounds, specifically benzoxazinoids, which inhibit plant growth and may be especially useful in organic weed management (Schulz et al. Reference Schulz, Marocco, Tabaglio, Macias and Molinillo2013). Legumes, such as crimson clover (Trifolium incarnatum L.) and hairy vetch (Vicia villosa Roth), can contribute nitrogen to subsequent cash crops (Coombs et al. Reference Coombs, Lauzon, Deen and Van Eerd2017; Ranells and Wagger Reference Ranells and Wagger1996). Mixes of different species can reap multiple benefits and can lead to an increase in biomass accumulation compared with monocultures (Finney et al. Reference Finney, White and Kaye2016; Sainju et al. Reference Sainju, Whitehead and Singh2005).
Another potential benefit of cover crops is suppression of weeds. Weeds can cause up to 50% yield loss in both corn (Zea mays L.) and soybean [Glycine max (L.) Merr.] production (Soltani et al. Reference Soltani, Dille, Burke, Everman, VanGessel, Davis and Sikkema2016, Reference Soltani, Dille, Burke, Everman, VanGessel, Davis and Sikkema2017). There are two main periods of weed suppression offered by cover crops: the first, while the cover crop is actively growing; the second, which is the focus herein, is after the cover crop is terminated and the residue creates a mulch layer on the soil surface (Hayden et al. Reference Hayden, Brainard, Henshaw and Ngouajio2012; Mirsky et al. Reference Mirsky, Ryan, Teasdale, Curran, Reberg-Horton, Spargo, Wells, Keene and Moyer2013). This mulch layer reduces the quantity and quality of sunlight that reaches the soil surface, lowers soil temperature, and provides a physical barrier for weed seedlings (Mirsky et al. Reference Mirsky, Ryan, Teasdale, Curran, Reberg-Horton, Spargo, Wells, Keene and Moyer2013; Mohler and Teasdale Reference Mohler and Teasdale1993; Teasdale and Mohler Reference Teasdale and Mohler2000). It can result in the delayed germination of weed seeds (Bhowmik and Bekech Reference Bhowmik and Bekech1993). In general, more biomass will create a thicker mulch layer that results in greater weed suppression (Finney et al. Reference Finney, White and Kaye2016; Mohler and Teasdale Reference Mohler and Teasdale1993). However, as the cover crop residue degrades, the mulch layer becomes thinner, and weed-suppression effects diminish (Mohler and Teasdale Reference Mohler and Teasdale1993).
At termination, the cover crop residue begins to degrade, the rate of which depends on climate, residue chemistry, and soil microorganisms among other factors (Lavelle et al. Reference Lavelle, Blanchart, Martin, Martin and Spain1993; Swift et al. Reference Swift, Heal and Anderson1979). When determining mass-loss relationships of residue, most patterns for decay correlate to the initial ratios of carbon to nitrogen (C:N), lignin to nitrogen, or lignin to cellulose (Aerts Reference Aerts1997; Hobbie Reference Hobbie2008; Melillo et al. Reference Melillo, Aber and Muratore1982). Nitrogen and phosphorus are degradation rate-enhancing factors, while lignin is thought of as a rate-retarding compound (Fogel and Cromack Reference Fogel and Cromack1977). Nitrogen-rich environments allow the carbon contained in the residue to break down more rapidly, while lignin and other carbon compounds protect the more easily broken-down components within the cell walls, slowing degradation (Berg and McClaugherty Reference Berg and McClaugherty2003).
Cover crop species vary in their ability to accumulate biomass and have inherent ranges for quality traits like carbon-to-nitrogen (C:N) ratios and lignin, cellulose, and hemicellulose content, suggesting they may vary in residue decomposition rate and thus weed suppression (Clark Reference Clark2012). Research indicates that biomass and C:N ratios have a positive relationship with weed suppression and nitrogen retention, respectively, during the cover crop growing season. However, high C:N ratios of cover crop residue have been found to have a negative impact on corn yield (Finney et al. Reference Finney, White and Kaye2016; Marcillo and Miguez Reference Marcillo and Miguez2017). Cover crop residue with high C:N ratios (i.e., >25:1) can lead to nitrogen immobilization and impact weed and crop growth (Burgess et al. Reference Burgess, Mehuys and Madramootoo2002; Havlin et al. Reference Havlin, Beaton, Tisdale and Nelson2005; Iritani and Arnold Reference Iritani and Arnold1960).
While research has shown that cover crop biomass has a direct impact on weed suppression, stating that consistent suppression (>75%) of annual weeds can be achieved when biomass residue rates exceed 8,000 kg ha−1, less is known about how cover crop residue quality impacts weed suppression (Mirsky et al. Reference Mirsky, Ryan, Teasdale, Curran, Reberg-Horton, Spargo, Wells, Keene and Moyer2013; Teasdale and Mohler Reference Teasdale and Mohler2000). There is evidence that a high C:N ratio plays a role in weed suppression by slowing down residue degradation, but little evidence is available as to the threshold of C:N ratio needed to suppress weeds but not interfere with cash crop yield. The objectives of this study were to (1) identify relationships between weed suppression and cover crop quantity and/or quality after cover crop termination, and (2) determine the impact of cover crop biomass and C:N ratio on cash crop yield.
Materials and Methods
Study Sites
Field experiments were conducted in Blacksburg, VA, at Kentland Farms (37.19°N, 80.57°W) in a Ross loam (fine-loamy, mixed, superactive, mesic Cumulic Hapludolls) and Blackstone, VA, at the Southern Piedmont Agricultural and Research Extension Center (37.08°N, 77.97°W) in a Durham coarse sandy loam (fine-loamy, siliceous, semiactive, thermic Typic Hapludults). Studies were conducted in 2015 to 2016 and 2016 to 2017 at both locations for a total of 4 site-years. Rainfall accumulation for cover crop and cash crop growing seasons are shown in Supplementary Figure 1 for each site-year.
Experimental Design
Experiments were arranged as a split-split block experiment with four replications. The main treatment, implemented as a randomized complete block design, was cover crop monoculture or mixture. These large plots were split at cover crop termination by cash crop, which was either corn or soybean. The cash crop blocks were then split again and maintained as weedy or weed-free subblocks after cover crop termination through the duration of the experiment. Area of the main cover crop treatment plot was 46.4 m2, cash crop blocks were 23.2 m2, and weedy/weed-free subblocks were 11.6 m2.
Treatments
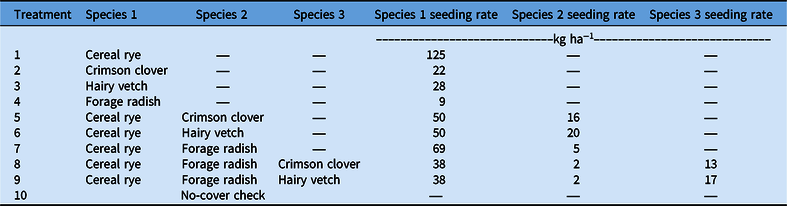
The experiment had nine cover crop treatments and a no-cover check. Cover crop treatments consisted of monocultures of cereal rye, hairy vetch, crimson clover, forage radish and two- and three-way mixtures of these four cover crop species. Treatments were selected to provide a range of both cover crop quantity (biomass) and quality (residue properties). Mixtures and seeding rates are listed in Table 1. Seeds were purchased from Green Cover Seeds (Bladen, NE), and varieties are as listed: cereal rye (‘Elbon South’), forage radish (‘Nitroradish’), hairy vetch (‘TNT’), and crimson clover (‘Dixie’). Seeding rates are on the high end of the recommended range suggested by the Virginia Natural Resources Conservation Service (Anonymous 2015).
Species composition and seeding rate of cover crop monocultures and mixtures used in Blacksburg and Blackstone, Virginia in 2015–2016 and 2016–2017.
Plot Maintenance and Data Collection
The Blacksburg location was previously in corn and was planted no-till, while the Blackstone field was previously in sod and was prepared for planting by disking the area to create a seedbed for planting. Both sites received a preplant application of glyphosate (Roundup PowerMax®, Monsanto, St Louis, MO) at 1.26 kg ae ha−1 2 wk before cover crop planting. Cover crops were drilled in late September to mid-October (Table 2).
Dates for cover crop and cash crop planting, termination, and harvest for both locations and both years of these experiments.
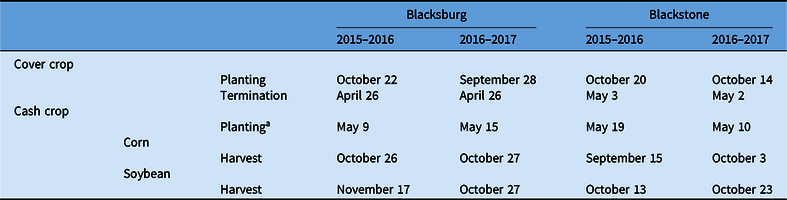
a Planting dates were the same for both corn and soybean in both years and at both locations.
Cover crops were terminated in late April through early May (Table 2) using a roller crimper followed by glyphosate applied at 1.26 kg ae ha−1. Before termination, aboveground biomass was randomly sampled from a 0.09-m2 area, separated into individual cover crop species, and dried and weighed for mass determination. Cover crop samples were then coarsely ground, homogenized, and subsequently analyzed for carbon, nitrogen, lignin, cellulose, and hemicellulose content (Feed and Water Analysis Lab, University of Georgia, Athens, GA). For two- and three-way cover crop species mixtures, carbon, nitrogen, lignin, cellulose, and hemicellulose content were determined by using the mass of each species in the sample to calculate a weighted average for the whole sample.
Corn and soybeans were planted approximately 2 wk after termination (WAT) (Table 2). The cash crops were planted on 76-cm rows with four rows of cash crop per plot. Corn, variety P1197AM (DuPont Pioneer, Johnston, IA) in 2016 and variety DKC62-08 (DeKalb, DeKalb, IL) in 2017, was planted at 61,780 seeds ha−1. Soybean, variety P46T21R (DuPont Pioneer) in 2016 and variety AG48X7 (Asgrow, Kalamazoo, MI) in 2017, was planted at 327,410 seeds ha−1. Both corn and soybean blocks received 225 kg ha−1 of 0-25-25 at planting. Corn blocks received a total of 293 kg ha−1 of 46-0-0, with half applied at planting and the other half applied when corn reached V4.
At planting, the blocks were also split into subblocks by weed management. The weedy subblock had no additional weed control measures beyond the cover crop treatments, and the weed-free subblocks were maintained weed-free throughout the cash crop season. This design allowed us to draw conclusions about the impact of cover crops on weed suppression from the weedy subblocks and on corn and soybean yield from the weed-free subblocks. To control weeds in the weed-free subblocks, PRE herbicides were applied at planting. Atrazine at 1.48 kg ai ha−1 + S-metolachlor at 1.43 kg ai ha−1 + mesotrione at 0.19 kg ai ha−1 (Lexar® EZ, Syngenta Crop Protection, Greensboro, NC) were applied in corn, and sulfentrazone at 0.305 kg ai ha−1 + chlorimuron-ethyl at 0.038 kg ai ha−1 (Authority® XL, FMC, Philadelphia, PA) were applied in soybean. Both corn and soybean weed-free blocks were maintained weed-free with glyphosate (Roundup PowerMax®, Monsanto) at 1.26 kg ae ha−1 applied POST throughout the season as needed whenever weeds reached 10 cm in height.
After cash crop planting, visible weed-suppression ratings were taken every 2 wk until the cover crops no longer suppressed weeds as compared with the no-cover crop check. Suppression was assessed on a scale of 0 to 100, with 0 being no reduction in weed density or size and 100 being no weeds present compared with the no-cover crop check (Frans et al. Reference Frans, Talbert, Marx, Crowley and Camper1986).
The middle two rows of the cash crop were harvested for yield. Harvest dates for corn ranged from mid-September to late October across all site-years. Soybean was harvested from mid-October to mid-November (Table 2). Harvest weights were adjusted to 15.5% moisture for corn and 13% for soybean.
Statistical Analysis
Cover crop carbon, nitrogen, cellulose, hemicellulose, lignin, C:N ratio, and biomass are presented by means and SEs by the cover crop treatments, including monocultures and mixtures. Biomass was chosen as a predictive value, as it is known to affect weed suppression (Liebert et al. Reference Liebert, DiTommaso and Ryan2017; Teasdale and Mohler Reference Teasdale and Mohler2000). To determine the most predictive value affecting weed suppression, Pearson’s correlation coefficients between the remaining residue components and ratios (total carbon, total nitrogen, lignin, cellulose, hemicellulose, C:N, and lignin:N) were used to determine which residue components would be used for further analysis. Based on this analysis, all cover crop quality metrics were not highly correlated (≤0.5) with biomass. Ultimately, C:N ratio was chosen as the quality predictor of weed suppression, because it encompassed some of the quality metrics (highly correlated, >0.6, with cellulose, hemicellulose, and nitrogen) and would be a predictive value that can impact management practices, as the C:N ratio of various cover crop species is more well known than the other quality metrics listed.
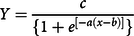
Visible weed-suppression ratings at 4, 6, and 8 WAT were analyzed by weed species present, which were redroot pigweed (Amaranthus retroflexus L.), pitted morningglory (Ipomoea lacunosa L.), and large crabgrass [Digitaria sanguinalis (L.) Scop.] with the no-cover check removed in all analyses. Amaranthus retroflexus and I. lacunosa were only present in Blacksburg, so there are 2 site-years of data for these species, while D. sanguinalis was present in all 4 site-years. Data were first analyzed by ANOVA using a general linear model that included fixed effects of block, year, cash crop (corn or soybean), cover crop treatment, and interactions of year and cash crop with treatment. Location and an interaction term including location and cover crop treatment were included in the D. sanguinalis analysis. Data were then plotted by biomass or C:N ratio for each rating timing. Three-parameter logistic curves:
 $$ Y = {c \over {\{ {1 + {e^{[{ - a\left( {x - b} \right)}]}}} \}}} $$
where c is the upper asymptote, a is the growth rate, and b is the inflection point, were fit to these data to estimate 50% suppression, which is used as the benchmark to compare across rating dates, as the upper asymptote does not always reach an acceptable level of weed suppression, 80% (Seefeldt et al. Reference Seefeldt, Jensen and Fuerst1995). In instances where the model was not significant, just the raw data are plotted.
Yield data were analyzed by cash crop and by weed management subblocks. The data from the weedy subblocks were used to determine the impact of the cover crop on weed suppression and how that affects crop yield. The yield data from the weed-free subblocks were used to determine the impact of cover crops on cash crop yield. As in the previous analysis, data were first analyzed using ANOVA with a general linear model that included fixed effects of block, location, year, cover crop treatment, and interactions of location and year with cover crop treatment. These yield data were also plotted against cover crop biomass and C:N ratio and fit to a linear model. All analyses were performed using JMP (JMP Pro v. 14, SAS Institute, Cary, NC).
Results and Discussion
Cover Crop Biomass and Residue Components
Biomass ranged from 3,660 to 8,750 kg ha−1, with cereal rye and cereal rye–containing mixtures accumulating more biomass than crimson clover or hairy vetch alone (Table 3). In general, the cover crop mixtures had greater biomass than the monocultures.
Cover crop residue components, C:N ratio, and biomass shown by treatment in Blacksburg and Blackstone, VA, in 2016 and 2017, presented as mean ± SE.

a Data were pooled across location and year. Forage radish in monoculture is not included, as it winterkilled.
b C:N, carbon-to-nitrogen.
Cereal rye alone had greater cellulose and hemicellulose content and a lower nitrogen content compared with any of the other treatments (Table 3). Forage radish winterkilled in most treatments and did not contribute much residue to the biomass or quality analysis. For example, the values for cereal rye in monoculture compared with the cereal rye and forage radish mixture are very similar across residue quality metrics. Hairy vetch and crimson clover had the lowest carbon content and greatest nitrogen content, while cover crop mixtures fell between the legumes and cereal rye alone (Table 3).
The C:N ratio of cereal rye alone and the cereal rye and forage radish mixture were greater than all other treatments at 36:1 (Table 3). Hairy vetch and crimson clover had C:N ratios of 12:1 and 17:1, respectively, which were the lowest of the cover crop treatments. The C:N ratio of the cover crop mixtures was moderated by containing both cereal rye and either of the legume species, ranging between 24:1 and 28:1.
The biomass and C:N ratios found in this experiment are similar to those found by Sainju et al. (Reference Sainju, Whitehead and Singh2005) and Finney et al. (Reference Finney, White and Kaye2016) in Georgia and Pennsylvania, respectively, with biomasses ranging from 2,000 to 8,000 kg ha−1 for monocultures and mixtures like those studied in this experiment. The C:N ratios also align with those seen in this experiment ranging from 10:1 to 57:1, with legumes having lower C:N ratios than grasses, and mixtures of the two falling in between (Finney et al. Reference Finney, White and Kaye2016; Sainju et al. Reference Sainju, Whitehead and Singh2005).
Weed Suppression
There were three dominant weed species that were present in more than 1 site-year of this study and across multiple rating dates: A. retroflexus, I. lacunosa, and D. sanguinalis. There was no interaction (P > 0.05) between cash crop (corn or soybean) and cover crop treatment at any rating date for any weed species, so data were pooled across cash crop.
The differences in stature, resource use, and fertility management between the two cash crop species (corn and soybean) could have led to differing results of weed suppression. Corn received a split application of nitrogen, while soybean did not receive any nitrogen. The additional nitrogen in corn could have reduced any nitrogen limitations on soil microbes, causing them to break down the cover crops more quickly and leading to decreased weed suppression earlier in the season compared with soybean (Poffenbarger et al. Reference Poffenbarger, Mirsky, Weil, Kramer, Spargo and Cavigelli2015). Conversely, the upright stature and fast growth of corn can in some cases lead to quicker canopy closure and increase weed suppression. However, this was not the case in this experiment, as cash crop was not significant at any rating point for any of the weed species. In our experiments, corn and soybean were planted at the same time, which is not always the case in the mid-Atlantic region. Some growers will plant corn earlier than soybean, which could impact weeds’ germination and growth.
Cover crop treatment was significant for visible weed suppression for each weed species at every rating timing (4, 6, and 8 WAT) (P < 0.001). Cover crop biomass has long been studied in relation to weed suppression, but it might not be the only important factor. More recently, cover crop quality, as well as quantity, has been found to play an important role in weed suppression (Finney et al. Reference Finney, White and Kaye2016; Mohler and Teasdale Reference Mohler and Teasdale1993). Using a Pearson’s correlation coefficient, biomass and C:N ratio were slightly positively correlated (0.32). Also, as biomass accumulation potential and approximate C:N ratios are more well known for cover crop species, reporting these characteristics will make these conclusions more applicable to growers’ management decisions.
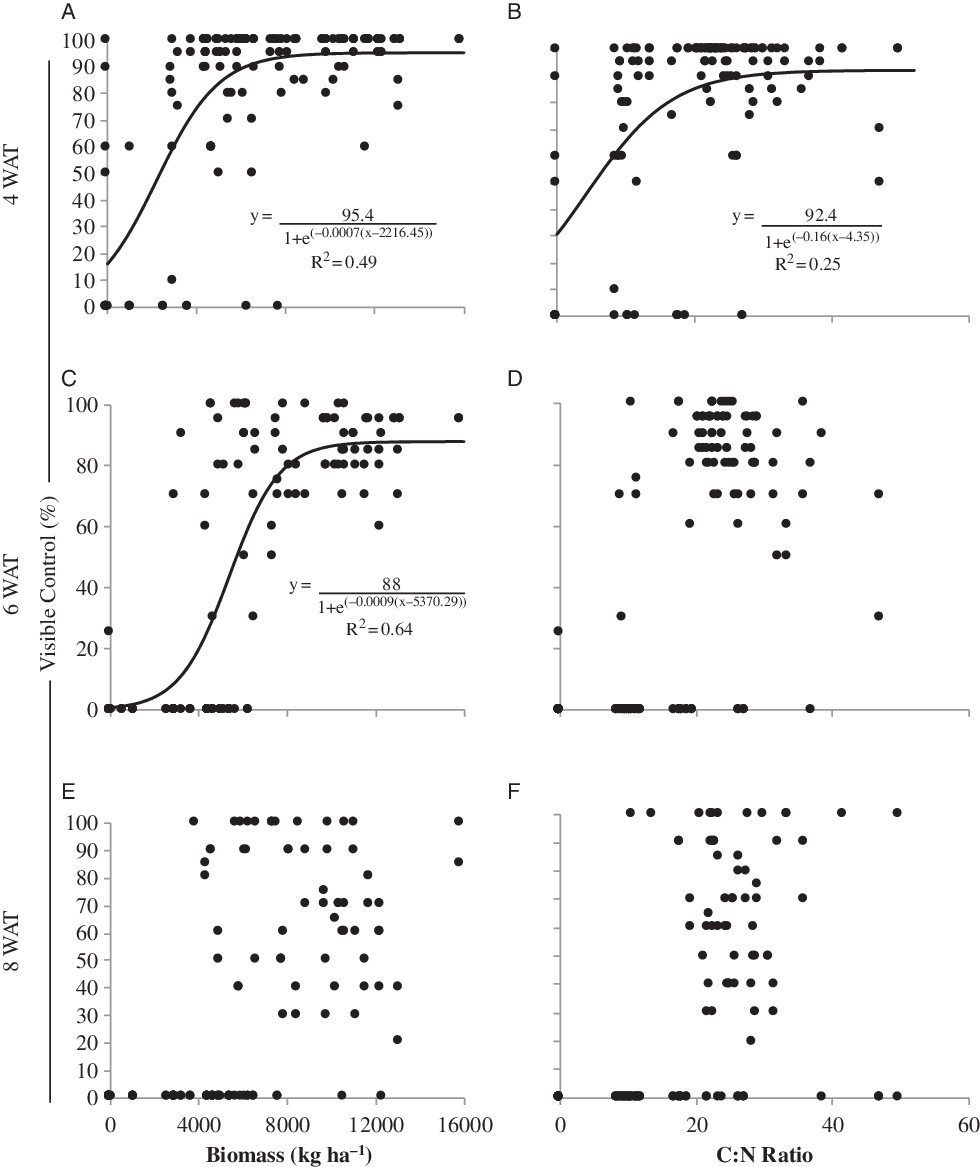
Amaranthus retroflexus was present in Blacksburg in 2016 and 2017. There were relationships at every rating date between A. retroflexus suppression and both biomass and C:N ratio (Figure 1). As the season progresses, the inflection point of both biomass and C:N ratio increases, meaning that greater biomass and a higher C:N ratio are needed at time of termination to continue to suppress weeds later into the cash crop growing season. Based on the logistic curve, 2,800 kg ha−1 biomass is needed at the time of termination to suppress A. retroflexus 50% at 4 WAT and increases to 5,280 kg ha−1 and 6,610 kg ha−1 at the time of termination to provide 50% suppression at 6 and 8 WAT, respectively. The same trend is seen with C:N ratio. For 50% weed suppression at 4 WAT, a C:N ratio of 9:1 is needed at cover crop termination. Greater C:N ratios of 16:1 and 20:1 are needed to provide 50% weed suppression at 6 and 8 WAT, respectively.
Relationships between cover crop biomass and carbon-to-nitrogen (C:N) ratio to visible Amaranthus retroflexus suppression at 4, 6, and 8 wk after termination (WAT). Amaranthus retroflexus was only present in Blacksburg, VA. Points are data from both 2016 and 2017 and include all treatments (Table 1), with the exception of the no-cover check. Regression lines are three-parameter logistic curves, presented when significant (P < 0.05).
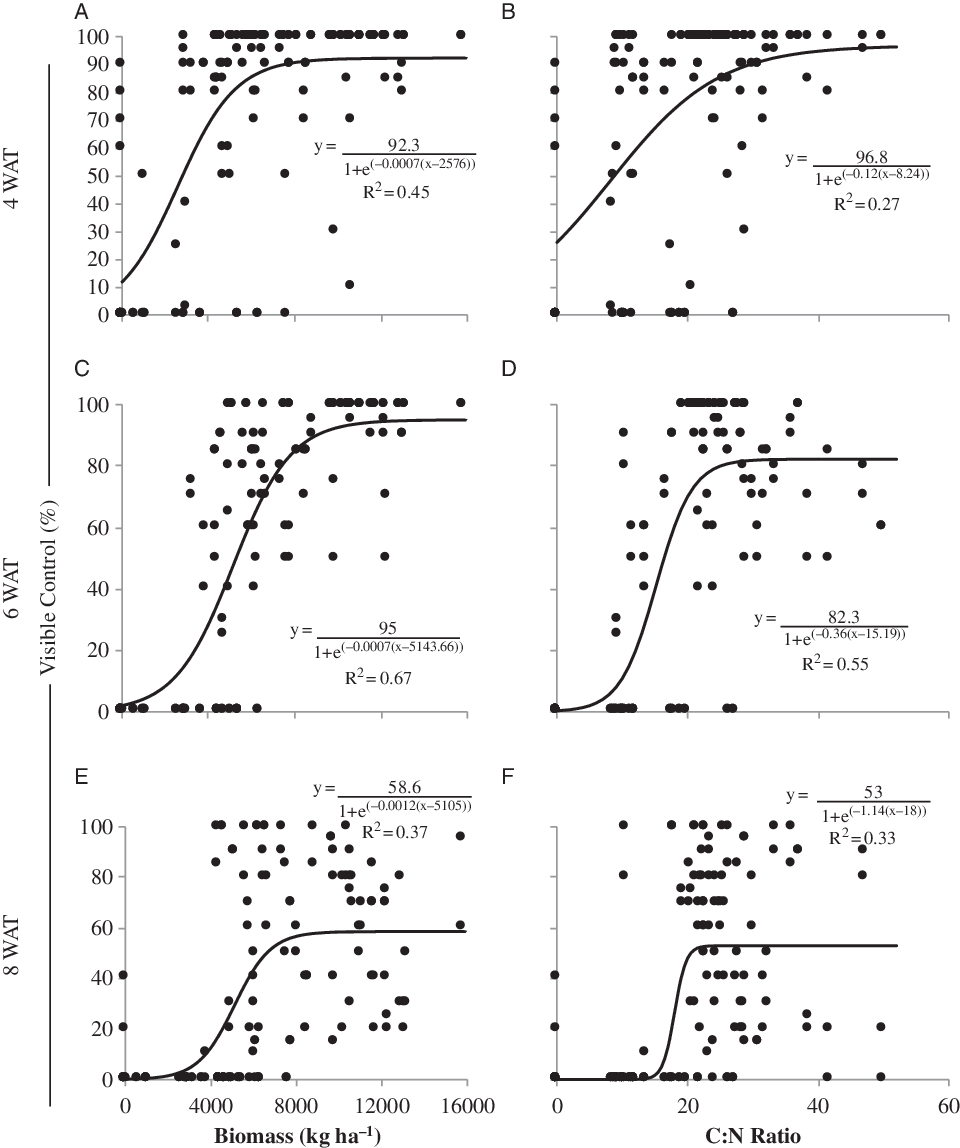
To achieve 80% weed suppression of A. retroflexus at 6 WAT, which was 4 wk after cash crop planting in our study and is typically when a POST herbicide application is needed, the cover crops would need to produce 7,390 kg ha−1 of biomass and have a C:N ratio of 25:1 at the time of termination (Figure 1). Several treatments in our experiments met or exceeded that biomass and C:N ratio, such as cereal rye and all cereal rye–containing mixtures, excluding the three-way mixture of hairy vetch, forage radish, and cereal rye (Table 3).
Ipomoea lacunosa, like A. retroflexus, was only present in Blacksburg. To achieve 50% suppression at 4 WAT, 2,350 kg ha−1 of cover crop biomass is needed by termination. This amount increases to 5,680 kg ha−1 at termination for 50% I. lacunosa suppression at 6 WAT. Based on the logistic curve, a C:N ratio of 5:1 is needed for 50% weed suppression of I. lacunosa at 4 WAT. For I. lacunosa, no relationship could be determined between C:N ratio and visible weed suppression beyond 4 WAT and cover crop biomass beyond 6 WAT (Figure 2). The lack of relationship noted at 6 and 8 WAT indicates that I. lacunosa suppression may not be achievable with cover crops, regardless of quantity and quality for this duration. Teasdale and Mohler (Reference Teasdale and Mohler2000) have shown that plants that have larger seeds, such as I. lacunosa, are less impacted by cover crops. This is attributed to the ability of large-seeded species to emerge through the mulch layer and a decrease in the light requirement needed to germinate (Teasdale and Mohler Reference Teasdale and Mohler2000). Milberg et al. (Reference Milberg, Andersson and Thompson2000) reported that the requirement for light to germinate is less likely as seed mass increases.
Relationships between cover crop biomass and carbon-to-nitrogen (C:N) ratio to visible Ipomoea lacunosa suppression at 4, 6, and 8 wk after termination (WAT). Ipomoea lacunosa was only present in Blacksburg, VA. Points are data from 2016 and 2017 and include all treatments (Table 1), with the exception of the no-cover check. Regression lines are three-parameter logistic curves, presented when significant (P < 0.05).
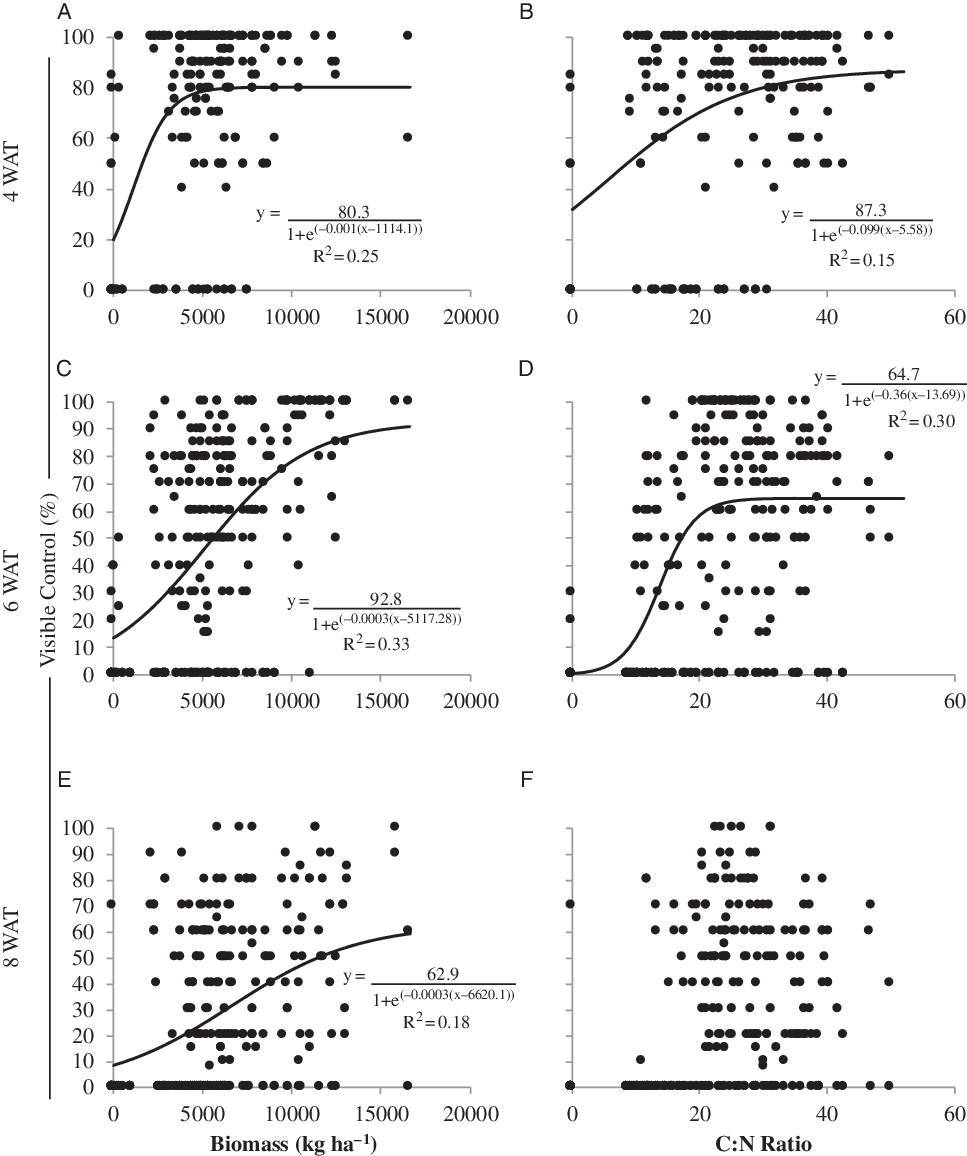
Digitaria sanguinalis was present in both Blacksburg and Blackstone across both years of the study for a total of 4 site-years of data. Based on the logistic models, to suppress D. sanguinalis, 1,620 kg ha−1, 5,570 kg ha−1, and 11,440 kg ha−1 of biomass is needed at termination to achieve 50% suppression at 4, 6, and 8 WAT, respectively (Figure 3). None of the cover crop treatments in our study consistently achieved greater than 9,000 kg ha−1 of biomass on average, so the suppression noted at 8 WAT would not be achievable with the study treatments. To achieve 80% weed suppression at 6 WAT, 10,420 kg ha−1 of biomass is needed, which is also out of the average range achieved in this study. As for C:N ratio, the trend for D. sanguinalis is very similar to that of A. retroflexus. For 50% suppression of D. sanguinalis at 4 WAT, a C:N ratio of 9:1 is needed, and that increases to 17:1 at 6 WAT. No relationship could be detected between C:N ratio and visible weed suppression at 8 WAT. Similar to I. lacunosa, this result indicates that cover crops are likely not suitable for season-long suppression of D. sanguinalis.
Relationships between cover crop biomass and carbon-to-nitrogen (C:N) ratio to visible Digitaria sanguinalis suppression at 4, 6, and 8 wk after termination (WAT) in field experiments in Blacksburg and Blackstone, VA, in 2016 and 2017. Points are data from all 4 site-years and treatments (Table 1), with the exception of the nontreated check. Regression lines are three-parameter logistic curves, presented when significant (P < 0.05).
We see that greater initial biomass and an increased initial C:N ratio at time of termination of cover crop are needed as time progresses throughout the cash crop growing season to suppress all three weed species in this study. In some instances, relationships could not be determined between the cover crop predictors and weed suppression later in the season. This is likely due to reduced control and variability in control as the cover crop residue degrades. Using initial biomass and C:N ratio to predict weed suppression into the cropping season, across time, we are not able to include degradation of those cover crops over time and how that affects weed suppression. The rate of cover crop residue decomposition is driven by residue components, environmental conditions, and soil microbes, which could not be kept standard across locations and years and would never be standard in field settings (Lavelle et al. Reference Lavelle, Blanchart, Martin, Martin and Spain1993; Swift et al. Reference Swift, Heal and Anderson1979).
Overall trends show that cover crops can suppress weeds, which is consistent with previous research. Mohler and Teasdale (Reference Mohler and Teasdale1993) reported overall similar suppression from cereal rye and hairy vetch, but cereal rye was able to suppress weeds for longer compared with hairy vetch. The hairy vetch cover crop decomposed more quickly than the rye, allowing for greater weed emergence later in the cash crop growing season. However, our models did not incorporate degradation rates of the various cover crops and mixtures. There was greater variability in the relationships between the cover crop predictors and weed suppression, especially at 8 WAT for all weed species. As our goal was to determine an initial threshold of biomass and C:N ratio needed to reach an acceptable level of weed suppression regardless of cover crop composition, samples were not taken after termination. In future research, samples taken throughout the cover crop season might be better able to explain these relationships.
Corn and Soybean Yield
In the weedy subblocks, which relied solely on cover crops for weed suppression, treatment was not significant for soybean yield but was significant for corn yield (P < 0.001). The lack of difference seen in the soybean yield, which averaged 790 ± 51 kg ha−1 across all 4 site-years could be due to the difference in critical weed-free period (CWFP), the minimum weed-free period starting at planting until unacceptable yield loss begins to occur, between the two crops (Knezevic et al. Reference Knezevic, Evans, Blankenship, Van Acker and Lindquist2002). The CWFP for corn ends earlier in the cropping season, around the V14 growth stage (Gantoli et al. Reference Gantoli, Ayala and Gerhards2013; Hall et al. Reference Hall, Swanton and Anderson1992), compared with soybean, for which the CWFP ends at R3 (Mulugeta and Boerboom Reference Mulugeta and Boerboom2000; Van Acker et al. Reference Van Acker, Swanton and Weise1993). Weed suppression from cover crops declined from 4 to 8 WAT, resulting in weed competition increasing as the season progressed (Figures 1–3). The difference in the timing of CWFP between crops led us to believe that weeds competed with soybean during the CWFP, as the weed suppression afforded by the cover crop treatments had diminished by this point in the season. We did not track the growth stages of corn and soybean throughout the study to know exactly when the stages mentioned above occurred. Knowing when these growth stages occurred along with the level of weed suppression would be needed to corroborate this postulate.
There was a significant interaction between location and treatment (P = 0.013) for the corn yield in weedy subblocks. No differences could be detected across treatments at Blackstone (Supplementary Figure 2). In Blacksburg, separation can be found between treatments that reflect results from the visible weed-suppression data. Yields were greater in the cereal rye and two-way mixtures containing cereal rye compared with the no-cover check. This trend is due to increased weed suppression from these cover crop treatments, and those weeds are not competing with corn and decreasing yield.
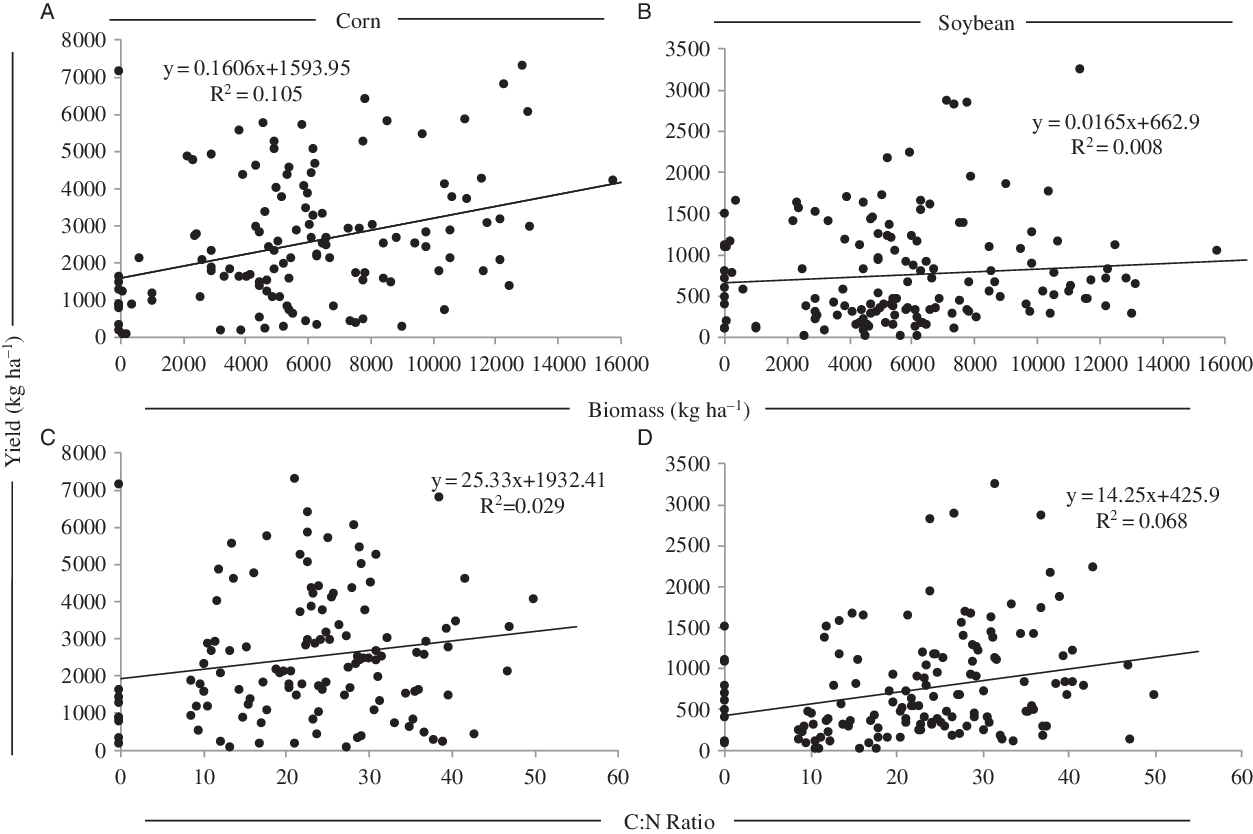
There is a positive relationship between corn and soybean yield with initial cover crop biomass and C:N ratio in the weedy subblocks (Figure 4). This supports the trend found in the visible weed control, that as biomass and C:N ratio at time of termination increase, weed suppression later in the season increases.
Relationship between cover crop biomass and carbon-to-nitrogen (C:N) ratio from the subblocks where no additional weed management tactics were used beyond the cover crop treatment and corn (left column) and soybean (right column) yield. Points are data from all 4 site-years (Blacksburg and Blackstone, VA, in 2016 and 2017) and all treatments (Table 1), excluding the no-cover check.
Overall, yield was greater in weed-free subblocks compared with the weedy subblocks, due to lack of competition from weeds. Cover crop treatment was not significant in the weed-free subblocks for both corn and soybean yield, showing that there was no impact on cash crop yield from the cover crops used in this study (P = 0.16 and P = 0.66 for corn and soybean yield, respectively). Previous research indicates winter cover crops can have variable effects on corn yield, being neutral or increasing yield (Marcillo and Miguez Reference Marcillo and Miguez2017). In particular, cover crops with high C:N ratios may have a negative impact on corn yield due to nitrogen immobilization (Finney et al. Reference Finney, White and Kaye2016; Hunter et al. Reference Hunter, Schipanski, Burgess, LaChance, Bradley, Barbercheck, Kaye and Mortensen2019). In soybean production, cover crops have not shown a yield penalty, which matches the results found in this experiment (Reddy Reference Reddy2001; Reddy et al. Reference Reddy, Zablotowicz, Locke and Koger2003; Wortman et al. Reference Wortman, Francis, Bernards, Drijber and Lindquist2012). Our results indicate that in the first year of using cover crops, there is no effect on corn or soybean yield under growing conditions experienced at the study sites.
When weed-free yield is modeled with cover crop quantity and quality, that is, biomass and C:N ratio, yield increases as these metrics increases, with the exception of cover crop biomass and soybean yield (Figure 5). Cover crops with high biomass and C:N ratios may have resulted in greater soil moisture, which can increase crop yields. For soybean yield in the weed-free subblocks, as biomass increases, yield is predicted to decrease (Figure 5B).
Relationship between cover crop biomass and carbon-to-nitrogen (C:N) ratio from the subblocks that were maintained weed-free and corn (left column) and soybean (right column) yield. Points are data from all 4 site-years (Blackstone and Blacksburg, VA, in 2016 and 2017) and all treatments (Table 1), excluding the no-cover check.
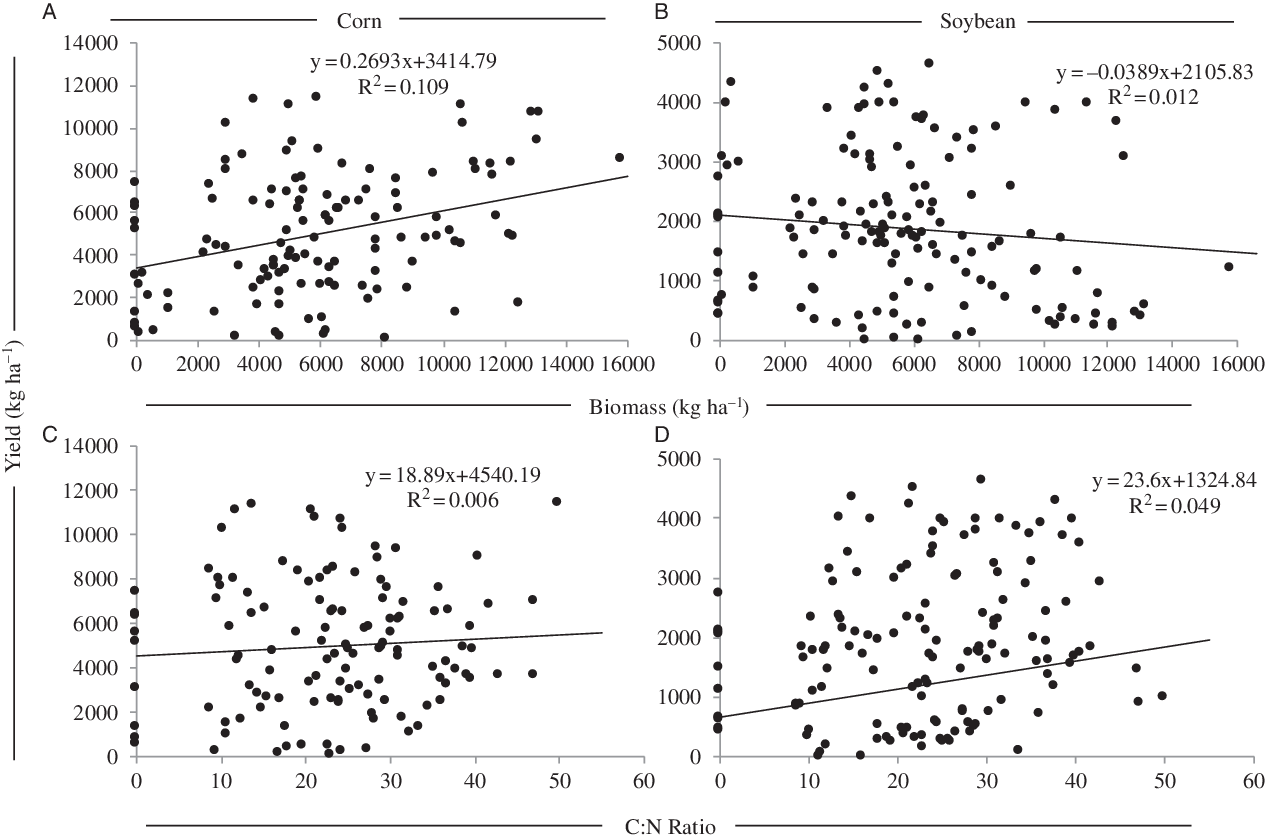
Even though relationships were detected in all comparisons of cash crop yield with cover crop biomass and C:N ratio, the R2 values were low (Figure 5). This shows that ultimately there are other factors that impact yield more than previous cover crop. High C:N ratios can cause nitrogen immobilization and impact weed and crop growth (Brady and Weil Reference Brady and Weil2010). It has been reported that residue with a C:N ratio >25:1 likely leads to nitrogen immobilization (Burgess et al. Reference Burgess, Mehuys and Madramootoo2002; Havlin et al. Reference Havlin, Beaton, Tisdale and Nelson2005; Iritani and Arnold Reference Iritani and Arnold1960). Nitrogen fertilizer added to the corn studies likely eased the limitation for nitrogen, masking some effects of the cover crops alone.
Management Implications
Current findings support that cover crop quantity and quality are important to achieve annual weed suppression. As biomass and C:N ratio increase, level of weed suppression and duration of suppression increase. Cover crop biomass is needed to create the mulch layer that is necessary to suppress weeds, and a high C:N ratio will slow degradation of the cover crop residue and extend the duration of weed suppression. Cereal rye alone or mixtures containing cereal rye were often best suited for weed suppression based on the biomass accumulated and C:N ratio. These findings also support previous research showing that cover crops are better suited to suppress smaller-seeded weeds, as they will likely lack the light needed to germinate and the carbohydrate reserves to grow through the residue mulch. Growers should consider their dominant weed species when incorporating a cover crop for weed suppression.
Acknowledgments
The authors would like to thank Kevin Bamber, Shawn Beam, Steve Haring, and Ranjeet Randhawa for help collecting data. This work was supported by the Virginia Agricultural Experiment Station, the Virginia Corn Board, the U.S. Department of Agriculture National Institute of Food and Agriculture and USDA Natural Resources Conservation Service Virginia Conservation Innovation Grant 69-33A7-16-1160. No conflicts of interest have been declared.
Supplementary material
To view supplementary material for this article, please visit https://doi.org/10.1017/wsc.2020.16



