

Does the descriptive representation of gender affect how constituents respond to legislators' substantive records? Previous work on the links between descriptive and substantive representation has focused mainly on government institutions and how representatives respond to their constituents' preferences. They show that descriptive representation can lead to substantive representation since female legislators often prioritize issues of particular importance to female voters (e.g., Swers Reference Swers2013).
Research that considers the other side of the constituent-legislator relationship—how voters respond to their representatives' records—has been more limited but offers two strikingly different expectations about the impact of descriptive representation. On the one hand, some argue that descriptive representation may lead to “blind loyalty”—that voters may be less vigilant of legislators who look like them, or they may support them regardless of the legislators' substantive record. On the other hand, some suggest that the symbolic benefits of descriptive role models may have an “empowering” effect on marginalized groups, leading them to be more aware of and responsive to their representatives' policy record.
What constituents know about their representatives' record and how they use that information to reward or punish them are central to democratic accountability. After all, if voters do not know what has been done in their name or if they choose to support or oppose incumbents for unrelated reasons, then legislators have little incentive to follow voters' preferences. Both of these elements of accountability—what constituents know about their representatives' policy record and how they use that information to evaluate them—may be influenced by descriptive representation. If descriptive representation creates “blind loyalty,” accountability may be weakened; if it instead empowers and informs voters, accountability may be strengthened.
I explore these possibilities by studying constituent-legislator relationships in the United States. I use a unique battery of survey questions in the 2006, 2008, and 2010 Cooperative Congressional Election Studies (CCES), which probe voters' knowledge of, and responses to, the roll call records of their U.S. senators. Combined with information about the senators' gender and actual record, these data reveal how descriptive representation affects constituents' responses to substantive representation.
The results show that female constituents represented by female senators are more aware of the substantive policy positions those senators have taken and weigh those positions more heavily when evaluating them than female constituents represented by male senators are. The research design rules out alternative explanations: the results are not due to the “novelty” of female politicians, unobserved difference between states that elect female senators and those that do not, or reliance on partisan stereotypes. Rather, the descriptive representation of marginalized groups strengthens accountability. I begin in the next section by synthesizing previous work on gender and political engagement before turning to hypotheses linking descriptive representation with accountability for substantive representation.
GENDER AND POLITICAL ENGAGEMENT
To ensure that their preferences are substantively represented, constituents must know how legislators have voted and use that information to reward or punish them (Ansolabehere and Jones Reference Ansolabehere and Jones2010). This mechanism is at the heart of standard models of accountability: without the fear of a vigilant public, legislators are assumed to have few incentives to represent their interests (Martin Reference Martin2003).
Not all members of the public are equally vigilant, however. On average, compared to men, women are less interested in politics (Burns, Schlozman, and Verba Reference Burns, Schlozman and Verba2001), are less likely to try to influence others (Hansen Reference Hansen1997; Karp and Banducci Reference Karp and Banducci2008), participate less (Verba, Burns, and Schlozman Reference Verba, Burns and Schlozman1997), have lower confidence in their understanding of politics (Banwart Reference Banwart2007; Gidengil, Giles, and Thomas Reference Gidengil, Giles and Thomas2008), and answer fewer questions about institutions and public officials correctly (Delli-Carpini and Keeter Reference Delli-Carpini and Keeter1996; Dow Reference Dow2009).Footnote 1
This gender gap in political engagement raises normative concerns about democratic representation. If women know less about politics than men and are less likely to act on that knowledge than men, then they may be less able to hold incumbents accountable for their policy record than men. And if legislators focus their attention particularly on the voters who are most engaged, then the quality of representation offered to men and women may well differ—a troubling concern for democratic equality (Verba, Burns, and Schlozman Reference Verba, Burns and Schlozman1997, 1053). In short, differences between men and women in their political engagement may lead to unequal representation.
These differences persist after controlling for differing levels of resources between men and women, suggesting that they are partially due to general orientations toward politics (see, e.g., Verba, Burns, and Schlozman Reference Verba, Burns and Schlozman1997). What causes these different orientations? A broad literature suggests that the low number of female politician role models may create an impression that politics is a man's game, closed off to women's needs (Mansbridge Reference Mansbridge1999; Reingold and Harrell Reference Reingold and Harrell2010; Wolbrecht and Campbell Reference Wolbrecht and Campbell2007). As Atkeson (Reference Atkeson2003, 1043) argues, “Viable women candidates lead women to feel more connected to and a part of the political system in a way that they do not when they look around and see only men.” This suggests that the gender gap is partially caused by the underrepresentation of women in politics—and therefore that descriptive representation could alter how women engage with politics.
DESCRIPTIVE REPRESENTATION AND DEMOCRATIC ACCOUNTABILITY
As a signal of system openness, being represented by a woman may directly affect how women respond to those legislators' substantive record. Previous work suggests two dramatically different effects, however. One is that “blind loyalty” in descriptive representatives may diminish accountability for substantive representation. The other is that female role models empower women, increase their interest in legislators' records, and enhance such accountability.
“Blind Loyalty”: Descriptive Representation May Diminish Accountability
Given a lack of detailed knowledge about politics, voters frequently rely on heuristics to evaluate their representatives. A shared set of visible characteristics, such as race or gender, may serve as a signal of shared policy positions (Box-Steffensmeier et al. Reference Box-Steffensmeier, Kimball, Meinke and Tate2003; Mansbridge Reference Mansbridge1999; Rosenthal Reference Rosenthal1995). Members of Congress certainly emphasize their shared descriptive bonds to build trust (Fenno Reference Fenno1978). Constituents may use descriptive representation to infer that they are substantively represented. This cue may not, however, be a trustworthy one. As one (cautious) advocate of descriptive representation for marginalized groups acknowledges, “the descriptive characteristics of a representative can lull voters into thinking their substantive interests are being represented even when this is not the case” (Mansbridge Reference Mansbridge1999, 640).
Descriptive representation may also diminish accountability if voters support legislators who look like them for reasons beyond substantive representation (Box-Steffensmeier et al. Reference Box-Steffensmeier, Kimball, Meinke and Tate2003, 261; Gay Reference Gay2002, 719). Even if they know their substantive interests are not being represented, descriptively represented constituents may exhibit “blind loyalty” and evaluate the incumbent on other, nonpolicy grounds (Mansbridge Reference Mansbridge1999, 640). Rather than being sanctioned for their policy record, descriptive representatives may be given what Fenno calls “representational leeway on policy matters” (Fenno Reference Fenno2003, 32).
Taken collectively, this suggests women will be less aware of female politicians' stances and/or will place less weight on policy when evaluating them. In either case, the descriptive representation of gender would thus diminish accountability for substantive representation.
“Female Empowerment”: Descriptive Representation May Enhance Accountability
At the same time, other research argues that descriptive representation could increase vigilance of the incumbent's record. Much of this literature follows theories of “minority empowerment” and role model effects, which suggest marginalized groups engage with politics more when descriptively represented (Banducci, Donovan, and Karp Reference Banducci, Donovan and Karp2004; Bobo and Gilliam Reference Bobo and Gilliam1990; Campbell and Wolbrecht Reference Campbell and Wolbrecht2006).
The presence of descriptive role models can fuel women's interest in politics, measured in a variety of ways. When women run for and win office, women are more likely to discuss politics with others (Atkeson Reference Atkeson2003; Hansen Reference Hansen1997); express interest (Burns, Schlozman, and Verba Reference Burns, Schlozman and Verba2001; Koch Reference Koch1997; Reingold and Harrell Reference Reingold and Harrell2010); and participate or say that they will in the future (Campbell and Wolbrecht Reference Campbell and Wolbrecht2006; High-Pippert and Comer Reference High-Pippert and Comer1998; Wolbrecht and Campbell Reference Wolbrecht and Campbell2007). In particular, descriptive representation can help close the gender gap in political knowledge. For example, women are more likely to recognize the names of female candidates than male candidates (Dolan Reference Dolan2011; Koch Reference Koch1997; Reingold and Harrell Reference Reingold and Harrell2010).
As such, descriptive representation has significant “symbolic” benefits for those unused to seeing people like them in politics. The greater engagement and empowerment that results should lead to increased awareness and vigilance of the incumbent's record. Stated conversely, in contexts of mistrust and past discrimination, a lack of descriptive representation may lead constituents to believe government is unresponsive to their needs and to disengage from politics (Mansbridge Reference Mansbridge1999). In both cases, we would expect to see greater accountability under conditions of descriptive representation.
Alternative Explanations
Existing research on the impact of descriptive representation thus suggests two strikingly divergent hypotheses: either that it enhances accountability through an increased engagement with politics, or that it diminishes accountability through a process of “blind loyalty” and a disregard for substantive representation. At the same time, several alternative explanations have been suggested, which I take into account in the research design.
One possibility is that female politicians are a “novelty” that affects all voters, male and female. Another is that voters in states that have previously elected women are systematically different from voters in states that have not. In both cases, how men respond to female politicians is critical. If novel female politicians, or differences between electorates, were the main cause of differences in engagement, then both men and women should respond to male and female politicians in different ways. If, on the other hand, descriptive representation influences marginalized groups due to its contrast with the usual lack of representation, then we would expect to see women but not men respond to female and male politicians in different ways (Atkeson and Carrillo Reference Atkeson and Carrillo2007; High-Pippert and Comer Reference High-Pippert and Comer1998; Reingold and Harrell Reference Reingold and Harrell2010). Throughout, I compare female voters to their male counterparts to assess these different explanations.
A second set of explanations concerns party affiliation. Other studies have argued that what appears to be an effect of descriptive representation is in fact an effect of shared partisan identities (Lawless Reference Lawless2004; Reingold and Harrell Reference Reingold and Harrell2010), such that women appear to be more engaged when women run but actually are engaged by same-party candidates. The analyses of politician evaluations control for partisan congruence between voter and politician. Another potential confound is that voters may assume that female politicians are Democrats and thus take liberal positions. If this were the case, we might see higher levels of knowledge about Democratic women (for whom the “cues” of party and gender are consistent) than about Republican women (for whom the cues are inconsistent). The models include interaction terms between the gender and party affiliation of the senator. Including this also tests for the possibility that perceptions of female politicians are dominated by the stereotypes associated with their party more than their gender (Dolan Reference Dolan2014; Hayes Reference Hayes2011).
Finally, previous studies of descriptive representation have found inconsistent effects in different years: Hansen (Reference Hansen1997) finds that female candidates increased engagement in 1992 but not in 1990 or 1994. Similarly, Koch (Reference Koch1997) finds that the presence of female candidates increased women's interest in and knowledge of politics in 1992, but not 1990, which he attributes to differences in electoral contexts in each year. The analysis here explores three cycles (2006, 2008, and 2010), which represent a range of electoral contexts and issue environments.
DATA
To explore these hypotheses, I use data from the 2006, 2008, and 2010 Cooperative Congressional Election Studies (CCES). These Internet surveys were conducted by Polimetrix for a consortium of universities and include “Common Content” questions asked of all respondents, as well as university-specific modules that asked subsets of respondents additional questions.Footnote 2 In each year, the CCES included a battery of questions to measure constituents' knowledge of and responses to their U.S. senators' record. Respondents were asked for their stance, and what they thought their senators' stance was, on several bills that Congress had recently debated.Footnote 3 This allows senators' actual records to be matched with voters' perceptions and preferences about the same bills.
The three surveys I draw on vary in their sample size and the number of roll call votes they asked about. The 2006 Common Content (N = 36,420) included questions about seven roll call votes; the 2008 Harvard University module (N = 3,000) included questions about four votes; and the 2010 Harvard/MIT and Harvard/UCSD modules (combined N = 5,500) included questions about six votes. Full details about the roll call votes and summary statistics for all variables are in the Online Appendix. The lower number of roll calls and smaller sample in the 2008 study leads to greater noise in the estimates than one would want ideally, but I include this study as one more test of the theories.
The low number of women in the U.S. Senate means that fewer than half of respondents were represented by women. In 2006, 14 of the 100 senators were female; in 2008, 16 of the 98 senators covered by the CCES were female; and in 2010, 17 of the 100 senators were female. The advantages of using the CCES data become apparent here: the large sample sizes mean that, across all three surveys, 23,190 evaluations were of a female senator (25.8% of the total 89,804 evaluations). Nonetheless, I note that real-world limitations mean the analyses do not concern a large sample of female senators.
Dependent Variables
The two elements of accountability—what constituents know about their legislator's record and how they use that information to evaluate them—require several dependent variables.
I code two variables capturing different dimensions of knowledge. The number of policy positions attributed is a count of the number of the senator's votes a respondent gave a non-“don't know” answer to. It ranges from zero (in all years) to seven (in the 2006 data). The percentage of policy positions correctly identified divides the number of correctly identified positions by the total number of roll call votes asked about for that senator. In all three years, it varies from 0 to 100%. Votes on which the senator did not take a position (because they were absent from the Senate or voted “present”) are excluded. Measuring both of these dimensions accounts for differences in knowledge that result from men and women having different propensities to guess answers (Mondak and Anderson Reference Mondak and Anderson2004).
To assess how respondents evaluate their senators, I use a standard job approval rating question from each year of the survey. This is measured as a categorical variable, with “strongly disapprove,” “somewhat disapprove,” “neither approve nor disapprove,” “approve,” and “strongly approve” as response options. I also analyze vote choice for or against the incumbent. This takes on a value of +1 if the respondent voted for the incumbent, 0 if they voted for another candidate.
Independent Variables
The independent variables fall into three categories: features of the senator, features of the respondent, and features of the relationship between senator and respondent.
For senators, the key indicator variable takes on a value of +1 for a female senator, 0 for a male senator. Since party affiliation may influence responses to descriptive representation (Dolan Reference Dolan2008), I control for a GOP senator, which equals +1 for Republican senators and 0 for Democrats or Democrat-aligned Independents. I code an indicator for whether the senator was running for reelection (senator on ballot), since campaigns may inform citizens about the record of their incumbents or influence how they are evaluated (Franklin Reference Franklin1991). The models also control for the senator's decades in office since long-term incumbents may be better known and more well liked (Sinclair Reference Sinclair1990). The models predicting knowledge of the incumbent's record also include a measure of the senator's ideological extremism. It may be easier for respondents to infer the positions of a senator who takes consistently liberal or conservative stances on issues than a senator who is more moderate. To capture this “predictability,” I use each senator's DW-NOMINATE score from the previous term of office. These scores run from –1 (most conservative) through +1 (most liberal). I take the absolute value, making a variable that ranges from 0 (moderate) to +1 (extreme).
For respondents, an indicator variable takes on a value of +1 for a female respondent, 0 for a male respondent. Other variables measure characteristics that influence general engagement with politics (Verba, Schlozman, and Brady Reference Verba, Schlozman and Brady1995). The respondent's education is coded as a categorical variable with those who did not complete high school as the excluded level and high school, some college, college, and postcollege education as levels. I also include the respondent's race: the excluded category is White, with Black, Hispanic, and “Other” race making up the other categories. The respondent's strength of party ID ranges from 0 (“pure” independents) to 3 (“strong” party identifiers). I also include a measure of interest in politics, coded as 1 (“Not much interested”), 2 (“Somewhat interested”), 3 (“Very much interested”) and then centered around the mean value in that year.Footnote 4
Finally, several variables capture the relationship between senators and respondents. Several studies warn of conflating descriptive representation and partisan/ideological congruence (Lawless Reference Lawless2004; Reingold and Harrell Reference Reingold and Harrell2010). Two indicator variables capture this possibility: same-party senator for those whose party ID matches the senator, and opposing-party senator for those whose party ID runs counter. Independent voters are thus the excluded category. I create a measure of policy congruence between the senator and respondent, which is the proportion of roll call votes on which the senator took the same position as the respondent (see Ansolabehere and Jones [Reference Ansolabehere and Jones2010] for an identical measure). This ranges from 0 (the senator and respondent did not agree on a single vote) to +1 (they agreed on every vote). The models also include an interaction between the respondent's conservatism, measured on a five-point numeric scale ranging from –2 (liberal) to +2 (conservative) and the GOP senator dummy. This captures the intuition that liberal respondents should evaluate Democratic senators more favorably and Republican senators less favorably (and vice versa).
The datasets include two observations per respondent (since each evaluated both of their senators). Rather than limiting the dataset (e.g., just to senators running for reelection), I follow Lawrence, Binder, and Maltzman (Reference Lawrence, Binder and Maltzman2011) and stack the observations into a single dataset. This “stacking” accounts for the Ns below that are greater than the CCES' sample size. The models use robust standard errors, clustered by senator, to account for the fact that respondents offered assessments of each separately.
DESCRIPTIVE REPRESENTATIVES AND KNOWLEDGE OF SUBSTANTIVE REPRESENTATION
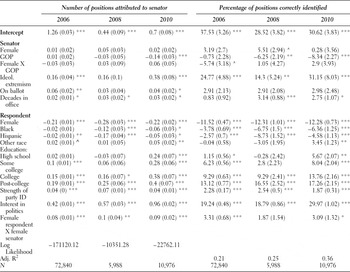
Do female constituents know more about their senators' voting record when represented by a woman than when represented by a man? The data for the number of positions attributed are moderately overdispersed, so I use negative binomial models rather than the usual Poisson distribution. For the percentage of positions correctly identified, I use OLS models. The results are shown in Table 1, organized by the year of the survey.
Regression models predicting knowledge of senators' policy positions

Note: Negative binomial regression models predicting number of policy positions attributed (first through third columns) and OLS regression models predicting percentage of positions correctly identified ( fourth through sixth columns) with robust standard errors clustered by senator. Significance levels are based on two-tailed tests.
***p < 0.001; **p < 0.01; *p < 0.05; ∧p < 0.1
Since they are used throughout the analyses, I begin by noting that the control variables have the expected effects. The more ideologically extreme the senator and the longer he or she has served in office, the more positions constituents attribute to them and the more they identify correctly. The better educated, more interested, and more partisan the constituent, the more likely they are to know how senators voted, while Black and Hispanic constituents score less well on both measures than Whites. None of these results are surprising, but they offer confirmation of the validity of the basic models.
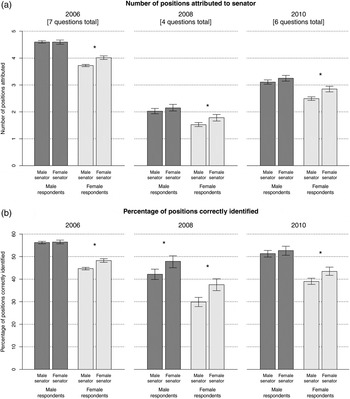
Interpreting the effects of the respondent's and senator's gender is more complicated, given the interaction terms in the models. I simulate the results from the regression models and predict the number of positions attributed, and the percentage correctly identified, for each combination of descriptive representation. Figure 1 presents the results by year: the upper plot shows the predicted number of positions attributed, the lower plot the predicted percentage correctly identified. Dark gray bars indicate the estimate for male constituents; light gray bars, the estimate for female constituents. Note that the different number of roll call questions in each survey means comparisons should not be made across years for the upper plot. Rather, the key comparisons in both plots are between male and female respondents with male and female senators within each year. Asterisks indicate a difference in knowledge of a male and female senator's record that is significant at the .05 level.
Knowledge of senators' positions, by gender of senator and constituent.

Whether one looks at the number of positions attributed (in the upper plot) or the percentage answered correctly (in the lower plot), female respondents knew more about female senators' policy record than male senators'. Take the 2006 survey: all else equal, female respondents are predicted to answer 3.72 [3.68, 3.76] of seven questions about a male senator but 4.01 [3.95, 4.08] about a female senator. Since a lack of confidence underpins the gender gap in engagement (Banwart Reference Banwart2007; Gidengil, Giles, and Thomas Reference Gidengil, Giles and Thomas2008), this suggests that descriptive representation can empower women. Similarly, women are predicted to answer 45.1% [44.0, 46.3] of a male senator's positions correctly, compared to 51.6% [50.8, 52.4] of a female senator's. Likewise, in 2008 and 2010, women answered more questions about female senators' records than male senators' and identified a higher percentage correctly.
In contrast, the number of positions male respondents attributed did not vary with the gender of the senator. In 2006, for example, men are predicted to answer 4.56 [4.55, 4.65] of the questions about male senators and 4.60 [4.52, 4.67] of the ones about female senators. In 2008 and 2010 as well, men's ability to attribute positions to their senator was unaffected by their gender. When it comes to the percentage of positions correctly identified, there is no consistent effect among male respondents. In 2008, the estimated percentage correct for a female senator (48.0% [45.3, 50.7]) is slightly greater than for a male senator (42.2% [39.9, 44.6]). Of all the combinations of representation in each of the years, however, this is the only estimate that indicates men are affected by the gender of their senator, and so I do not place particular weight on it here.
Across the analyses, there is only limited evidence that the gender and party affiliation of senators interact to affect voters' perceptions of their records. There is no evidence that respondents were able to offer more opinions about the positions that female Democrats took than the positions female Republicans took. For each year in turn, there were no significant differences in the number of positions attributed to female Democrats and female Republicans (in 2006, 3.98 [3.90, 4.07] and 4.05 [3.99, 4.12]; in 2008, 1.78 [1.61, 1.94] and 1.78 [1.66, 1.91]; and in 2010, 2.71 [2.58, 2.87] and 2.94 [2.83, 3.04]). In line with the prediction that respondents would be more likely to identify female senators' records when their party affiliation was consistent (i.e., they were Democrats), in both 2006 and 2010, respondents correctly identified a greater percentage of female Democrats' positions than female Republicans' positions (51.6% [50.8, 52.3] compared to 45.1% [44.0, 46.1] in 2006; 45.6% [43.7, 47.5] compared to 40.2% [37.2, 43.2]). These results suggest that respondents were more accurate when party and gender cues were “consistent.” However, there is no such discernible effect for the number of positions attributed or the percentage correct in 2008 (there, respondents identified 33.7% [29.9, 37.5] of female Republicans' positions correctly, compared to 38.8% [36.0, 41.9] of female Democrats').
Much more consistent is the effect of descriptive representation. Women knew more about their senators' policy record when represented by women than when represented by men. Male constituents, in contrast, are largely as likely to know how male and female senators have voted, indicating that these results aren't caused by the “novelty” of a female senator or background differences between electorates likely to elect female senators and those unlikely to. One of the requirements for democratic accountability—that constituents know what has been done in their name—is enhanced by descriptive representation. I turn now to explore another requirement: that constituents use that knowledge to reward or punish incumbents.
DESCRIPTIVE REPRESENTATIVES AND ACCOUNTABILITY FOR SUBSTANTIVE REPRESENTATION
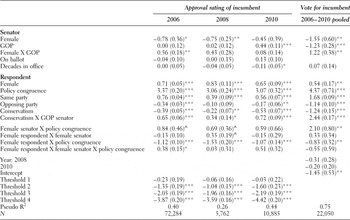
Do constituents weigh substantive representation in different ways when evaluating descriptive representatives? I fit ordered logit regression models that predict respondents' approval ratings of their senators. As key independent variables, I include the gender of the respondent, the gender of the senator, the degree of policy congruence between them, and their interactions. This allows us to assess whether the descriptive representation of gender alters the weight that constituents place on policy congruence in their evaluations. The results are shown in the first three columns of Table 2.
Regression models predicting evaluations of senators

Note: Ordered logistic regression models predicting approval ratings (columns one through three) and logistic regression model predicting vote for incumbent (column four) with robust standard errors clustered by senator. Significance levels are based on two-tailed tests.
***p < 0.001; **p < 0.01; *p < 0.05; ∧p < 0.1
I begin by simulating the probability of a respondent offering an “Approve” response to the job approval question, holding the degree of policy congruence constant at .50. The results suggest no effects of descriptive representation on overall levels of approval: in each year, there are no differences in the probability that respondents, male or female, approved of male and female senators. Take, for example, the 2010 survey. Female respondents were equally likely to approve of a male (probability = .32 [.27, .36]) as a female (.31 [.26, .35]) senator. Male respondents were also equally likely to approve of male or female senators (probabilities of .30 [.24, .34] and .27 [.22, .32], respectively). Full predicted probabilities for all years are shown in the Online Appendix. Given the same level of substantive representation, descriptive representation has no impact on evaluations: men and women are equally likely to approve of male and female senators who represent their policy preferences. In line with previous work (e.g., High-Pippert and Comer Reference High-Pippert and Comer1998), there is no evidence that female voters are more likely to support a politician simply because of her gender.
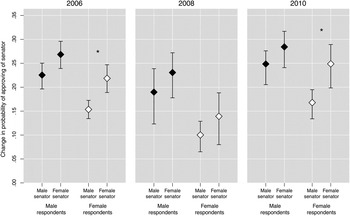
This does not mean that a senator's gender is irrelevant to the evaluations constituents make. Rather than exploring the overall levels of approval given a particular policy record, here I explore the weight placed on that policy record in evaluating different senators. I simulate the predicted difference in the probability of approving of a senator given a change in policy congruence from .25 to .75. These first differences can be thought of as the weight given to policy congruence in approval ratings: larger differences would indicate that approval ratings were more heavily influenced by policy congruence; smaller differences that they were less influenced by policy congruence. Figure 2 presents these differences by the gender of respondent and year. In each case, a black bullet represents male respondents; a white bullet, female respondents. Solid lines represent 95% confidence intervals; an asterisk indicates a significant difference between the first differences for a male and a female senator.
Predicted changes in approval ratings given an increase in substantive representation, by gender of senator and constituent.

For each year and each combination of senator and respondent gender, increases in policy congruence lead to increases in the probability of approval, as we would expect (Ansolabehere and Jones Reference Ansolabehere and Jones2010; Jones Reference Jones2011). Respondents are much more likely to approve of a senator who represents them on 75% of policy issues than one who represents them on 25% of policies. How much more likely they are to approve, however, varies with descriptive representation.
Female respondents are significantly more responsive to female senators' substantive records than those of male senators'. For example, in 2010, an increase in policy congruence is associated with a change in the probability of approving of a male senator from .23 to .40, a difference of .17 [.13, .19]. For female senators, however, the same shift in policy congruence leads the probability to change from .19 to .44, an increase of .25 [.20, .29]. This is also true in 2006, where the probability of approval shifts from .25 to .40 (an increase of .15, [.13, .17]) for male senators but from .20 to .42 for female senators (a greater increase of .22 [.19, .25]) for female senators. For 2008, there is no significant difference in the weight female respondents placed on substantive representation when evaluating male and female senators. This may be due in part to the limited number of roll calls the 2008 CCES included (four, as opposed to seven in 2006 and six in 2010) or the smaller sample size that increases the uncertainty around these estimates. Overall, though, women appear to place more weight on substantive representation when they are represented by women than when they are represented by men.
In contrast, there are no significant differences in the weight men place on policy when evaluating male and female senators. An increase in policy congruence increases the probability of approval of .23 [.20, .25] for male senators and .27 [.24, .29] for female senators in 2006; of .19 [.12, .24] for male senators and .23 [.18, .27] for female senators in 2008; and of .25 [.20, .28] for male senators and .28 [.24, .32] for female senators in 2010. Unlike women, men placed the same weight on congruence when evaluating male and female senators.
These findings are confirmed by the regression results in the final column of Table 2, where I model the choice to vote for or against the incumbent with a logistic regression. Since only a third of senators can be on the ballot in any given year (even before accounting for retirements), breaking the results down by year results in too few cases to analyze. Instead, I pool the three years of survey data and include indicators for the year in the model (the omitted category is 2006). The results show an almost identical pattern to the approval rating models. Simulating the results as in Figure 2 suggests that women represented by men are again less responsive to their record (the shift in congruence increases the probability of voting for them from .39 to .79, an increase of .40 [.36, .43]). When represented by women, however, female voters are more responsive: the increase in congruence increases the probability of voting for the incumbent from .31 to .85, an increase of .54 [.50, .59]. In both cases, an increase in policy congruence increases the probability of electoral support. But the weight given to policy congruence in vote choice is greater under conditions of descriptive representation.
In short, descriptive representation influences how voters use substantive representation to evaluate their senators. In 2006 and 2010, female respondents placed greater weight on substantive representation when evaluating female senators than when evaluating male senators. They held descriptive representatives more accountable for their policy record than male senators. For male respondents, in contrast, the gender of the senator did not change the extent to which they factored his or her policy record into their evaluations.
CONCLUSIONS
Much previous research on the links between descriptive and substantive representation has focused on representatives and whether they are more responsive to those who “look like” them. This paper focuses on the other side of that relationship and how voters respond to the policy record of descriptive representatives. By assessing what constituents know about their senators' policy record and how they use that knowledge to evaluate them, a clear picture of the influence of descriptive representation on accountability for substantive representation emerges. In contrast to claims that descriptively represented constituents may exhibit “blind loyalty,” failing to notice when legislators do not represent their interests or supporting them regardless, the descriptive representation of gender enhances both elements of accountability. Women know more about their senators' records and weigh that information more heavily in evaluations when their senators are female. Theories of female empowerment—that predict descriptive representation will increase engagement with politics—find strong support here.
The research design used here offers greater confidence in this conclusion for several reasons. First, the fact that male respondents do not consistently differ in their responses to male and female senators suggests that these results are not due to the “novelty” of a female politician or differences in state electorates that elected female incumbents in the first place. Second, the results all control for partisan congruence and party affiliation, suggesting that the estimated effects of descriptive representation are not simply the effects of a shared partisan identity or the use of partisan heuristics. Finally, the consistent pattern of results across three electoral cycles suggests that the effect of descriptive representation may not be as conditional on the electoral context as previously thought (e.g., Koch Reference Koch1997).
At the same time, there are limitations to how much we can generalize from these results. The survey questions used, for the most part, do not tap what have been seen in the past as “women's issues,” making it difficult to assess whether the types of policies discussed moderate the effects of descriptive representation. Research indicates that voters seek out more information about female candidates' stances on “compassion issues” (Ditonto, Hamilton, and Redlawsk Reference Ditonto, Hamilton and Redlawsk2013) and that women know more about practical issues that impact their roles as caregivers (Stolle and Gidengil Reference Stolle and Gidengil2010). The effect of descriptive representation on accountability may be strongest when the issues at stake are particularly gendered: future surveys could include a wider range of policy issues to test this possibility.Footnote 5
Likewise, the analyses do not take into account other ways that politicians can descriptively represent constituents. Most notably missing is the representation of race, a limitation placed on the small number of non-White senators (and complete lack of non-White female senators) in this time period. Of particular interest to theories of descriptive representation is the intersection of different social identities such as race and gender (see, e.g., Philpot and Walton Reference Philpot and Walton2007). Future studies could perhaps replicate these analyses for the House or in an experimental setting to assess how constituents respond to representation by male and female senators of different races and ethnicities.
Also worth exploring in future research is the potential link between descriptive representation at a collective level and voters' responses to substantive representation. This study has focused solely on the dyadic relationship between a voter and his or her individual representative. But the theories of empowerment and role model effects—discussed in the section on descriptive representation and democratic accountability—are not necessarily limited to the formal relationship between a constituent and her senator. Having more female members of the legislature may increase engagement among women even if they do not reside in one of those members' constituencies (Atkeson and Carrillo Reference Atkeson and Carrillo2007; Wolbrecht and Campbell Reference Wolbrecht and Campbell2007). Increased engagement due to more role models in politics may well have many positive effects on political behavior, but is unlikely to affect accountability for substantive representation, at least in an electoral system featuring single-member districts as in the United States. Holding a legislature collectively accountable for its policy record is a complicated task when one is faced only with the particular candidate choices in one's district (Jones Reference Jones2011). In other words, it seems unlikely that greater numbers of women in a legislature in general would influence voters' ability to hold any particular legislator accountable for their votes.
That the descriptive representation of gender strengthens accountability for substantive representation may still have system-wide consequences, however. Politicians have a particular interest in paying attention to the needs and interests of those citizens most engaged with politics (Martin Reference Martin2003; Verba, Schlozman, and Brady Reference Verba, Schlozman and Brady1995). If descriptive representation leads to increased engagement among women, then it may also lead female politicians to be more responsive to their preferences. Descriptive representation in a legislature might lead to substantive representation in government policy not just because of the different priorities and positions of female legislators (Swers Reference Swers2013), but also because descriptively represented voters are more aware of and responsive to their record. At the same time, this suggests that female politicians face an electorate that is, overall, more attentive to any policy missteps that they make. The greater weight given to substantive representation by descriptively represented women cuts both ways. While female politicians are rewarded more for taking pleasing positions, as shown in Figure 2, they are also punished more for taking displeasing positions. Facing a more vigilant electorate may constitute a significant burden to succeeding as a woman in politics.
In general, these results make a case for studying in greater detail the interactive effects of descriptive and substantive representation. By showing that descriptive representation influences accountability for substantive representation, they signal the need to study the two in interaction rather than isolation. Doing so shows that the descriptive representation of gender strengthens accountability for the substantive representation of policy preferences, another potential argument in favor of increasing female representation in politics.