Introduction
Current psychiatric nosology – reflected in the Diagnostic and Statistical Manual for Mental Disorders, 5th edition (DSM-5) and the International Classification of Diseases, 10th edition (ICD-10) – has been criticized for grouping disorders based on superficial similarity and for failing to represent actual commonalities among them (Watson, Reference Watson2005; Andrews et al. Reference Andrews, Goldberg, Krueger, Carpenter, Hyman, Sachdev and Pine2009). For example, emotional disorders – a cluster of strongly related conditions, including depressive, bipolar and anxiety disorders as well as post-traumatic stress disorder (PTSD) and obsessive–compulsive disorder (OCD) (Barlow, Reference Barlow1991; Watson, Reference Watson2005; Goldberg et al. Reference Goldberg, Krueger, Andrews and Hobbs2009b ) – is not a formal diagnostic class in DSM-5. These conditions were assigned to five separate classes despite strong similarities among them on a wide range of diagnostic validators (Goldberg et al. Reference Goldberg, Krueger, Andrews and Hobbs2009b ), with the possible exception of bipolar disorders (Goldberg et al. Reference Goldberg, Andrews and Hobbs2009a ). In particular, the emotional disorders share several key risk factors, neural abnormalities and treatments.
The key evidence for the emotional disorders cluster comes from factor-analytic research that sought to inform development of a quantitative nosology, which would classify disorders according to empirical commonalities and describe psychopathology dimensionally (Krueger & Markon, Reference Krueger and Markon2006; Lahey et al. Reference Lahey, Rathouz, Van Hulle, Urbano, Krueger, Applegate, Garriock, Chapman and Waldman2008; Andrews et al. Reference Andrews, Goldberg, Krueger, Carpenter, Hyman, Sachdev and Pine2009). In children, these studies have consistently supported two fundamental spectra of mental illness: internalizing and externalizing (Achenbach, Reference Achenbach1966; Achenbach & Rescorla, Reference Achenbach and Rescorla2001; Lahey et al. Reference Lahey, Applegate, Waldman, Loft, Hankin and Rick2004, Reference Lahey, Rathouz, Van Hulle, Urbano, Krueger, Applegate, Garriock, Chapman and Waldman2008). Adult studies have replicated these two dimensions, with internalizing composed primarily of the emotional disorders and externalizing defined by substance use, conduct and antisocial disorders (Krueger & Markon, Reference Krueger and Markon2006; Slade & Watson, Reference Slade and Watson2006; Kessler et al. Reference Kessler, Cox, Green, Ormel, McLaughlin, Merikangas, Petukhova, Pine, Russo, Swendsen, Wittchen and Zaslavsky2011; Kotov et al. Reference Kotov, Ruggero, Krueger, Watson, Yuan and Zimmerman2011b ; Keyes et al. Reference Keyes, Eaton, Krueger, Skodol, Wall, Grant, Siever and Hasin2012). Despite substantial recent advances in adult research, however, three questions remain unresolved regarding the internalizing spectrum in particular.
First, although the internalizing dimension includes a diverse set of conditions, the lower-order structure of the spectrum is not well understood. Some studies have identified two subfactors: a distress dimension (marked by major depressive disorder, dysthymic disorder, generalized anxiety disorder and PTSD); and a fear dimension (marked by panic disorder, agoraphobia, social phobia and specific phobia) (Vollebergh et al. Reference Vollebergh, Iedema, Bijl, de Graaf, Smit and Ormel2001; Krueger & Markon, Reference Krueger and Markon2006; Miller et al. Reference Miller, Fogler, Wolf, Kaloupek and Keane2008, Reference Miller, Wolf, Reardon, Greene, Ofrat and McInerney2012; Keyes et al. Reference Keyes, Eaton, Krueger, Skodol, Wall, Grant, Siever and Hasin2012). Other research has not supported this distinction, however (Krueger et al. Reference Krueger, Chentsova-Dutton, Markon, Goldberg and Ormel2003; Kessler et al. Reference Kessler, Cox, Green, Ormel, McLaughlin, Merikangas, Petukhova, Pine, Russo, Swendsen, Wittchen and Zaslavsky2011; Roysamb et al. Reference Roysamb, Kendler, Tambs, Orstavik, Neale, Aggen, Torgersen and Reichborn-Kjennerud2011). Moreover, a few investigations have suggested the presence of the third subfactor defined by bipolar disorders (Watson, Reference Watson2005; Keyes et al. Reference Keyes, Eaton, Krueger, Skodol, Wall, Grant, Siever and Hasin2012; Forbush & Watson, Reference Forbush and Watson2013) or OCD (Wright et al. Reference Wright, Krueger, Hobbs, Markon, Eaton and Slade2013).
Second, few factor-analytic investigations have included OCD and bipolar disorders, and thus their placement remains uncertain. All studies that examined these conditions concluded that both disorders belong to the internalizing spectrum (Slade & Watson, Reference Slade and Watson2006; Miller et al. Reference Miller, Fogler, Wolf, Kaloupek and Keane2008; Kessler et al. Reference Kessler, Cox, Green, Ormel, McLaughlin, Merikangas, Petukhova, Pine, Russo, Swendsen, Wittchen and Zaslavsky2011; Kotov et al. Reference Kotov, Chang, Fochtmann, Mojtabai, Carlson, Sedler and Bromet2011a ; Keyes et al. Reference Keyes, Eaton, Krueger, Skodol, Wall, Grant, Siever and Hasin2012; Forbush & Watson, Reference Forbush and Watson2013; Wright et al. Reference Wright, Krueger, Hobbs, Markon, Eaton and Slade2013), with one exception (Kotov et al. Reference Kotov, Ruggero, Krueger, Watson, Yuan and Zimmerman2011b ). However, their position within this spectrum is less clear. Some investigations placed OCD on the fear dimension (Slade & Watson, Reference Slade and Watson2006; Miller et al. Reference Miller, Fogler, Wolf, Kaloupek and Keane2008), whereas others located it on its own subfactor (Wright et al. Reference Wright, Krueger, Hobbs, Markon, Eaton and Slade2013). Similarly, bipolar disorders were either assigned to distress (Wright et al. Reference Wright, Krueger, Hobbs, Markon, Eaton and Slade2013) or defined a new subfactor (Keyes et al. Reference Keyes, Eaton, Krueger, Skodol, Wall, Grant, Siever and Hasin2012; Forbush & Watson, Reference Forbush and Watson2013).
Third, the vast majority of this first-generation research relied on diagnostic interviews based on the DSM and/or ICD, which have a common limitation. These interviews typically employ skip-outs, which enable efficient assessment of dichotomous diagnoses but preclude dimensional measurement of psychopathology. Consequently, factor analyses had to focus on diagnoses and make assumptions about the latent variables underlying each of them (i.e. continuous and normal distribution) that could not be tested. Furthermore, some diagnoses were too rare or unreliable to be analysed, which is why mania and OCD were often excluded (Krueger, Reference Krueger1999; Vollebergh et al. Reference Vollebergh, Iedema, Bijl, de Graaf, Smit and Ormel2001; Miller et al. Reference Miller, Fogler, Wolf, Kaloupek and Keane2008; Watson, Reference Watson2009). Several studies sought to address this limitation by analysing symptom ratings not affected by skip-outs (Markon, Reference Markon2010; Simms et al. Reference Simms, Prisciandaro, Krueger and Goldberg2012; Wright et al. Reference Wright, Krueger, Hobbs, Markon, Eaton and Slade2013). However, the symptoms available for analyses did not provide comprehensive coverage of the emotional disorders. Moreover, these variables had too few levels to be considered truly continuous.
Second-generation factor-analytic studies have sought to overcome limitations of diagnostic interviews by employing self-report measures that assess psychopathology dimensionally (Zinbarg & Barlow, Reference Zinbarg and Barlow1996; Kramer et al. Reference Kramer, Krueger and Hicks2008; Sellbom et al. Reference Sellbom, Ben-Porath and Bagby2008; Prenoveau et al. Reference Prenoveau, Zinbarg, Craske, Mineka, Griffith and Epstein2010; Forbes & Schniering, Reference Forbes and Schniering2013; Kushner et al. Reference Kushner, Krueger, Wall, Maurer, Menk and Menary2013). These investigations supported the existence of the internalizing dimension, including distress and fear subfactors within it (Prenoveau et al. Reference Prenoveau, Zinbarg, Craske, Mineka, Griffith and Epstein2010; Forbes & Schniering, Reference Forbes and Schniering2013; Kushner et al. Reference Kushner, Krueger, Wall, Maurer, Menk and Menary2013). Watson et al. (Reference Watson, O'Hara, Naragon-Gainey, Koffel, Chmielewski, Kotov, Stasik and Ruggero2012), the only self-report study to include OCD and mania, identified a bipolar subfactor in addition to distress and fear. However, self-ratings may be affected by several problems – including acquiescence, careless responding and defensiveness/poor insight (Meade & Craig, Reference Meade and Craig2012; Fervaha & Remington, Reference Fervaha and Remington2013; Lanyon & Wershba, Reference Lanyon and Wershba2013; Rammstedt & Farmer, Reference Rammstedt and Farmer2013) – which makes it desirable to complement self-ratings with other methods. A trained interviewer often can minimize these problems through clarification, probing, encouragement and application of clinical judgment (Spitzer et al. Reference Spitzer, Williams, Gibbon and First1992).
A new generation of classification research seeks to integrate the strengths of these two approaches by employing interview measures specifically designed to assess psychopathology dimensionally. In particular, Lahey et al. (Reference Lahey, Applegate, Waldman, Loft, Hankin and Rick2004) developed an interview that assesses common DSM-IV and ICD-10 symptoms in children without skip-outs. Factor analyses of the resulting measure confirmed the existence of the internalizing spectrum and identified subfactors that resemble fear and distress clusters (Lahey et al. Reference Lahey, Applegate, Waldman, Loft, Hankin and Rick2004). A comparable interview measure has not been available for adults, however.
To address this gap, we developed such an interview measure (see Watson et al. Reference Watson, O'Hara, Simms, Kotov, Chmielewski, MclityDade-Montez, Gamez and Stuart2007). It covers all DSM-IV and ICD-10 symptoms of the emotional disorders, does not use skip-outs, and operationalizes psychopathology dimensionally. The current study sought to clarify the structure of the emotional disorders by conducting factor analyses of dimensional syndromes assessed with this interview, thus bridging first- and second-generation research on this issue. We were able to investigate the placement of OCD and bipolar disorder, as continuous modeling with large item sets provided reliable markers of both conditions. To test the validity of the resulting structure, we evaluated its robustness across populations and over time. First, we estimated factor-analytic models independently in patients and non-patients. Only Watson et al. (Reference Watson, O'Hara, Naragon-Gainey, Koffel, Chmielewski, Kotov, Stasik and Ruggero2012) have considered both populations in the same study, but they combined the samples and did not evaluate replicability of the factors. Second, we examined stability of the structure over 2 months. Previous longitudinal studies used delays ranging from 1 to 9 years (Krueger et al. Reference Krueger, Caspi, Moffitt and Silva1998; Vollebergh et al. Reference Vollebergh, Iedema, Bijl, de Graaf, Smit and Ormel2001; Fergusson et al. Reference Fergusson, Horwood and Boden2006; Eaton et al. Reference Eaton, Krueger and Oltmanns2011, Reference Eaton, Krueger, Markon, Keyes, Skodol, Wall, Hasin and Grant2013); consequently, the short-term stability of the quantitative classification is uncertain. Importantly, analyses of short-term stability are critical to determining whether observed change reflects true psychological change or measurement error (Chmielewski & Watson, Reference Chmielewski and Watson2009). Furthermore, we investigated the role of spectra versus disorder-specific variance in the stability of the emotional disorders, as only Fergusson et al. (Reference Fergusson, Horwood and Boden2006) have examined this question systematically.
Based on previous work, we hypothesized that a three-subfactor organization – specifying distress, fear and bipolar dimensions (Watson, Reference Watson2005; Watson et al. Reference Watson, O'Hara, Naragon-Gainey, Koffel, Chmielewski, Kotov, Stasik and Ruggero2012) – would fit the data better than alternative models. We expected this three-factor model to generalize across populations and show high short-term stability.
Method
Participants
The participants were 385 undergraduate students and 288 psychiatric out-patients. Students were recruited from introductory psychology courses and were given research credit for their participation. Psychiatric patients were recruited from the vicinities of the University of Iowa and Stony Brook University – namely, two out-patient psychiatry department clinics, two psychology department clinics and three community mental health centers. Patients were approached by study staff in a clinic waiting room and invited to participate in the project. Interested patients came to a laboratory on campus and were provided financial compensation.
Wave 1 interviews were done in person. Wave 2 interviews were conducted 2 months later and were done over the telephone. Of 385 students, 337 completed the follow-up (retention rate of 88%). Of 188 patients from Iowa, 167 completed the follow-up (retention rate of 89%); the 100 patients from Stony Brook area could not be retested for logistical reasons and were excluded from longitudinal analyses. Participants lost to follow-up were quite similar to completers on wave 1 variables with no more than modest differences (online Supplementary Table S1). Interviews typically were 30–60 min in duration.
The student sample was predominantly female (73%) and Caucasian (92%) and ranged in age from 18 to 40 years (mean = 19.00, s.d. = 2.04 years). The patient sample also was largely female (69%) and Caucasian (90%). Patients’ ages ranged from 18 to 85 years (mean = 42.11, s.d. = 13.31 years). All patients reported a lifetime history of mental health treatment; 90% were in treatment at the time of wave 1 assessment, and 87% were in treatment at wave 2.
Ethics
The study was approved annually by the institutional review boards of the University of Iowa and Stony Brook University.
All procedures contributing to this work comply with the ethical standards of the relevant national and institutional committees on human experimentation and with the Helsinki Declaration of 1975, as revised in 2008.
Measure
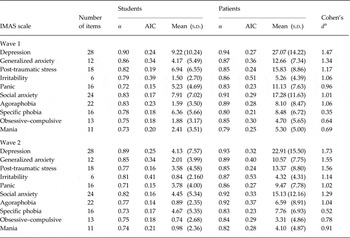
The Interview for Mood and Anxiety Symptoms (IMAS; see Watson et al. Reference Watson, O'Hara, Simms, Kotov, Chmielewski, MclityDade-Montez, Gamez and Stuart2007, Reference Watson, O'Hara, Naragon-Gainey, Koffel, Chmielewski, Kotov, Stasik and Ruggero2012) was constructed to assess symptoms of the emotional disorders present in the past month without the use of skip-out rules; that is, every symptom was assessed in each participant. Symptoms were rated on a three-point scale: absent (0), subthreshold (1), or above-threshold (2). The IMAS is a structured interview, but it requires the interviewer to probe responses. Items were derived from the mood and anxiety disorder modules of the Composite International Diagnostic Interview (CIDI; Kessler & Ustun, Reference Kessler and Ustun2004) to cover all DSM-IV and ICD-10 mood and anxiety disorder symptom criteria. New items were added to address deficiencies identified in pilot testing (n = 89 students, 38 patients). Factor analysis was used to create a multi-item scale for each emotional disorder, as well as a separate scale for irritability (which appears in the criteria of multiple diagnoses), resulting in 10 scales overall (Watson et al. Reference Watson, O'Hara, Simms, Kotov, Chmielewski, MclityDade-Montez, Gamez and Stuart2007, Reference Watson, O'Hara, Naragon-Gainey, Koffel, Chmielewski, Kotov, Stasik and Ruggero2012). The number of items per scale ranged from 6 to 28. Scale α's ranged from 0.71 to 0.90 (mean = 0.79) in students and from 0.80 to 0.94 (mean = 0.87) in patients (Table 1). As expected, symptom levels were much higher in patients than in students (Table 1). These differences were smaller for obsessive–compulsive and mania syndromes, as they were relatively rare in patients, and for specific phobia, which was common in students. Of note, significant levels of symptomatology were observed in the student sample, consistent with the prevalence of the emotional disorders in young adults (Blanco et al. Reference Blanco, Okuda, Wright, Hasin, Grant, Liu and Olfson2008).
Descriptive characteristics of the IMAS scales in student and patient samples (waves 1 and 2)

IMAS, Interview for Mood and Anxiety Symptoms; α, Cronbach's α; AIC, average interitem correlation; s.d., standard deviation.
a Cohen's d is the standardized mean difference between the student and patient groups (all are significant at p < 0.01).
The IMAS was administered by lay interviewers, each of whom completed a 20-h training program and was certified based on observation of interviews and reliability of ratings. The training included modules on establishing rapport, distinguishing between clinically significant and normative responses, probing techniques, and the specific content of the IMAS. Interviews were recorded, and 100 tapes (66 students; 34 patients) were rescored by a different, randomly selected interviewer. Inter-rater agreement was excellent for all IMAS scales in both samples: intraclass correlations ranged from 0.96 to 1.00 for students and from 0.97 to 0.99 for patients.
Data analyses
Structural equation modeling analyses were performed with Amos 6.0 (Arbuckle, Reference Arbuckle2005). We used the confirmatory factor analysis model with cross-sectional data and full structural equation model with longitudinal data. We tested metric invariance of the hybrid model across populations and also over time. We estimated models using full information maximum likelihood, a recommended approach to handling missing data (Enders, Reference Enders2001), as a few participants did not complete all modules and some did not participate in the follow-up. In evaluating the models, we considered five absolute fit indices permitted by this estimator: the χ2 goodness-of-fit statistic, the Bentler–Bonett normed fit index (NFI), the Tucker–Lewis index (TLI), the comparative fit index (CFI) and the root-mean-square error of approximation (RMSEA). We also examined relative fit indices: Akaike's information criterion (AIC) and the Browne–Cudeck criterion (BCC) (for interpretation of fit indices, see online Supplementary Method).
Results
Bivariate associations among syndromes
Correlations among the syndromes were positive and moderate to high in magnitude; the mean r ranged from 0.38 to 0.44 across the two waves and samples (online Supplementary Table S2), suggesting that all conditions reflect a common underlying dimension, the internalizing spectrum. Associations among some syndromes were considerably higher than the mean, implying the presence of subfactors. For instance, correlations between the depression, generalized anxiety, post-traumatic stress, irritability and panic syndromes were notably high (the mean r ranged from 0.52 to 0.58), consistent with the existence of a distress cluster. The syndromes exhibited substantial stability over the 2-month interval, with retest correlations ranging from 0.48 to 0.69 in students and from 0.60 to 0.79 in patients.
Symptom structure in wave 1
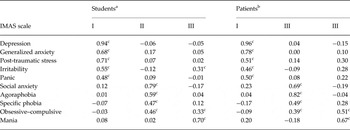
To ensure thorough consideration of alternative models, we began by conducting an exploratory factor analysis of the wave 1 data. Models with four or more factors did not replicate across samples – for example, in the four-factor solution, post-traumatic stress syndrome loaded unambiguously on the distress factor in patients, but joined panic to form a distinct factor in students – and thus were rejected. In contrast, the three-factor solution had the same pattern of primary loadings in both patients and students (Table 2). It included a distress factor (depression, generalized anxiety, post-traumatic stress, irritability and panic), a fear factor (social anxiety, agoraphobia, specific phobia and obsessive–compulsive) and a bipolar factor (mania and obsessive–compulsive). Of note, obsessive–compulsive syndrome was the only variable to show meaningful cross-loadings in both samples. Interfactor correlations were moderate to strong in both samples, ranging from 0.45 to 0.67, which suggests that they belong to the same broad domain.
Promax loadings of the IMAS scales in wave 1 data (students and patients)

IMAS, Interview for Mood and Anxiety Symptoms.
a In students, factor correlations were 0.59 (I v. II), 0.52 (I v. III) and 0.46 (II v. III).
b In patients, factor correlations were 0.67 (I v. II), 0.65 (I v. III) and 0.45 (II v. III).
c Loading >0.30.
Symptom structure in wave 2
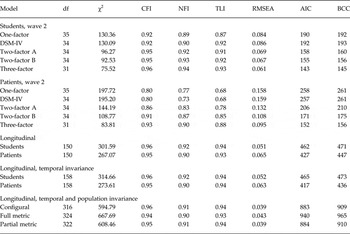
We conducted confirmatory factor analyses in the wave 2 data to cross-validate the three-factor model and compare it with four main alternatives. The first alternative was based on studies that reported a single internalizing dimension (Krueger et al. Reference Krueger, Chentsova-Dutton, Markon, Goldberg and Ormel2003; Kessler et al. Reference Kessler, Cox, Green, Ormel, McLaughlin, Merikangas, Petukhova, Pine, Russo, Swendsen, Wittchen and Zaslavsky2011; Roysamb et al. Reference Roysamb, Kendler, Tambs, Orstavik, Neale, Aggen, Torgersen and Reichborn-Kjennerud2011). A second alternative was a model implied by DSM-IV with two factors: mood disorders (depression, mania and irritability) and anxiety disorders (all other syndromes). We also tested a previously found model (Krueger, Reference Krueger1999; Krueger & Markon, Reference Krueger and Markon2006; Slade & Watson, Reference Slade and Watson2006; Keyes et al. Reference Keyes, Eaton, Krueger, Skodol, Wall, Grant, Siever and Hasin2012) with two factors: distress (depression, generalized anxiety, post-traumatic stress, irritability, panic and mania) and fear (social anxiety, agoraphobia, specific phobia and obsessive–compulsive syndrome). This model (two-factor A) differed from prior studies in that panic was assigned to the distress rather than the fear factor, because correlations clearly indicated that panic clusters with distress syndromes in our data (see online Supplementary Table S2). Of note, the assignment of mania to the distress dimension was tentative, as it was based on a single study (Keyes et al. Reference Keyes, Eaton, Krueger, Skodol, Wall, Grant, Siever and Hasin2012). Hence, we also tested a variant of this model (two-factor B), in which mania was assigned to the fear factor but the structure was unchanged otherwise.
The three-factor model fit the data best in both students and patients (Table 3). It produced the best scores on absolute fit indices. Indeed, all indices were acceptable or excellent, except for the TLI, which was slightly below the threshold in patients (0.88). It also outperformed other models on relative fit indices, as differences on the AIC and BCC decisively favored the three-factor model in all comparisons (all differences >10). Moreover, all factor loadings were substantial and consistent with expectations (online Supplementary Figure S1).
Model fit statistics a

df, Degrees of freedom; CFI, comparative fit index; NFI, normed fit index; TLI, Tucker–Lewis index; RMSEA, root-mean-square error of approximation; AIC, Akaike's information criterion; BCC, Browne–Cudeck criterion; DSM, Diagnostic and Statistical Manual for Mental Disorders.
a In the one-factor model, all syndromes load on the single internalizing dimension. In the two-factor A model, the factors are distress (depression, generalized anxiety, post-traumatic stress, irritability, panic and mania) and fear (social anxiety, agoraphobia, specific phobia and obsessive–compulsive syndrome). In the two-factor B model, the factors are distress (depression, generalized anxiety, post-traumatic stress, irritability and panic) and fear (social anxiety, agoraphobia, specific phobia, mania and obsessive–compulsive syndrome). In the three-factor model, the factors are distress (depression, generalized anxiety, post-traumatic stress, irritability and panic), fear (social anxiety, agoraphobia, specific phobia and obsessive–compulsive), and bipolar (obsessive–compulsive and mania syndrome). The longitudinal model is a hybrid model with paths from wave 1 to wave 2 factors. The longitudinal temporal invariance model constrained factor loadings to be equal across the waves. The configural model fit the longitudinal temporal invariance model in both samples simultaneously and specified only zero (fixed) loadings to be invariant between populations. The full metric model constrained all loadings to be invariant between populations. The partial metric model allowed the loadings of panic and agoraphobia to differ between populations; all others were constrained to be equal.
Longitudinal analyses
We examined the temporal stability of dimensions in the best-fitting (three-factor) model by specifying the same factor structure in both waves and estimating paths between the corresponding factors in waves 1 and 2. Correlations were allowed between error terms of the corresponding syndromes, except for the correlation between the error terms of wave 1 and wave 2 mania, as it was not significant and thus was constrained to zero.
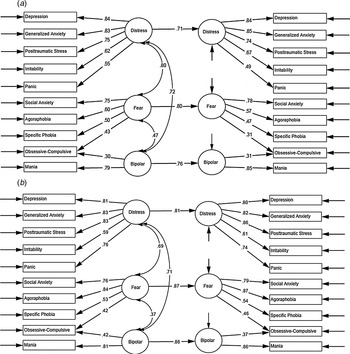
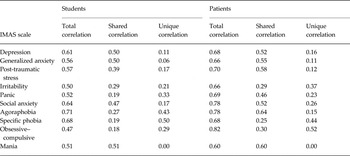
The model fit well in both students and patients (Table 3). Stabilities of factors were high, ranging from 0.71 to 0.87 (Fig. 1). Correlations between error terms were substantial (average r = 0.43 in students and 0.53 in patients), indicating the presence of stable variance unique to a given condition. To isolate the contributions of shared dimensions to the temporal stability of syndromes, we decomposed test–retest correlations into effects of (a) the relevant common factor and (b) stable variance unique to each syndrome (see Table 4). Test–retest correlations of mania, depression, generalized anxiety and post-traumatic stress were largely due to the influence of common dimensions; specific phobia and obsessive–compulsive had large stable unique components; and other syndromes fell in between.
Structural equation model for relationships between wave 1 (right) and wave 2 (left) symptom dimensions in students (a) and patients (b). Error terms for corresponding scales were allowed to correlate across waves (not shown). In students, these correlations were 0.37 (depression), 0.21 (generalized anxiety), 0.39 (post-traumatic stress), 0.36 (irritability), 0.45 (panic), 0.42 (social anxiety), 0.66 (agoraphobia), 0.65 (specific phobia) and 0.34 (obsessive–compulsive); the correlation between mania error terms was not significant, and hence it was constrained to zero. In patients, the correlations were 0.45 (depression), 0.33 (generalized anxiety), 0.41 (post-traumatic stress), 0.58 (irritability), 0.53 (panic), 0.64 (social anxiety), 0.54 (agoraphobia), 0.61 (specific phobia) and 0.64 (obsessive–compulsive). Disturbance of wave 2 factors were correlated (not shown). In students, correlations were 0.50 for distress with fear, 0.54 for distress with bipolar, and 0.56 for fear with bipolar. In patients, correlations were 0.46, 0.67 and 0.32, respectively. Cross-paths from wave 1 to wave 2 factors are not included, as addition of these paths did not improve model fit.

Decomposition of stability correlations a

IMAS, Interview for Mood and Anxiety Symptoms; Total, stability implied by the structural equation model; Shared, stability accounted for by common factors; Unique, stability due to correlated error terms.
a Following Fergusson et al. (Reference Fergusson, Horwood and Boden2006), the shared component of stability was calculated as a product of a syndrome's loading on a common factor at wave 1, loading on the factor at wave 2, and stability of the factor. The unique component was the correlation between error terms multiplied by the mean of a syndrome's residual variances (at wave 1 and wave 2). The stability correlation implied by the model was the sum of common and unique components.
To test the temporal robustness of the structure, we constrained loadings to be equal across waves. This had minimal impact on fit indices: χ2 change was not significant (p > 0.10 in both samples), increase in the AIC and BCC was <4 in the student sample, and relative fit improved in the patient sample. Thus, overall, the structure was highly consistent across the two assessments both with regard to relationships between syndromes and factors (temporal invariance) and to the rank-order of people on factors (temporal stability).
To test generalizability of the resulting structure across populations, we first fit the configural invariance model (same loadings fixed to zero; other paths, factor variances and factor means allowed to differ between samples). The model fit well (Table 3), indicating that the basic structure is invariant. Next, the full metric model constrained all loadings to be invariant across samples, but this decreased model fit significantly [Δχ2(8) = 72.9, p < 0.001; ΔAIC and ΔBCC > 56]. When we relaxed cross-sample constraints on loadings of panic and agoraphobia, absolute fit almost equaled that of the configural invariance model [Δχ2(6) = 13.7, p = 0.033], whereas AIC and BCC increased by only one point, indicating that the greater parsimony of the partial metric model justified the slight decline in fit. We concluded that only panic and agoraphobia behaved differently in patients versus students.
Discussion
The present study extended research on the structure of the emotional disorders in several significant ways. First, it introduced a novel, third-generation measure that combines the strengths of a clinical interview with dimensional assessment. This methodology enabled us to verify and extend previous findings with fully dimensional markers that provide comprehensive coverage of the emotional disorders. Second, the current findings shed new light on the classification of OCD and bipolar disorders. Specifically, our results lent support to the emerging bipolar subfactor and located OCD within the resulting three-factor structure of internalizing psychopathology. Third, this investigation provided novel evidence regarding the short-term stability of the quantitative classification and contributions of spectra versus disorder-specific variance to temporal stability. The structure was consistent over time, both with regard to factor loadings and the rank ordering of people on these factors. Temporal stability was driven primarily by common dimensions for some syndromes (mania, depression, generalized anxiety and post-traumatic stress), but was largely disorder-specific for others (specific phobia and obsessive–compulsive). Fourth, this was the first study to compare the dimensional structure in patient and non-patient populations directly. Our data provided the clearest support to date for the broad generalizability of the quantitative classification, but suggested that some specific details of the structure may differ between populations.
Placement of individual disorders in our samples was largely consistent with previous studies (Krueger & Markon, Reference Krueger and Markon2006; Slade & Watson, Reference Slade and Watson2006; Miller et al. Reference Miller, Fogler, Wolf, Kaloupek and Keane2008; Forbush & Watson, Reference Forbush and Watson2013). This replication with an instrument designed to address key limitations of existing research provides strong support for assumptions made in prior investigations and for their findings. With regard to less-studied conditions, mania was found to define a separate subfactor (Forbush & Watson, Reference Forbush and Watson2013), rather than clustering with distress disorders (Keyes et al. Reference Keyes, Eaton, Krueger, Skodol, Wall, Grant, Siever and Hasin2012). This observation elaborates the basic fear–distress model, indicating that the structure is more complex, and is consistent with genetic, neural and developmental evidence of a distinct bipolar subdimension (Goldberg et al. Reference Goldberg, Andrews and Hobbs2009a ). OCD was linked to both fear (Slade & Watson, Reference Slade and Watson2006; Miller et al. Reference Miller, Fogler, Wolf, Kaloupek and Keane2008) and bipolar dimensions. This connection between OCD and mania may reflect thought disorder features present in both conditions. Indeed, mania has been linked to the thought disorder spectrum – a dimension that includes psychosis and schizotypal personality – previously (Kotov et al. Reference Kotov, Ruggero, Krueger, Watson, Yuan and Zimmerman2011b ; Keyes et al. Reference Keyes, Eaton, Krueger, Skodol, Wall, Grant, Siever and Hasin2012), and OCD has notable associations with symptoms characteristic of this domain (Watson et al. Reference Watson, Wu and Cutshall2004; Chmielewski & Watson, Reference Chmielewski and Watson2008). It will be important for studies of the thought disorder spectrum to investigate this hypothesis.
One noteworthy difference from prior reports (Krueger & Markon, Reference Krueger and Markon2006; Miller et al. Reference Miller, Fogler, Wolf, Kaloupek and Keane2008, Reference Miller, Wolf, Reardon, Greene, Ofrat and McInerney2012; Keyes et al. Reference Keyes, Eaton, Krueger, Skodol, Wall, Grant, Siever and Hasin2012; Forbush & Watson, Reference Forbush and Watson2013) was that panic clustered with distress rather than fear disorders. This discrepancy may be due to how panic disorder was operationalized. Most prior studies analysed panic disorder diagnosis, which is defined by panic attacks and subsequent avoidance, whereas the IMAS measures panic symptoms and agoraphobia separately. Agoraphobia was strongly linked to the fear dimension in this and other studies, and it appears that panic attacks considered independently of avoidance may be more related to distress disorders. In fact, prior studies that assessed panic syndrome separately from agoraphobia also found that it clusters with distress disorders (Watson et al. Reference Watson, O'Hara, Naragon-Gainey, Koffel, Chmielewski, Kotov, Stasik and Ruggero2012; Wright et al. Reference Wright, Krueger, Hobbs, Markon, Eaton and Slade2013). Moreover, biometric research with twins has suggested that the genetic factors underlying panic overlap more with distress than fear (Kendler et al. Reference Kendler, Prescott, Myers and Neale2003).
We observed considerable short-term stability of the internalizing subfactors (average β = 0.80). Importantly, these stability estimates were only marginally greater than 3-year estimates reported previously (Krueger et al. Reference Krueger, Caspi, Moffitt and Silva1998; Fergusson et al. Reference Fergusson, Horwood and Boden2006; Eaton et al. Reference Eaton, Krueger and Oltmanns2011). This pattern is significant by suggesting that observed change largely reflects measurement error rather than true change and consequently the underlying dimensions are extremely stable. However, methodological differences between studies preclude definitive conclusions. A long-term study of the IMAS, or another measure of current psychopathology, is needed to test the degree of true change more rigorously. Assessment mode (telephone versus in-person) may have attenuated stability estimates in the present study, but it had no detectable effect on the factor structure, suggesting that this change had little impact on scores. Overall, we observed impressive temporal stability of the quantitative classification despite assessing current psychopathology.
We also found that a substantial proportion of stable variance is unique to a given syndrome and is not captured by the common dimensions. The proportion of unique variance was 0.36 on average, but greater than 0.70 for some syndromes. All prior longitudinal studies modeled unique stability in at least some disorders, but only Fergusson et al. (Reference Fergusson, Horwood and Boden2006) investigated this issue comprehensively, and they also observed substantial unique stability in some internalizing disorders. Further research on common and unique stable variance may shed light on mechanisms that maintain psychopathology over time and provide important clues regarding which disorders are likely to respond to generic treatment approaches (i.e. conditions maintained primarily by the common dimensions), versus those that may require specialized interventions (i.e. conditions with substantial unique stability). It appears that specialized treatments are most needed for OCD and specific phobia, whereas depression, PTSD and generalized anxiety often can be managed with broad-based interventions. Such data can inform the development of transdiagnostic psychotherapies, an emerging approach to treatment of the emotional disorders (Craske, Reference Craske2012; Reinholt & Krogh, Reference Reinholt and Krogh2014).
The structure showed configural invariance with all syndromes loading on the same factors in both populations. However, more stringent tests identified two differences: panic and agoraphobia were more strongly related to their clusters in patients. It suggests that these syndromes were more influenced by common pathological processes in patients than non-patients. Given that ours is the first study to compare such populations, these findings require replication. Nevertheless, they underscore the value of population comparisons, as this may reveal structural differences with implications for etiology.
The current study followed Lahey et al. (Reference Lahey, Applegate, Waldman, Loft, Hankin and Rick2004) in analysing a third-generation measure, an interview constructed specifically to investigate the structure of psychopathology with dimensional markers. This instrument – the IMAS – promises to enhance structural research by providing a direct interview assessment of symptom dimensions within the emotional disorders. It overcomes several limitations of DSM-centered interviews and self-report questionnaires. Moreover, the IMAS has shown strong psychometric properties with regard to internal consistency, test–retest reliability and discriminative validity, clearly differentiating patient and non-patient populations. In other studies, it also showed excellent convergent and discriminant validity vis-à-vis self-report symptom measures (Watson et al. Reference Watson, O'Hara, Simms, Kotov, Chmielewski, MclityDade-Montez, Gamez and Stuart2007, Reference Watson, O'Hara, Naragon-Gainey, Koffel, Chmielewski, Kotov, Stasik and Ruggero2012; Ruggero et al. Reference Ruggero, Kotov, Watson, Kilmer, Perlman and Liu2014). The IMAS can be useful for a wide-range of research and clinical applications that would benefit from a dimensional assessment of internalizing psychopathology.
The present investigation had several limitations. First, a novel measure designed specifically to evaluate the dimensional classification is a strength of this study, but more research is needed to establish validity of the IMAS. Second, the interview was based on DSM-IV and ICD-10 criteria and did not assess symptoms that are new in DSM-5. Fortunately, the symptom criteria of the emotional disorders remain unchanged from the DSM-IV, with the exception of PTSD, which has undergone a modest revision (i.e. new symptoms related to numbing and hyperarousal). In addition, specific situations have been described for agoraphobia in DSM-5, but all of these situations already are included in the IMAS. Third, DSM-5 has reorganized the emotional disorders into five classes, but we could not model this arrangement, because we had only single markers for the classes containing PTSD and OCD. The latter is particularly significant, because Wright et al. (Reference Wright, Krueger, Hobbs, Markon, Eaton and Slade2013) showed that OCD may form its own factor if multiple indicators are included. Fourth, a single instrument is likely to have some idiosyncrasies and thus provide an imperfect representation of target conditions, potentially biasing the results of structural analyses. Studies that employ a multimodal assessment strategy – for instance, administering the IMAS, a self-report inventory, and a diagnostic interview – would provide a more complete and valid depiction of psychopathology dimensions. Fifth, the present investigation was focused on the emotional disorders, and studies that include a broader range of psychopathology are needed to understand how the identified structure relates to other spectra. For instance, such work can clarify whether the thought disorder dimension underlies the association between mania and OCD. Sixth, it will be important to investigate the cross-cultural robustness of the identified three-factor structure in future research.
Conclusion
In conclusion, this investigation replicated the existence of distress and fear subfactors using fully dimensional markers. The structure was stable across time and between patients and non-patients. The study also helped to establish the presence of a separate bipolar subfactor and to clarify that OCD is linked to both fear and bipolar clusters. Of note, OCD was not completely explained by these factors. Indeed, the majority of reliable variance in obsessive–compulsive syndrome was independent of the common dimensions. Specific phobia also showed this pattern. Additional research is needed to understand the unique components of these two disorders. Finally, although we could not test the DSM-5 organization directly, this study provides evidence that splitting of the emotional disorders across five classes fails to recognize the close links among them. In contrast, the distress and fear clusters can be considered well established and should be incorporated in the diagnostic system.
Supplementary material
For supplementary material accompanying this paper visit http://dx.doi.org/10.1017/S0033291714002815
Acknowledgements
This work was supported by the Feldstein Medical Foundation (grant to R.K.). The authors thank a team of dedicated study interviewers. Special thanks to the team leader, Vanessa Meyer.
Declaration of Interest
None.