


INTRODUCTION
In recent years, anthelmintic resistance in gastrointestinal nematode parasites of livestock has emerged as an important problem worldwide. Multiple-drug-resistant parasites threaten small ruminant industries in many areas of the world, and resistance in parasites of horses and cattle is reaching alarming levels (Kaplan, Reference Kaplan2004). The theoretical gold standard for diagnosing resistance to anthelmintics is achieved by counting the total number of killed worms and live worms following treatment; however, these data can be obtained only by sacrificing the animals, which is unrealistic on a farm. The practical gold standard is to measure changes in the number of eggs being produced by the parasites; these data can be obtained by measuring the number of eggs in a sample of feces. This procedure is called the fecal egg count reduction test (FECRT) and is the most common means of determining whether resistance is present on a farm (Kaplan, Reference Kaplan2002). However, the fecal egg count (FEC) data are a surrogate measurement, which are subject to many sources of variability. Furthermore, the correlation between this surrogate measurement and the number of worms that are actually present in a horse is known to be weak (Lyons et al. Reference Lyons, Tolliber and Drudge1983; Klei, Reference Klei and Herd1986).
In a FECRT, fecal egg counts are compared in the same animals both before and after treatment, or between control and treated groups at some established time-point after treatment. However, there are many sources of animal-related and farm-related variability in FEC data that can impact the interpretation of results, especially when many different farms are being studied. Some of the most important sources of variability are: non-Gaussian overdispersed distribution of parasites in host animals, causing large differences in pre-treatment values between animals on the same farm; differences in parasite infection intensities between farms, causing large differences in pre-treatment values between farms; inherent variability in parasite egg numbers within the fecal output of an animal, which results in the collection of non-uniform samples (Warnick, Reference Warnick1992); variability in fecal egg counts resulting from the non-uniform distribution of eggs in solutions used for fecal egg count analysis; overall health and body condition of animals that can impact drug pharmacokinetics and pharmacodynamics; differences in age, breed, and sex of animals both on and between farms; differences in nutritional programs between farms; spatial differences due to location of farms; and temporal differences resulting from non-uniform sampling times. These cause the FECRT data to be skewed and multi-modal. To overcome the problem of skewness, log and arcsine data transformations have been suggested (Fulford, Reference Fulford1994; Pook et al. Reference Pook, Power, Sangster, Hodgson and Hodgson2002).
Many studies have investigated these issues in sheep and results have been used to develop methods for the experimental design and data analysis of FECRT (Coles et al. Reference Coles, Bauer, Borgsteede, Geerts, Klei, Taylor and Waller1992). Although imperfect, these recommendations are generally accepted by parasitologists as being a useful standard. Unfortunately, virtually nothing has been done to investigate these issues in horses and, therefore, no accepted standards exist for either the design or data analysis of FECRT on horse farms (Kaplan, Reference Kaplan2002). Furthermore, FECRT studies on horse farms are fraught with more severe problems in study design and analysis due to large numbers of horses with FEC of zero, and often only small numbers of horses available to test. Consequently, the study design used for FECRT in horses tends to differ from that used in sheep. In addition, major differences exist between sheep and horses in the biology of the host-parasite relationship. This implies that the metric used to evaluate treatment effect needs to be different for sheep and horses, which merits new statistical methodology.
Parasite burdens in animals are characterized by highly aggregated distributions within host populations (Crofton, Reference Crofton1971; Shaw and Dobson, Reference Shaw and Dobson1995). This overdispersed pattern can be described by the negative binomial distribution (Shaw and Dobson, Reference Shaw and Dobson1995). However, factors responsible for generating these observed patterns of parasite dispersion have not been well described, and although models have been developed, producing a tractable mathematical model for host-microparasite dynamics that allows for both the origins and effects of aggregation is a difficult technical problem (Anderson and Gordon, Reference Anderson and Gordon1982; Grenfell et al. Reference Grenfell, Wilson, Isham, Boyd and Dietz1995). In parasitological investigations in animals, the issue of parasite distribution among hosts can have important effects on the interpretation of data. This is often addressed either by using geometric means to normalize the data set, or by using sufficiently large treatment groups that minimize the effect of aggregation (Fulford, Reference Fulford1994).
The approach for evaluating FECRT data in horses is to examine the arithmetic sample mean for percentage reduction, while some studies have used logarithmic and arcsine transformations before calculating the mean. An arbitrary percentage of either 90% or 95% reduction is often used to declare resistance (Bauer et al. Reference Bauer, Merkt, Janke-Grimm and Burger1986; Coles et al. Reference Coles, Bauer, Borgsteede, Geerts, Klei, Taylor and Waller1992; Craven et al. Reference Craven, Bjorn, Henriksen, Nansen, Larsen and Lendal1998; Varady et al. Reference Varady, Konigova and Corba2000) while some studies have used a reduction of 80% for declaring resistance, with resistance suspected if the percentage reduction is between 80% and 90% (Woods et al. Reference Woods, Lane, Zeng and Courtney1998; Kaplan et al. Reference Kaplan, Klei, Lyons, Lester, French, Tolliver, Courtney, Vidyashankar and Zhao2004).
Such approaches are based on the presumed efficacy of the drug rather than on the true efficacy of the drug at the time of treatment, which is unknown. However, since the correlation between the number of worms killed and the fecal egg count reduction (FECR) is weak and the number of horses is small, the accuracy of these arbitrary assignments of resistance to farms is unclear. Thus what is required is an extensive simulation study, which by design reflects the truth, so that we may begin to understand (1) the role of efficacy in understanding resistance, (2) statistical methods to evaluate efficacy, and (3) the role of variability in understanding efficacy and resistance.
In this paper, first we develop a theoretical framework for understanding resistance and efficacy that is free of distributional assumptions on the egg count distributions. Second we develop a novel bootstrap-based algorithm to assess efficacy, and we compare our methods to the existing approaches using extensive simulations. For this reason we develop several novel simulation models to test our methods. Finally, we show that these models can in turn be used to model FECRT data. To illustrate this, we provide an example using data from 2 horse farms that were part of a larger study on anthelmintic resistance using the FECRT.
Admittedly, the use of simulations to study resistance is not new (e.g. Torgerson et al. Reference Torgerson, Schnyder and Hertzberg2005; Morgan et al. Reference Morgan, Cavill, Curry, Wood and Mitchell2005). However, the focus of the simulations and the methods used to evaluate resistance are new. In particular, we focus on hypothesis testing and the use of bootstrap methodology in this context.
MATERIALS AND METHODS
Modelling efficacy of anthelmintic treatment
FECRT data, as described above, are obtained by counting the number of eggs in a fecal sample from a horse. Let N denote the random variable describing the number of eggs in a fecal sample. Let h(.) denote the probability distribution of N. That is,

Let λ=E(N) denote the population mean of the egg counts in a fecal sample while σ2=Var(N) denotes the population variance of the number of egg counts in a fecal sample.
The effect of treatment is to kill worms and eliminate eggs. However, the FECRT data do not give information about the actual number of worms killed. Thus, if the treatment was efficacious (that is, the worms were killed) then the egg counts would be small, while if the treatment was not efficacious, the egg counts will be large relative to pre-treatment counts. However, the converse may not be true. A low egg count in a sample may not necessarily mean the treatment is efficacious. The small number may be caused due to various factors affecting the egg count.
We say that a treatment efficacy exhibited through FECR is p (0<p<1), if 100×p% of the eggs are eliminated. This does not mean that the true efficacy of the drug is p nor does it say that resistance is (1−p). As mentioned in the introduction, several factors contribute to the efficacy of the treatment and hence it is not easy to diagnose resistance without understanding efficacy.
In this work, we assume that the true efficacy is an unknown parameter. We remark that even though the true efficacy is p, this does not mean that in every fecal sample 100×p% of eggs will be eliminated. The actual variability and the sample size could lead to variations around that number. It is often the case that in small sample size experiments with ‘high’ efficacy, there would be differences between the observed efficacy and the true efficacy. Thus without a statistical procedure, it is impossible to identify and evaluate the true efficacy of the treatment. The question of diagnosing resistance is related to hypothesis testing concerning efficacy but is more complicated.
The post-treatment egg count is modelled based on the pre-treatment egg count. Let N denote the random variable describing the pre-treatment egg count. Then the post-treatment egg count is modelled as a binomial distribution with the parameters pre-treatment egg count number and the efficacy, that is

where G is an integer valued random variable with population mean λ and population variance σ2. The above model is based on the assumption that given the pre-treatment egg count, the elimination process acts independently on the existing eggs. This is definitely a simplifying assumption but helps illustrate the concepts. The above modelling implies that the expected post-treatment egg count is λ(1−p). The variance of the post-treatment egg count is

Frequently, N is modelled to be a Poisson random variable with mean λ. In this Poisson case, the variance of the post-treatment egg count reduces to λp(1−p)+λ(1−p)2, since for the Poisson distribution mean=variance=λ.
Due to the aggregation phenomenon present in the FEC data, the negative binomial distribution (Cornell, Reference Cornell2005) has been suggested as an alternative to model the fecal egg counts. The negative binomial distribution has 2 parameters, namely, the mean λ and the negative binomial constant r. The probability distribution is given by

where Γ is the gamma function. The mean of the negative binomial distribution is λ and the variance is  . Thus, in this case, the variance of the post-treatment egg count becomes
 .
Thus, the variance of the post-treatment egg count critically depends on the statistical model used for the pre-treatment egg count. However, the number of horses available to check the appropriateness of this modelling assumption is too small. Hence, if the assumed model for the pre-treatment egg count is incorrect, the resulting inference concerning the true efficacy of a drug and the resistance would be incorrect. Therefore, it is imperative to have a statistical methodology that is independent of the distributional assumptions on the egg count distributions.
Statistical issues for single farm data
Let us describe the data set from a single farm containing M horses with a positive pre-treatment egg count. Let N i and Y i denote the number of eggs in a fecal sample taken from the horse i before and after the anthelmintic treatment, respectively. Then X i=N i−Y i represents the change in the number of eggs. We will assume that the pair (N i, Y i) are independent and identically distributed random variables and that the effect of treatment on all the horses on the farm are the same. The meaning of this assumption is that the pair (pre-treatment egg count, post-treatment egg count) has the same statistical distribution for all horses in a given farm; and the outcome for a particular horse is statistically independent of the outcome from any other horse in the same farm. However, the realized values of Y i will depend on N i. Let p i denote the efficacy of the treatment on horse i. Our assumption that the effect of treatment (i.e. proportion of worms killed) is the same for all horses on a farm implies that the probability of eliminating the worm eggs is also the same for all horses on the farm. This assumption allows us to set p i=p for all 1⩽i⩽M. Much of the work in this paper deals with estimation and hypothesis testing concerning p.
To address the practical question of identifying and diagnosing resistance, one needs to provide a statistical estimate of p and test the hypothesis concerning p using the data (N 1,Y 1),…(N M,Y M). We estimate p using the formula

This is an unbiased estimate of p and is also a consistent estimator of p (Casella and Berger, Reference Casella and Berger2001). The differences in the pre-treatment egg counts of horses are attributed to natural variation and hence the randomness of the pre-treatment egg counts yields unbiasedness of  . Let us call the quantity
 the empirical efficacy from horse i. The above estimate of p, namely , is an average of the empirical efficacies calculated from each horse. The empirical efficacies from each horse take into account the differential number of worms in horses. If the horse i has a smaller number of worms, this will correspond to smaller N i and this will lead to giving higher weight to the horse i. However, the variability from this horse will also be larger since
 . Thus the estimator of the true efficacy can be viewed as a weighted average of the change in egg counts in horses, the weights being
 . Furthermore, the population variance of this estimator is given by
 , where θ is the population mean of the inverse of the pre-treatment egg counts. It is usually very difficult to calculate θ even for some well-known distributions. Our bootstrap methodology described in the following section describes a scheme that avoids this issue for a very general class of distributions. We reiterate that the properties of the estimator of p, namely , defined in (5) above, hold without any assumption concerning the distribution of the pre-treatment fecal egg count data.
Alternatively, one could consider the following unbiased estimator

This estimator assumes that there is no variability between the horses, and does not allow the modelling of variability. The estimator 1 is the maximum likelihood estimator of p if there is no variability between the horses.
We now turn to hypothesis testing concerning p. Let H 0 and H 1 denote the null and the alternative hypotheses concerning p, respectively. The null hypothesis for p is a statement concerning the possible value of p. The alternative hypothesis, as the name indicates, states alternative values for p and is the research hypothesis. Typically, one tests if the null hypothesis can be rejected in favour of the alternative (research) hypothesis using the data. Testing of the hypothesis leads to acceptance or rejection of the null hypothesis which could be in error. In fact, there are two types of error that can arise and these are called Type I and Type II error. We now briefly discuss the terms Type I error and Type II error.
Type I error is caused by rejecting the null hypothesis H 0, when H 0 is true; while Type II error is caused by not rejecting H 0 when the alternative hypothesis H 1 is true. Let the null hypothesis concerning the percentage reduction be H 0:p=p 0. Let T n denote the test statistic for testing H 0. The rejection region for testing H 0 is given by [T n>c] where c is so chosen that P(T n>c|H 0)⩽α, where P(.|H 0) is the probability when the null hypothesis is true. Since c depends on α, we will write c α to denote c. Furthermore, since the null hypothesis is true implies p=p 0, the Type 1 error rate can be expressed as  . The power of a test is then P p(T n>c α), which we denote by βn(p).
The number p 0 is the presumed efficacy of the drug at the time of treatment. For instance, it is believed that ivermectin is 99·9% effective. In this case, one takes p 0=0·999. In general, the value of p 0 can be obtained either from historical data or regulatory records.
Thus, when testing the hypothesis concerning p for a single farm, one is testing if the treatment is as efficacious as suggested in that farm using the data. A veterinary advisor will typically be interested in the answer to this question, which would help in making appropriate drug selection and drug treatment decisions.
Multiple farms
Frequently, a regulatory agency, a scientist or a veterinarian is interested in understanding if a particular treatment has certain levels of efficacy before suggesting the treatment for widespread use. In these situations, it is important to test the hypothesis concerning p using data from several farms. This will help in identifying the overall efficacy rate of the treatment. The data set in this case is a collection of single farm data from several farms. More formally, let R denote the number of farms and M i denote the number of horses with positive egg count from farm i. Let N ij and Y ij denote the number of eggs in a fecal sample taken from the horse j before and after anthelmintic treatment, respectively. Let X ij=N ij−Y ij. Then, X ij represents the number of eggs eliminated by treating the j th horse on the i th farm. The effect of anthelmintic treatment on horses within the farm is the same but could differ between farms. We will denote by p i the true efficacy of treatment on the i th farm.
Statistical models for multiple farms
A parsimonious model for modelling the variability between farms is to assume that the efficacies for each farm p i's are independent and identically distributed (i.i.d.) random variables taking values between 0 and 1. More precisely, let p i, 1⩽i⩽R denote independent random variables from a distribution h(.). Conditionally on p i, N ij, we model Y ij to be binomially distributed with parameters N ij and p i. Symbolically,

where p i's are independent random variables taking values on (0, 1) with distribution h(.) and N ij are i.i.d. distributed integer valued random variables from the distribution G i. h(.) is called the mixing distribution. Our methodology for assessing the overall efficacy does not require any distributional assumption on G i. The model described above is the so-called generalized mixed model. We now specify 2 important special choices for h(.), namely the beta distribution and the logit-normal distribution.
Beta-binomial model
In this model we assume that p i, 1⩽i⩽R are i.i.d. with a beta distribution with parameters δ1 and δ2; that is, the function h(.) is the density function of a beta random variable with parameters δ1 and δ2. Under this assumption, (McCulloch and Searle, Reference McCulloch and Searle2001)

while,

Our model induces correlations in the changes in the egg counts in the fecal samples from different horses from the same farm. When N ij and N ik are equal to 1, the correlation can be explicitly obtained using the formula

In the case when they are not equal to 1, the correlation is given by a complicated mathematical expression involving N ij and N ik. The overall proportion reduction is now given by E(p i) and our hypotheses concern the values taken by the ratio  .
Logit-normal model
Frequently, it is difficult to model p to take values between 0 and 1. For this reason, one models  to have a normal distribution. The function
 is called the logistic function and the resulting model is called the logit-normal model. Symbolically,

This model does not have closed form expressions for the mean and the variance of p i, but can be computed using numerical or Monte-Carlo algorithms (McCulloch and Searle, Reference McCulloch and Searle2001). Standard software like SAS (Proc NLMIXED and PROC GLIMMIX in version 9.1) produce estimates for the mean and variances.
Proposed methods for assessing efficacy
As mentioned in the Introduction section, assessing the efficacy of treatment using FECRT data is challenging due to the fact that it exhibits patterns of aggregation, multi-modality and skewness. In this section, we propose 2 new methods for analysing FECRT data sets. We also describe the correct method to implement the arcsine transformation and the logarithmic transformation methods. Whereas the arcsine and logarithmic transformation methods require that assumptions be made about the nature of the pre-treatment egg count distribution, the bootstrap methods do not require any distributional assumptions.
Bootstrap Method 1 for a single farm
Using the notations from above, note that the pre-treatment data are {N 1, N 2, …, N M} while the post-treatment data are {Y 1, Y 2, …, Y M}. The estimator of p as given in (5) is

We now describe our bootstrap algorithm to test the null hypothesis concerning p, namely test H 0:p=p (Efron and Tibshirani, Reference Efron and Tibshirani1993). Let B denote the number of bootstrap samples. In this algorithm, we keep the pre-treatment data fixed throughout the algorithm, namely, pre=[N 1, N 2, …, N M].
1. Set k=1.
2. Generate post-treatment bootstrap sample for the i th horse by simulating post-treatment data from binomial distribution with parameters N i and p 0. We repeat this process for all the horses yielding the k th bootstrap sample of post k*={Y 1k*, Y 2k*, …, Y Mk*}. Define, for 1⩽i⩽M, X ik*=N i−Y ik*.
3. Define
 .
4. Calculate the test statistic
, where (McCulloch and Searle, Reference McCulloch and Searle2001).5. Increment k by 1.
6. If the new value of k is less than B return to step 2. Else stop.
 .
 , where
 (McCulloch and Searle,
The distribution of the bootstrap samples T*(1),…,T*(B) is called the bootstrap distribution and can be used to approximate the distribution of the test statistic  . The inference for p is now based on this bootstrap distribution. For instance, the p-value of the test can be obtained as the probability, calculated under the bootstrap distribution, that the test statistic takes values at least T n. The confidence interval can similarly be obtained using the quantile points from the bootstrap distribution.
The above algorithm is repeated 5000 times to evaluate the Type I error and the power of the proposed methodologies.
Bootstrap Method 2 for a single farm
The main difference between the bootstrap Methods 1 and 2 is that in Method 2 we do not hold the pre-data fixed. This offers a degree of robustness to the statistical distribution of the pre-treatment egg count data. Instead, we obtain bootstrap samples for the pre-data and use these along with the bootstrap Method 1 to construct confidence interval for p. The actual steps of the algorithm are as follows:
1. Set k=1.
2. Generate pre-treatment bootstrap samples by sampling from {N 1, N 2, …N M} with equal probability. Let us denote the pre-treatment bootstrap sample by
(11)3. Now repeat the steps 2 through 6 of the bootstrap Method 1 where N i is replaced by N ik*.

Confidence intervals and tests of hypotheses are constructed exactly as in the bootstrap Method 1 using the *(k) constructed in the present algorithm.
Bootstrap methods for multiple farms
In the case of multiple farms, one first obtains the efficacy of each farm and repeats the bootstrap methods 1 or 2 for each farm. Finally, an appropriate model is fit using the bootstrap estimates to obtain the overall efficacy rate and the confidence interval for the overall efficacy rate.
Other methods
In this section we describe other methods that have been used to test hypotheses concerning p and which we used to compare our bootstrap methods. The methods that we focus on include t-test, t-test after arcsine transformation and t-test after a log transformation. The value of is obtained using the formula (5) for single farms. In the case of multiple farms, can be obtained using the standard statistical software like SAS (Proc GLIMMIX, Proc NLMIXED).
The t-test
The standard t-statistic for testing H 0:p=p 0, is given by

where γM is defined as above. It is well known that, under the null hypothesis, t is approximately distributed as a t-distribution with (M−1) degrees of freedom. Therefore, the rejection region is  , where
 is the critical value corresponding to the Type 1 error rate of α.
Arcsine transformation
The test statistic, to test H 0:p=p 0, corresponding to data transformed using arcsine transformation is

where t is approximately distributed as a t-distribution with (M−1) degrees of freedom. The denominator of the above test statistic is actually a first order approximation to the variance of the numerator obtained using the delta method. Even though the denominator of the above expression does not involve p, the second and higher order terms involve p. Therefore, the rejection region is , where is the critical value corresponding to the Type 1 error rate of α.
Log transformation
The test statistic, to test H 0:p=p 0, corresponding to data transformed using log transformation is

where  =1− and t is approximately distributed as a t-distribution with (M−1) degrees of freedom. Therefore, the rejection region is , where is the critical value corresponding to the Type 1 error rate of α.
Throughout this paper we will choose α=0·05 and B=2000.
Simulation models and methods for single and multiple farms
In this section, we describe our basic setup for performing simulations. We adopted a setup that reflects the reality as closely as possible. In the discussions below, the means (λ) used for the simulations correspond to the observed raw egg counts. The number of eggs per gram (EPG) of feces is then obtained using the formula sensitivity×λ. In our lab sensitivity=5.
Single farm
In several of the resistance studies on horse farms investigated by the authors, data with a very small to moderate pre-treatment fecal egg count was common. For this reason, the pre-treatment data were generated from a Poisson distribution with mean λ, where λ=2 and negative binomial distribution with λ=60 and r=60. These numbers correspond to the 60 and 300 EPG. We also performed simulations in farms with large to very large pre-treatment egg counts. These included data from Poisson distribution with λ=100 and λ=500 and negative binomial distribution with λ=250 (r=250), λ=500 (r=500), and λ=1000 (r=1000). These correspond to between 500 and 5000 EPG of feces. Since the number of horses per farm was small, we chose 8 horses per farm. This yields pre-treatment data N 1, N 2, …, N 8. Since the Type I error rate is defined to be the probability of rejecting H 0 when H 0:p=p 0 is true, the post-treatment data were generated, for the i th horse, using a binomial distribution with parameters (N i, p 0). Based on the pre-treatment and post-treatment data, bootstrap confidence intervals were constructed using B=2000 bootstrap samples. The Type I error rate was calculated to be the percentage of times the null hypothesis was incorrectly rejected amongst the several simulated data sets. All our results are based on 5000 simulations. Type I error rate was evaluated at p 0=0·90, 0·92, 0·95, 0·97, and 0·98 for the Poisson distribution and p 0=0·9, 0·92, 0·95, 0·98, and 0·99 for the negative binomial distribution.
Multiple farms
In this case our simulation results are based on 10 farms and 8 horses per farm. The pre-treatment data for each horse in a farm are simulated from a Poisson distribution with λ=12. The post-treatment data are simulated using the beta-binomial model and the logit-normal, respectively. The Type I error rate was calculated to be the percentage of times the null hypothesis was incorrectly rejected amongst the simulated data sets. All the results were based on 5000 simulations and the Type I error was evaluated at p 0=0·80, 0·85, 0·90, 0·95, and 0·98. These p 0 values represent the population averages and the actual efficiency varied between farms around p 0.
Simulated power
The power of the proposed bootstrap methods and other methods can be obtained using the simulations. To calculate the simulated power, the post-treatment data are simulated using the probability in the alternative hypothesis and the bootstrap power is defined to be the proportion of times the false null hypothesis is rejected amongst the simulated data sets.
RESULTS
Results for Type I error rate
Table 1 presents Type I error rate results for the proposed bootstrap methods and other methods for data from a single farm for various values of the pre-treatment egg count mean. From the table it is clear that the Type I error rates are close to the nominal 5% level for the bootstrap method while for all other methods the Type I error rates are less than the nominal 5% level, as long as the mean raw pre-treatment egg count is greater than 60. If the pre-treatment egg count is small, then bootstrap methods still yield optimal Type I error rates if the true efficacy is less than or equal to 95%. However, for larger efficacy rates while bootstrap methods yield lower Type I error rates, other methods yield higher Type I error rates. Results in Table 2 show that if the variability is not taken into account in the analysis, Type I error rates increase for all the methods.
Type I error rates for a single farm at varying levels of H 0 for five analysis methods examined

Column 1 represents the distribution with which the pre-data are generated.
Column 2 represents null hypothesis values of p.
Type I error rates for both single farm and multiple farms at varying levels of H 0 for five analysis methods examined
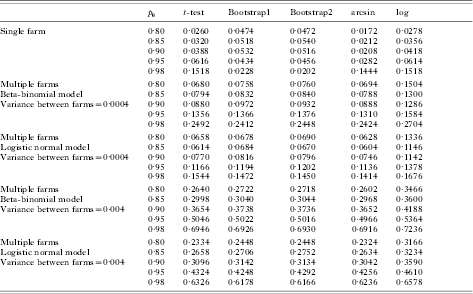
Column 2 represents null hypothesis values of p.
Pre-data are generated from the Poisson distribution with λ=12.
Power results
Table 3 presents the power analysis for a single farm data when the mean of the pre-treatment raw egg count distribution is 60 or equivalently 300 eggs per gram (EPG) of feces. The results clearly show that both the bootstrap methods have substantial power to detect changes close to the null hypothesis as compared to the other methods. Tables 4 and 5 give the simulated power results for data from multiple farms with different distributions for variability. Again these results demonstrate that the bootstrap method has ‘reasonable’ power to detect differences from the null hypothesis.
Power function for a single farm at varying levels of the true efficacy rate p

Pre-data are generated using negative binomial distribution with λ=60 and r=60.
Power function for multiple farms with data generated using the beta-binomial model at varying levels of the efficacy rate p

Shaded row represents the Type I error rate.
Column 1 represents the variance between farms.
Pre-data are generated from the Poisson distribution with λ=12.
Power function for multiple farms with data generated using the logistic normal model at varying levels of the efficacy rate p

Shaded row represents the Type I error rate.
Column 1 represents the variance between farms.
Pre-data are generated from the Poisson distribution with λ=12.
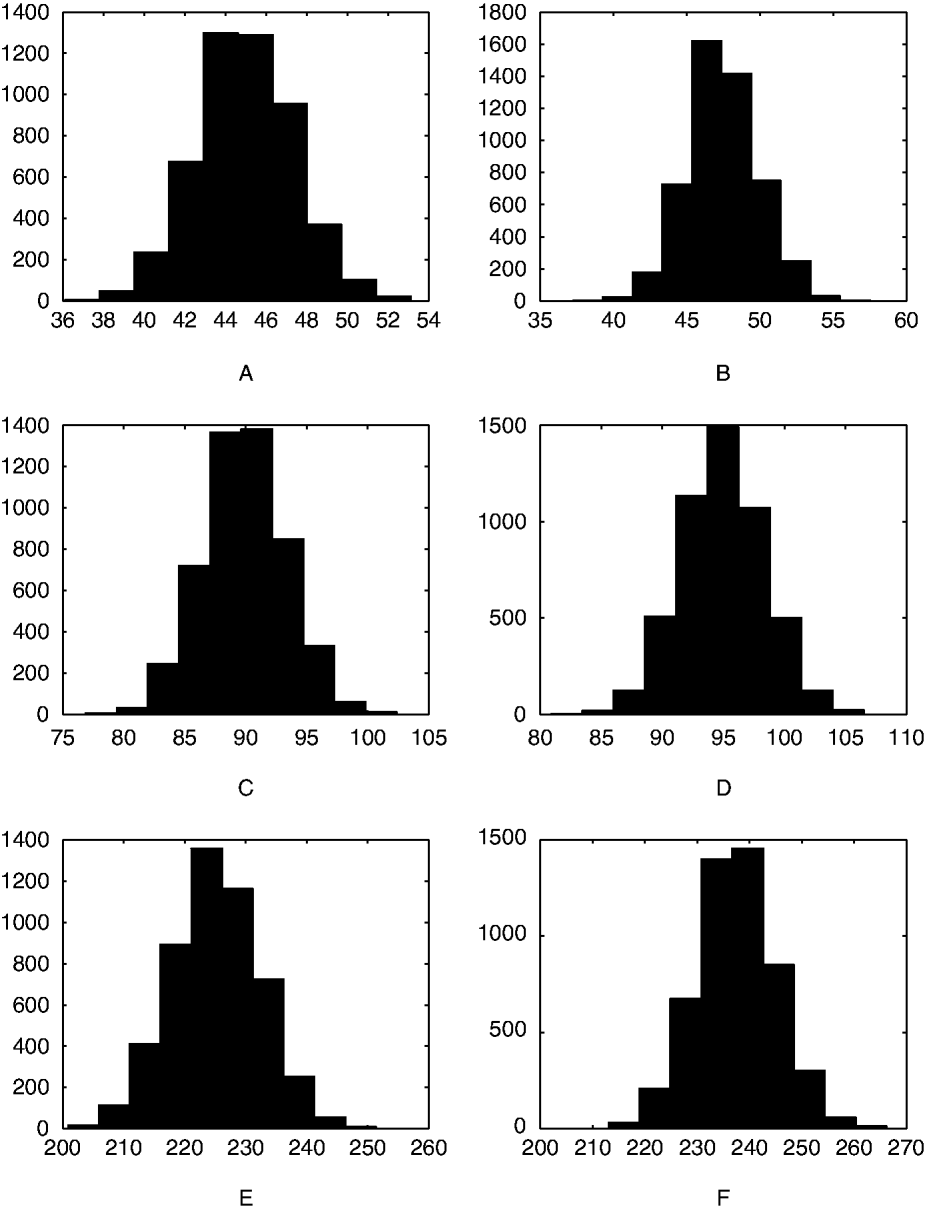
Figure 1 shows that the distribution of the change in egg count has an approximately similar shape for various efficacy levels and for various pre-treatment egg count mean levels. This shows why detecting even 5% change in efficacy is such an arduous task in these data.
Histograms of the simulated distribution of pre-treatment egg counts minus post-treatment egg counts. The pre-treatment egg counts were generated using various distributions, under the following true efficacy rates: (A) Poisson (λ=50), p=0·9; (B) Poisson (λ=50), p=0·95; (C) Poisson (λ=100), p=0·9; (D) Poisson (λ=100), p=0·95; (E) Negative Binomial (λ=250, r=250), p=0·9; (F) Negative Binomial (λ=250, r=250), p=0·95.
Real data example
In this section we analysed a real data set that was collected as part of a study on anthelmintic efficacy across various farms in the southeastern United States (Kaplan et al. Reference Kaplan, Klei, Lyons, Lester, French, Tolliver, Courtney, Vidyashankar and Zhao2004). For this illustration, we focused on the farms in the state of Louisiana. Nine farms were included in the Louisiana study and horses on each farm were assigned randomly to one of several anthelmintic treatments. One of the treatments was ivermectin. We analysed the data for all the 9 farms. All of the farms except ASHU and EHS had 100% reduction. Hence, p-values and confidence intervals are provided for only ASHU and EHS. On the farms with 100% reduction, since there is no variation in the data, the lower and upper confidence limits coincide and equal 1. The 95% confidence intervals and p-values for test of H 0:p=0·98 are given in Table 6.
Analysis of Louisiana farms for horse data

Treatment is ivermectin.
p-value is calculated under the null hypothesis H 0: p=0·98.
The bootstrap confidence interval for percentage reduction for ASHU farm is (0·962, 0·971) indicating, perhaps, the beginning stages of resistance, while that of EHS is (0·995, 1·0) indicating that the efficacy was very high. However, for the ASHU farm, the confidence interval that takes into account the variability between farms was determined to be (0·992, 0·999) yielding that there were no initial stages of resistance. To validate these results, the experiment was repeated at the ASHU farm for ivermectin using an increased number of horses and no resistance was detected.
DISCUSSION
The work presented in this paper addresses 4 fundamental issues. First, development of a statistical model for understanding efficacy. Second, methods to analyse efficacy on farms with small pre-treatment egg counts with small number of horses. Third, the role and desirability of data transformations; and fourth, the impact of variability between farms on the accurate measurement of efficacy.
Our theoretical framework assumes a conditional independence model for elimination of eggs and clarifies differences between resistance and efficacy. A population model is assumed and all statistical analyses are made relative to the assumed population model. The role of variability in the initial egg count is brought out and its impact on assessing efficacy is studied.
FECRT data exhibit various peculiarities that make analysis particularly challenging and, for a number of reasons described previously, these difficulties are magnified in horses. Bootstrap methodology is a theoretically sound technique for performing inference with minimal assumptions on the statistical distribution of the data. The method is especially applicable to small data sets, namely data sets with small pre-treatment egg counts and few horses per farm, since one can approximate the sampling distribution of the test statistic by simulating a large number of bootstrap samples. Furthermore, the methodology is easily adaptable and implementable in complex problems involving complicated models since, unlike the other methods presented, bootstrap methods do not require calculation of the variance of the statistic as was shown in the previous section. All that is needed is to generate data from the specified model, and then calculation of the test statistic.
When studying resistance on a single farm, our results convincingly showed that bootstrap methods perform optimally both in terms of Type I error and the power, even when the pre-treatment egg counts are small. On farms with large pre-treatment egg counts, it is believed that t-tests would work well, since the t-distribution is ‘well’ approximated by the normal distribution. The statistical reason behind this belief is the so-called central limit theorem (Billingsley, Reference Billingsley1995), which states that as the sample size n increases without bound, the difference in the probabilities calculated using the t-distribution with n degrees of freedom and the normal distribution decreases to 0. However, how fast the difference goes to 0 depends on the values of p 0. This phenomenon is well explained by our results in Tables 1 and 3.
The problem of assessing efficacy of treatment on farms with small egg counts is very difficult. Even on farms with mean egg counts of 100 or 200, it is hard to detect even a 5% drop in efficacy with 8 horses. This leads to a substantial difference in the presumed efficacy and the true efficacy of the treatment. A practical consequence of this effect is that resistance, if properly defined, will go undetected in many instances. The variability in the pre-treatment egg count compounds the problem and in some cases even a 10% drop in treatment efficacy can go undetected. Figure 1 reiterates this phenomenon.
When performing FECRT in horses, arbitrary minimum EPG cutoffs are typically used for accepting horses into the study. The logic used is that higher EPG will yield a more accurate measurement of efficacy. However, results of simulations challenge the validity of this logic. These simulation data demonstrate that reductions in fecal egg counts are inherently highly variable, causing difficulty in assessing the true efficacy. We can see that this phenomenon changes little as the EPG changes from 60 to 5000. The practical significance of this finding is that it is very difficult to distinguish a true egg count reduction of 90% from that of 95% when testing only small numbers of horses. Consequently, our results suggest that it is preferable to include as many horses as possible in a FECRT, even those with low EPG, and to use a more sensitive assay for measuring EPG.
In the context of multiple farms, our results clearly show that the variability between farms will have to be taken into account to detect efficacy. Not accounting for the variability usually leads to increased Type I error. The practical significance of this phenomenon is a more frequent, albeit incorrect, diagnosis of resistance leading to an overestimation of resistance prevalence.
The models introduced in this paper, namely the beta-binomial model and the logit-normal model, can be used to model variability between farms. With the help of these models one can estimate the true efficacy and perform hypothesis tests along the methods presented in the Materials and Methods Section. As mentioned previously, when performing hypothesis tests, the bootstrap method is significantly easier since it only requires simulating data according to the fitted model, unlike other methods which require complicated calculations to determine the variance.
Finally, using our theoretical framework it is possible to introduce a notion of resistance based on the estimate of efficacy and the presumed efficacy. In our limited simulation study, we see that large number of horses per farm are required before making unequivocal statements concerning resistance. We are currently addressing these and other pertinent issues using a number of different statistical approaches with the goal of improving our understanding of efficacy, and our understanding of how to make an accurate diagnosis of resistance on the basis of fecal egg count data.



