Migmatitic suites of rocks are poorly constrained in terms of the exact physico-chemical processes governing their formation (Loberg Reference Liu, Peskin, Muzzio and Leong1963; Yardley Reference Whitney1978; Johannes Reference Johannes and Gupta1988; Whitney 1992; Sawyer Reference Saikia, Gogoi, Kaulina, Lialina, Bayanova, Ahmad, Pant and Dasgupta2008). One of the central problems associated with migmatisation is whether such rock is a product of primary material and those derived from elsewhere (i.e., an open system) or the product of differentiation in situ (i.e., a closed system). These two endmembers of systems have led to a number of contrasting schools of thought for explaining the possible mechanisms for the migmatisation process. These can be summarised as: (a) injection of igneous or foreign magmas, usually with granitic compositions (Sederholm Reference Sarkar1913, Reference Sawyer1934; Pitcher & Berger Reference Perugini, De Campos, Ertel-Ingrisch and Dingwell1972) that generally produces injection gneiss, arterite and lit-par-lit gneiss; (b) metamorphic segregation at subsolidus temperatures involving both chemical and mechanical processes (Robin Reference Pitcher and Berger1979; Ashworth & McLellan Reference Ashworth, Mclellan and Ashworth1985; Trumbull Reference Sederholm1988), where migmatisation involves preferential segregation without melting occurring in an originally homogenous rock, forming bands of contrasting mineralogical composition during high-grade metamorphism; (c) mass transfer through the injection of externally derived (metasomatic) fluids under subsolidus conditions (Misch Reference Mehnert1968; Olsen Reference Morgavi, Perugini, De Campos, Ertel-Ingrisch and Dingwell1985; Babcock & Misch Reference Babcock and Misch1989), which involves a process wherein chemical changes in a rock are brought about by hydrothermal and other fluids at a constant temperature near to the appropriate solidus temperature; (d) partial melting or anatexis (Winkler Reference Weinberg and Searle1961, Reference White, Pomroy and Powell1979; Mehnert Reference Mclellan1968; Turner Reference Simmons and Webber1968; Matthes et al. Reference Loberg1972; Ashworth Reference Ashworth1976; Henkes & Johannes Reference Henkes and Johannes1981; Johannes & Gupta Reference Johannes1982) is another favourable process considered to be responsible for the origin of leucosomes and melanosomes in migmatic rocks through partial melting of the parent rock.
However, as the mechanism of migmatisation itself is a highly chaotic process, it is highly possible that more than one mechanism can interfere and operate within individual migmatite belts (cf. Yardley Reference Whitney1978). The possible mechanisms for migmatite generation are summarised in Table 1.
Possible mechanisms for migmatisation.

The quartzofeldspathic (leucocratic) masses present as veins in the migmatitic rocks often contain viscous folding, which is a phenomenon where a thread or thin filament of fluid forcing through a relatively high viscous fluid experiences buckling instability owing to large viscosity contrast between the two fluids (Cubaud & Mason Reference Cubaud and Mason2006A, Reference Cubaud and MasonB, Reference Cubaud and Mason2007A, Reference Cubaud and MasonB, Reference Cubaud and Mason2008; Chung et al. Reference Chung, Choi, Kim, Ahn and Lee2010; Darvishi & Cubaud Reference Darvishi and Cubaud2012). These folded veins play a key role in transporting mineral phases from the felsic zones to the mafic zones in a migmatitic terrain of rock. Such veins or filaments have been extensively documented in laboratory experimental studies dealing with different types of chaotic mixing in magmatic systems (De Campos et al. Reference De Campos, Perugini, Ertel-Ingrisch, Dingwell and Poli2011; Perugini et al. Reference Perugini, De Campos, Dingwell and Dorfman2012; Morgavi et al. Reference Misch2013; Perugini et al. Reference Ottino, Leong, Rising and Swanson2013). The experiments conducted in a mechanical journal bearing system have received significant attention, where melts with varying viscosities are mixed in controlled environments under chaotic dynamical conditions. The mixing during the course of experiments leads to the development of filaments at several length scales as a result of stretching and folding dynamics, which are the fundamental physical processes, and, more crucially, the basic forces governing the mechanical mixing of two (or more) fluids involving chaotic dynamics (Ottino Reference Olsen and Ashworth1989). The growth of folding instabilities in these filaments leads to the exponential increase in contact area between the interacting fluids. Such instabilities, in turn, enhance chemical exchange between the two fluids through diffusion, and significantly help in the mechanical mixing. Chaotic mixing has been established to be a very potent mechanism to mix even highly viscous silicate melts, when there are sufficiently large viscosity contrasts (Perugini et al. Reference Perugini, De Campos, Dingwell and Dorfman2012). Fluid mixing processes by chaotic dynamics and, as such, chaos theory have been a subject of intense research in recent times (Liu et al. Reference Leake, Woolley, Arps, Birch, Gilbert, Grice, Howthorne, Kato, Kisch, Krivovichev, Linthout, Laird and Mandarino1994; Aref & El Naschie Reference Aref and El Naschie1995; De Campos et al. Reference De Campos, Perugini, Ertel-Ingrisch, Dingwell and Poli2011; Gogoi & Saikia Reference Gogoi and Saikia2018).
The phenomenon of viscous folding and its importance in enhancing mixing between two fluids of different viscosities has frequently been demonstrated in microfluidic experiments (Cubaud & Mason Reference Cubaud and Mason2006A, Reference Cubaud and MasonB, Reference Cubaud and Mason2007A, Reference Cubaud and MasonB, Reference Cubaud and Mason2008; Chung et al. Reference Chung, Choi, Kim, Ahn and Lee2010; Darvishi & Cubaud Reference Darvishi and Cubaud2012). Such experiments provide a powerful platform to investigate the nature of interaction between fluids of varying viscosities (e.g., aqueous glycerol solutions, silicone polymers (i.e. polydimethylsiloxane) and isopropanol alcohol) operating at a microscale. In microfluidic experiments, filament of a high-viscosity fluid is allowed to pass through a low-viscosity fluid in a plane microchannel to study the nature of fluid interaction dominated by viscous and capillary forces. When the high-viscosity fluid threads into the low-viscosity fluid, the former experiences compressional stress generated by the viscosity contrast between the two mediums and undergoes folding. This instability reduces the velocity of the high-viscosity fluid, but significantly increases the interfacial area between the two interacting fluids, which enhances chemical diffusion and promotes mixing between the disparate phases. Such processes have been reported to operate in different rocks, enhancing mixing between natural silicate melts with large viscosity contrasts (Gogoi & Saikia Reference Gogoi and Saikia2018).
There are a significant number of experimental works that used natural silicate melts to study chaotic mixing at high temperatures, analogous to several geological processes (De Campos et al. Reference De Campos, Perugini, Ertel-Ingrisch, Dingwell and Poli2011; Perugini et al. Reference Perugini, De Campos, Dingwell and Dorfman2012; Morgavi et al. Reference Misch2013; Renggli et al. Reference Perugini, De Campos, Dingwell and Dorfman2016). The behaviour of chaotic mixing experiments involving high-viscosity melts at high temperatures (De Campos et al. Reference De Campos, Perugini, Ertel-Ingrisch, Dingwell and Poli2011) were quite similar to the patterns produced by the mixing of low-viscosity fluids at room temperature (Ottino et al. Reference Ottino1988). This suggests that the chaotic mixing is not exclusively controlled rheologically or thermally, and, thus, the results of low-viscosity fluids at low temperatures can be applied to investigate the behaviour of high-viscosity melts at high temperatures. A major limitation associated with the fluid dynamics experiments is that the effects of inclusions (i.e., crystals present in silicate magmas) are not considered during the experiments. However, it is very important to include crystals in such experimental studies (Perugini et al. Reference Perugini, De Campos, Dingwell and Dorfman2012). The present study investigates this focused topic of the crystal-rich magma mixing observed in the migmatic rocks of the Chotanagpur Granite Gneiss Complex (CGGC), India. We have used robust mineral chemical data, along with the results disseminated by recent microfluidic and chaotic mixing experimental works. This approach has enabled us to offer a possible explanation for the physico-chemical processes of chaotic mixing and their implication in controlling the process of migmatisation.
1. Geological setting and field relationships
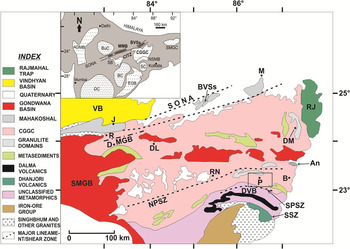
The CGGC is a Proterozoic high-grade metamorphic terrain covering an area of ca.80,000 km2. The CGGC is dominantly characterised by amphibolite to granulite facies rocks juxtaposed between the metasediments and metavolcanic rocks of the North Singhbhum Mobile Belt to the S (Saha Reference Robin1994; Ghose & Chatterjee Reference Ghose, Chatterjee, Srivastava, Sivaji and Chalapathi Rao2008) and metasediments, granitoids and mafic-ultramafic rocks of the Bathani volcano-sedimentary sequence to the N (Saikia et al. Reference Roy2014; Saikia et al. Reference Saikia, Gogoi, Ahmad, Kumar, Kaulina, Bayanova and Mondal2017; Saikia et al. Reference Saha2019). To the E, the CGGC is separated from the Shillong Meghalaya Gneissic Complex by the Quaternary Gangetic Alluvium (Chatterjee et al. Reference Chatterjee, Mazumdar, Bhattacharya and Saikia2007). The western margin of the CGGC is covered by the younger Gondwana sediments of Mahanadi graben, which separates it from the Central Indian Tectonic Zone (Fig. 1). The dominant foliation trend reported from most parts of the CGGC is ENE–WSW, except in the north-eastern part, where the trend is NNE–SSW (Bhattacharyya Reference Bhattacharyya1975). The gneissic terrain has undergone three phases of deformation, giving rise to three distinct fold patterns (F1, F2 and F3) and related linear fabric (Roy Reference Renggli, Wiesmaier, De Campos, Hess and Dingwell1977). The first phase of deformation is marked by the generation of isoclinal folds. The first phase was followed by the second phase of folding, which produced antiformal and synformal structures. The third phase of deformation affected the earlier folds producing structural domes and basins. The CGGC is dominated by granitoid gneisses and migmatites, and enclaves of different sizes, compositions and metamorphic grades occur within the gneisses. A major part of the terrain has attained upper-amphibolite facies metamorphism and the rest is greenschist facies. The gneissic rocks are interpreted to have formed by ultra-high pressure and temperature metamorphism (Mazumdar Reference Matthes, Okrusch and Richter1988; Sarkar Reference Saikia, Gogoi, Ahmad and Ahmad1988). The granitic gneisses and the migmatites are interbanded with volcano-sedimentary formations that are very much infolded into the gneisses. The sedimentary components generally comprise psammo-pelitic and pelitic rocks that resemble the sedimentary sequences of the Singhbhum Formations and the Khondalitic suites of the Eastern Ghats. The CGGC also includes widely distributed enclaves of more than one generation of ultramafic to mafic igneous rocks. Charnockites and associated granulites, anorthosites and relatively minor bodies of syenites, nepheline syenites and alkaline granites have also been mapped in parts of the CGGC.
Geological map of the Chotanagpur Granite Gneiss Complex showing the location of our study area marked as P (modified after Acharyya Reference Acharyya2003). Abbreviations: An = anorthosite; B = Bankura; BVSs = Bathani volcano-sedimentary sequence; D = Dudhi; DL = Daltonganj; DM = Dumka; DVB = Dalma Volcanic Belt; J = Jirgadandi; M =Munger; MGB = Makrohar Granulite belt; NPSZ = North Purulia Shear Zone; P = Purulia; R = Rihand – Renusagar Area; RJ = Rajmahal Hills; RN =Ranchi; SMGB = Son Mahanadi Gondwana Basins; SPSZ = South Purulia Shear Zone; SSZ = Singhbhum Shear Zone; SONA = Son Narmada Lineament; VB = Vindhyan Basin. The inset shows location of Chotanagpur terrain along with other Proterozoic mobile belts of India, including Aravalli Delhi Mobile Belt (ADMB), Central Indian Tectonic Zone (CITZ), Eastern Ghats Belt (EGB), North Singhbhum Mobile Belt (NSMB) and Shillong Meghalaya Gneissic Complex (SMGC). Four Archean cratonic nuclei of India – namely, Bastar (BC), Bundelkhand (BuC), Dharwar (DC) and Singhbhum (SC) – are also shown (modified after Chatterjee & Ghosh Reference Chatterjee and Ghosh2011).

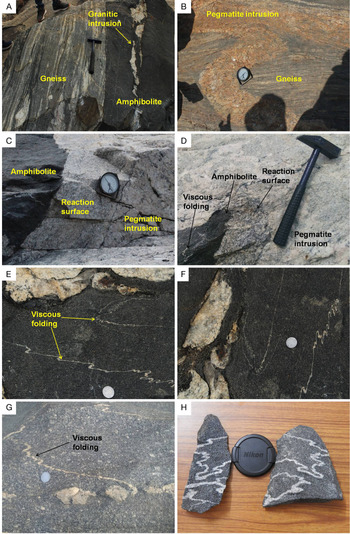
The present work was carried out in the Purulia district of West Bengal, which is located in the south-eastern part of CGGC (Fig. 1). The study area consists dominantly of gneisses, migmatites and granites, with enclaves of metapelitic and metabasic granulites and some intrusive basic rocks (Karmakar et al. Reference Johnson, Hudson and Droop2011). The gneissic rocks are characterised by alternate amphibole + biotite-rich mesocratic and quartz + feldspar-rich leucocratic layers (Fig. 2A). These rocks contain enclaves and layers of dark-coloured medium-grade mafic rocks representing amphibolites (Fig. 2A). The foliation shown by the amphibolites is parallel to the foliation in the gneissic rocks. At certain places, the foliations are diffused by the effect of migmatisation. The gneisses and amphibolites are frequently traversed by granitic and pegmatitic intrusions (Fig. 2A, B). A well-defined reaction surface can be seen at the contact of the igneous intrusions and metamorphic country rocks, representing interaction between magma and host rock (Fig. 2C, D). Millimetre- to centimetre-thick leucocratic veins were observed to emanate from the granitic intrusions into the amphibolites. The leucocratic veins show frequent folding as they traverse across the amphibolites, resembling a ptygmatic-type migmatite (Fig. 2E–H). The folded veins display a wide range of variation in fold morphology, and such folds maintain disharmony and misorientation, characterising viscous folding (McLellan Reference Mazumdar1984).
Field photographs displaying (A) contact zone between gneiss and amphibolite (a granitic intrusion is seen in the amphibolite aligned parallel to the foliation planes in the host rock), (B) pegmatite intrusion in gneiss, (C, D) reaction surface at the contact of amphibolite and pegmatite intrusion, (E–G) leucocratic veins or leucosome undergoing viscous folding in the partially molten amphibolite or melanosome and (H) folded leucocratic filaments in the partially molten amphibolite displaying chaotic mixing.
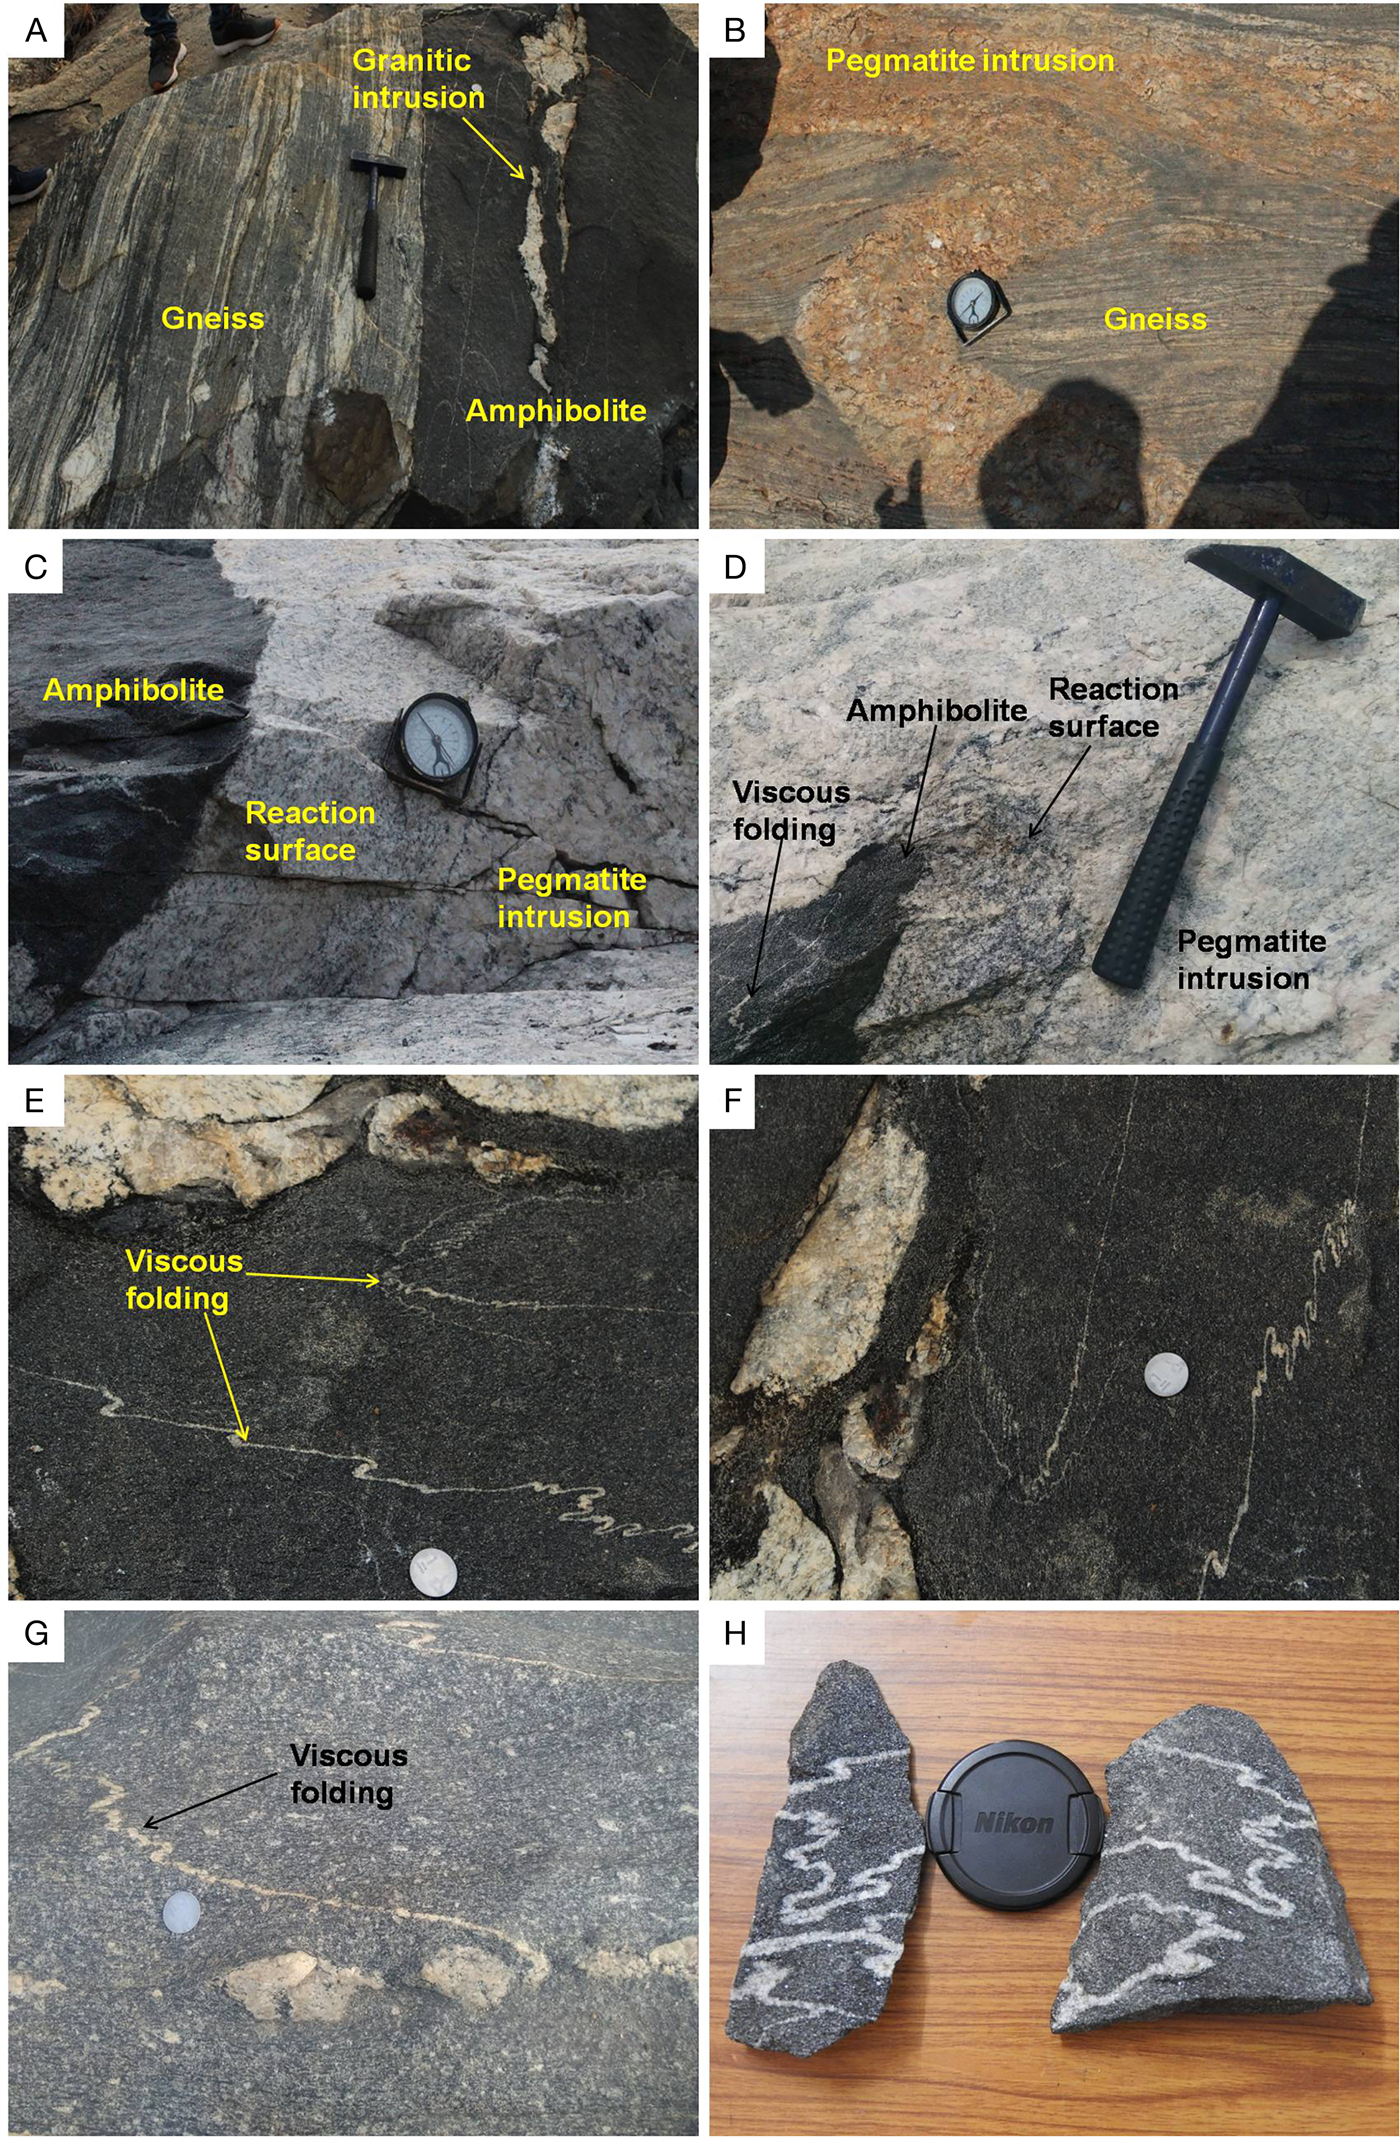
The migmatites of our study area consist of two distinct lithological components that can be characterised as paleosome and neosome. Other than the two components, the migmatites are frequently traversed by granitic or pegmatitic intrusions. The paleosome is constituted by the amphibolites in which foliation planes are well preserved. On the other hand, the neosome is constituted by the amphibolites with leucocratic veins. Thus, two distinct lithological components are encountered in the neosome, leucosome and melanosome. The melanosome is constituted by the amphibolites that may have undergone some degree of partial melting as evident from diffused foliations. Meanwhile, the leucosome is identified as the leucocratic felsic material that is traversing through the melanosome as veins or filaments. As the leucocratic veins traverse through the melanosome, they frequently undergo viscous folding.
2. Petrography
The migmatites of Purulia consist of three petrographically different parts, one of which is the paleosome, or amphibolites generally in metamorphic stage; another is of granitic appearance; and the third one is the neosome, which is a mingled product between the first two.
2.1. Paleosome
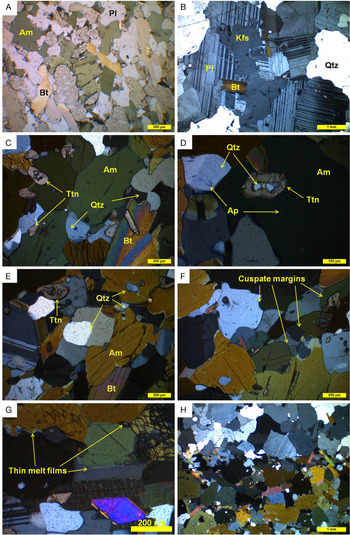
Amphibolite is a coarse-grained rock that is composed mainly of green and brown amphiboles and plagioclase feldspar (Fig. 3A). It also contains minor amounts of other minerals such as biotite, quartz and titanite. The elongated minerals are roughly aligned in a particular direction, which weakly defines the general metamorphic foliation planes of the rock.
Photomicrographs displaying (A) plane polarized light (PPL) view of the amphibolite, (B) crossed polarized light CPL view of the granite occurring as intrusion in the amphibolite, (C-E) amphibole and biotite getting altered to other minerals like titanite, quartz and apatite, (F) cuspate margins of the minerals surrounding amphibole. The cuspate regions possibly represent pools of crystallised partial melts, (G) thin melt films along crystal faces forming mineral pseudomorphs, (H) contact between the leucosome and the melanosome. The degree of alteration in amphibole and biotite can be seen in the mafic zone. Mineral abbreviations: Am = amphibole; Ap = apatite; Bt = biotite; Kfs = K-feldspar; Pl = plagioclase; Qtz = quartz and Ttn = titanite.

2.2. Granite
The granite samples are coarse-grained with the mineral grains mostly ranging from subhedral to anhedral in shape. This rock shows holocrystalline and allotriomorphic texture. It consists of plagioclase and quartz as major phases, while biotite, K-feldspar and apatite constitute the minor phases. Most of the plagioclase crystals occurring in this rock show prominent polysynthetic twinning (Fig. 3B).
2.3. Neosome
Neosome is a medium- to coarse-grained rock with the mineral grains ranging from euhedral to anhedral in shape. Two distinct zones can be identified in thin section: (a) medium-grained amphibole-rich mafic zone or melanosome; and (b) coarse-grained felsic zone or leucosome.
The mafic zone consists essentially of amphibole, biotite, plagioclase, quartz and titanite. Amphibole occurring in the mafic zone is frequently being altered to other minerals like titanite, apatite and quartz (Fig. 3C–G). In comparison to the paleosome, the abundance of certain minerals like quartz and titanite has increased in the melanosome (Fig. 3E, F).
The coarse-grained leucosome occur as a discrete band within the melanosome, with the mineral grains mostly ranging from subhedral to anhedral in shape (Fig. 3H). Similar to the granite samples, the felsic or leucocratic zone consists of plagioclase and quartz as major phases, while biotite, K-feldspar and apatite constitute the minor phases. Moreover, plagioclase crystals occurring in the leucosome show prominent polysynthetic twinning.
3. Analytical methods
The mineral analyses were carried out on the electron-probe micro-analyser (EPMA) CAMECA SX Five instrument at Department of Science and Technology (DST)-Science and Engineering Research Board (SERB) National Facility, Department of Geology (Center of Advanced Study), Institute of Science, Banaras Hindu University. Polished thin sections were coated with a 20-nm-thin layer of carbon for electron-probe micro-analyses using the LEICA-EM ACE200 instrument. The CAMECA SX Five instrument was operated by SX Five Software at a voltage of 15 kV and a current of 10 nA, with a LaB6 source in the electron gun for generation of electron beam. The natural silicate mineral andradite was used as the internal standard to verify the positions of crystals (SP1-TAP, SP2-LiF, SP3-LPET, SP4-LTAP and SP5-PET) with respect to corresponding wavelength-dispersive spectrometers (SP#) in the CAMECA SX-Five instrument. The following X-ray lines were used in the analyses: F–Kα, Na–Kα, Mg–Kα, Al–Kα, Si–Kα, P–Kα, Cl–Kα, K–Kα, Ca–Kα, Ti–Kα, Cr–Kα, Mn–Kα, Fe–Kα, Ni–Kα and Ba–Lα. The natural mineral standards were as follows: fluorite, halite, periclase, corundum, wollastonite, apatite, orthoclase, rutile, chromite, rhodonite, hematite and barite; the nickel (Ni) pure metal standard supplied by CAMECA-AMETEK was used for routine calibration and quantification. Routine calibration, acquisition, quantification and data processing were carried out using SxSAB version 6.1 and SX-Results software of CAMECA. The precision of the analysis is better than 1% for major element oxides and 5% for trace elements from the repeated analysis of standards.
4. Mineral chemistry
4.1. Amphibole
Based on the classification of Leake et al. (Reference Karmakar, Bose, Sarbadhikari and Das1997), amphibole from the paleosome is classified as calcium (Ca)-amphibole. The amphibole compositions plot in the fields of pargasite and hastingsite (Fig. 4). The Ca content in amphibole varies from 1.88 to 1.99 apfu (atom per formula unit), aluminiumiv (Aliv) = 1.67–1.85, (sodium (Na) + potassium (K))A = 0.56–0.70 and magnesium (Mg)# = 0.46–0.51 (Table 2).
Amphibole compositions from the paleosome and the melanosome (after Leake et al. Reference Karmakar, Bose, Sarbadhikari and Das1997). The colour green represents paleosome, and yellow represents melanosome.

Representative electron microprobe analyses of amphibole from the paleosome.

Amphibole occurring in the melanosome is classified as Ca-amphibole and plots in the field of hastingsite (Fig. 4). The Ca content in amphibole varies from 1.86 to 1.92 apfu, Aliv = 1.72–1.91, (Na + K)A = 0.60–0.73 and Mg# = 0.42–0.45 (Table 3).
Representative electron microprobe analyses of amphibole from the melanosome.

4.2. Biotite
On the Aliv vs iron (Fe)# (Fe/Fe + Mg) classification diagram (Speer 1984), biotite from the paleosome plots in the field of eastonite and siderophyllite (Fig. 5). The silicon (Si) value of biotite varies from 2.75 to 2.84 apfu, total Al varies from 1.36 to 1.43 and the Fe + Mg value ranges from 2.48 to 2.65 (Table 4).
Nomenclature and classification of biotite after Speer (1984). The colour green represents paleosome, red represents granite, yellow represents melanosome and blue represents leucosome.

Representative electron microprobe analyses of biotite from the paleosome.

The representative analyses of biotite occurring in the granites are provided in Table 5. The Si value of biotite varies from 2.70 to 2.81, total Al varies from 1.36 to 1.43 and the Fe + Mg value ranges from 2.43 to 2.56. The biotite from this rock plots in the field of siderophyllite (Fig. 5).
Representative electron microprobe analyses of biotite from the granitic intrusion.

Biotite occurring in the melanosome shows composition with silicon dioxide (SiO2) = 35.29–36.58 wt%; ferrous oxide (FeO) = 19.46–20.58 wt%; aluminium oxide (Al2O3) = 14.95–15.89 wt%; and potassium oxide (K2O) = 8.64–9.08 wt% (Table 6). The compositions of biotite from the melanosome plot in the field of siderophyllite (Fig. 5). On the other hand, biotite from the leucosome shows SiO2 content of 35.34 to 37.40 wt%, FeO content of 19.88 to 22.64 wt%, Al2O3 content of 14.59 to 15.68 wt% and K2O content of 8.35 to 9.20 wt% (Table 7). The compositions of biotite from the leucosome plot in the field of siderophyllite (Fig. 5).
Representative electron microprobe analyses of biotite from the melanosome.

Representative electron microprobe analyses of biotite from the leucosome.

4.3. Plagioclase
Representative analyses of plagioclase occurring in the paleosome are provided in Table 8. The analysed plagioclase grains from the amphibolites plot in the fields of oligoclase and andesine (Fig. 6A), with anorthite (An) content ranging from An28 to An31.
Nomenclature of plagioclase occurring in the (A) paleosome, (B) granite, (C) melanosome and (D) leucosome. The colour green represents paleosome, red represents granite, yellow represents melanosome and blue represents leucosome. Mineral abbreviations: Ab, A l = albite; An = anorthite and anorthoclase; And = andesine; By = bytownite; La = labradorite; Ol = oligoclase.

Representative electron microprobe analyses of plagioclase from the paleosome.

A total of 18 point data analyses were selected from individual plagioclase grains occurring in the granites. The compositions of plagioclase from the granitic samples plot in the fields of oligoclase and andesine (Fig. 6B). The An content of the plagioclase varies between An18 and An32 (Table 9).
Representative electron microprobe analyses of plagioclase from the granitic intrusion.

The compositions of plagioclase from the melanosome plot in the fields of oligoclase and andesine (Fig. 6C). The An content of the plagioclase varies between An28 and An35 (Table 10). On the other hand, the plagioclase compositions from the leucosome plot in the field of oligoclase (Fig. 6D), with An content ranging from An27 to An30 (Table 11).
Representative electron microprobe analyses of plagioclase from the melanosome.

Representative electron microprobe analyses of plagioclase from the leucosome.

4.4. K-feldspar
This mineral is restricted to the granites and leucosome. In the granites, analyses were carried out at 12 points on K-feldspar grains. The data include single-point analyses of individual grains. Representative data are provided in Table 12. The compositions of K-feldspar from the felsic rock plot in the field of orthoclase (Fig. 7A). The orthoclase (Or) content of the K-feldspar varies between Or94 and Or100.
Nomenclature of K-feldspar occurring in the (A) granite and (B) leucosome. The colour red represents granite and blue represents leucosome.
Mineral abbreviations: (Ab, Al) represents albite, An represents anorthite and anorthoclase, And represents andesine, By represents bytownite, La represents labradorite, Ol represents oligoclase, Or represents orthoclase and Sa represents sanidine.

Representative electron microprobe analyses of K-feldspar

The representative analyses of K-feldspar occurring in the leucosome are provided in Table 12. Only single-point analyses were carried out on this particular mineral occurring in the neosome. The K-feldspar compositions plot in the field of orthoclase (Fig. 7B), with a restricted Or content of Or100.
5. Discussion
5.1. Chaotic mixing
The leucosomes are generally preserved as thin threads or filaments in the neosome of the migmatic rocks from CGGC. These veins or filaments have played a very important role in facilitating the mixing process between the leucosome and the melanosome. The sizes of the veins vary considerably, ranging from microscopic to macroscopic in scale. The conservation of such veins in the neosome suggests the role of chaotic mixing during migmatisation. In chaotic mixing dynamics, mixing is facilitated between two different silicate melts by stretching and folding dynamics, as stretching and folding are the basic forces promulgating magmas (De Campos et al. Reference De Campos, Perugini, Ertel-Ingrisch, Dingwell and Poli2011; Perugini et al. Reference Perugini, De Campos, Dingwell and Dorfman2012). The mechanical stretching and folding of two different magmas lead to the generation of filaments or lamellar structures at several length scales. The formation of such filaments results in the exponential increase of contact area between the interacting fluids, thereby enhancing chemical exchanges through diffusion (Fig. 2H). The formation of wide surface areas between different fluid filaments (i.e., magmas) reduces the length scale, making diffusion progressively more efficient. Hence, advection (i.e., stretching and folding) and diffusion are the basic fundamental parameters governing the mixing of two different magmas.
Field and petrographical observations have revealed that the leucocratic veins occurring in the neosome are transporting mineral phases from the granitic intrusions to the melanosome. Such veins transporting mineral phases have been reported from other magma mixing scenarios (Gogoi & Saikia Reference Gogoi and Saikia2018, Reference Gogoi and Saikia2019; Gogoi et al. Reference Gogoi, Saikia and Ahmad2018A, Reference Gogoi, Saikia, Ahmad and AhmadB). According to Ubide et al. (Reference Speer and Bailey2014), crystal transfer mechanism can play an efficient role to enable two rheologically different magmas overcome some of the physical constraints of interaction and facilitate mixing between them. The leucocratic veins transferred crystals of minerals from the felsic zones to the mafic zones to enhance mixing between the leucosome and the melanosome. However, it is noteworthy that the movement of granitic melts or leucosome into the melanosome took place during the early phase of crystallisation of the former. This is because viscosity will increase exponentially in a crystal-dominated system that stops all movement. Thus, the movement of magmas can only occur when viscous fluids dominate the system – that is, during the early phase of mixing.
5.2. Viscous folding
Viscous folding is an efficient mechanism that can significantly enhance mixing between two silicate melts with pronounced viscosity contrast (Gogoi & Saikia Reference Gogoi and Saikia2018). There are a number of microfluidic experimental investigations that have studied the effect of viscous folding on the mixing of two fluids with varying viscosities (Cubaud & Mason Reference Cubaud and Mason2006A, Reference Cubaud and MasonB, Reference Cubaud and Mason2007A, Reference Cubaud and MasonB, Reference Cubaud and Mason2008; Chung et al. Reference Chung, Choi, Kim, Ahn and Lee2010; Darvishi & Cubaud Reference Darvishi and Cubaud2012). There are basically three fundamental factors that govern viscous folding in fluids: viscosity contrast between the interacting fluids (χ), thickness of the viscous thread and Reynolds number (Re). The folding process is a low Re phenomenon. Buckling or folding instability is generally observed when a thin thread of a higher viscosity fluid ventures into a lower viscosity fluid, the two fluids having a viscosity contrast of χ ≥ 15. In the migmatites of our study area, the leucocratic veins underwent viscous folding as they traversed through the melanosome (Fig. 2D–G); in other words, the viscosity of the leucosome was much larger than the melanosome. When the leucosome or granitic magma veined into the melanosome, the former experienced compressional stress due to viscosity difference between the two mediums and underwent folding. The higher the compressional stress on the filaments, the more the viscous folding. Folding decreased the velocity of the leucocratic phase and the sinuous shape of the veins increased the interfacial area between the leucosome and the melanosome. The melanosome got trapped between the folds of the leucosome, enhancing mixing between the two disparate phases. An important factor controlling viscous folding is the thickness of the vein or filament. A vein will fold when it is unable to overcome the compressional stress. A vein having a larger diameter will overcome the compressional stress and straighten out rather than folding. Thus, the phenomenon of viscous folding is supported in the case of filaments having low thickness (Chung et al. Reference Chung, Choi, Kim, Ahn and Lee2010).
The most plausible phenomenon that can explain the folding of leucocratic veins in the migmatites of CGGC is partial melting. Anatexis or partial melting of a pre-existing rock can induce temperature and compositional gradients along with melt migration in channel networks (De Campos et al. Reference De Campos, Perugini, Ertel-Ingrisch, Dingwell and Poli2011). When the high-temperature granitic magma intruded the gneissic rocks and amphibolites, the former gradually veined into the amphibolites, by progressively melting it and then interacting with the partially molten rocks or melanosome, leading to chaotic mixing dynamics. The development of chaotic mixing processes triggered stretching and folding of the leucocratic veins. The stretching and folding of the veins exponentially increased the surface area between the leucosome and melanosome, eventually leading to enhanced chemical exchanges through diffusion and facilitating mixing between the two disparate phases. Evidence of mixing through diffusion between the leucosome and the melanosome are shown by the compositional variations of amphibole and biotite. In the Mg vs Mg# and Fe2+ vs Mg# plots (Fig. 8A, B), compositions of biotite from the amphibolite, granite, melanosome and leucosome show linear trends. The biotite occurring in the amphibolite is Mg-rich, while those occurring in the granite is Fe-rich. The biotite occurring in the melanosome and the leucosome show intermediate values between the Mg- and Fe-rich biotite and their Mg–Fe concentration varies linearly. The substitution of Mg and Fe2+ in biotite from the leucosome and the melanosome strongly suggests mixing between the two phases through elemental diffusion. Similar substitution is also displayed by amphibole occurring in the melanosome (Fig. 8C, D).
(A, B) Mg vs Mg# and Fe2+ vs Mg# plots of biotite; (C, D) Mg vs Mg# and Fe2+ vs Mg# plots of amphibole. The colour green represents paleosome, red represents granite, yellow represents melanosome and blue represents leucosome.

5.3. Migmatisation
The gneissic rocks and amphibolites of our study area are frequently intruded by granitic and pegmatite intrusions. These intrusions are pervasive in nature and are aligned parallel to the main anisotropy represented by foliation planes in the host country rocks. During active deformation, magma moves by pervasive flow and it is essentially injected through the system parallel to the principal finite elongation in the form of foliation-parallel intrusions (Fig. 2A). Various workers have suggested pervasive melt migration at outcrop scale controlled by regional deformation (Collins & Sawyer Reference Collins and Sawyer1996; Brown & Solar Reference Brown and Solar1998; Weinberg & Searle Reference Turner1998; Hasalová et al. Reference Hasalová, Schulmann, Lexa, Štípská, Hrouda, Ulrich, Haloda and Týcová2008).
Thin leucocratic veins have been observed to move out from the granitic intrusions into the surrounding amphibolites. As the felsic veins traversed through the mafic zones, they underwent folding dynamics, indicating viscous folding. The display of viscous folding by the leucocratic veins suggests that viscous forces were dominant in the system when the felsic veins penetrated the amphibolites. This condition is only possible if we assume that the amphibolites were partially molten. The three most important features to recognise partial melting in metamorphic rocks are summarised by Sawyer (Reference Saikia, Gogoi, Ahmad, Kumar, Kaulina, Bayanova and Mondal1999). Signatures of partial melting are evident in our amphibolites, which include thin melt films along crystal faces forming mineral pseudomorphs (Fig. 3G), resorbed minerals embayed by surrounding mineral pseudomorphs after melt (Fig. 3C–E) and cuspate–lobate regions representing pools of crystallised melt (Fig. 3F). A distinctive feature of the neosome from our study area is that the mafic minerals like amphibole and biotite are getting altered to other minerals like titanite, quartz and apatite (Fig. 3C–H). The interstitial spaces between the mafic minerals are inferred to have been occupied by titanite-rich silicic melt pools with cuspate margins. These cuspate melt pools have crystallised titanite and quartz with minor plagioclase (Fig. 3F). The generation of similar titanite-rich silicic melt from destabilisation of mafic minerals like amphibole and biotite have been reported previously (Gogoi et al. Reference Gogoi, Saikia and Ahmad2017).
The cause of partial melting in the amphibolites of our study area may be related to the increase in temperature and influx of volatiles from the granitic and pegmatite intrusions. Late-stage residual melts derived from the crystallisation of granitic plutons are enriched in volatiles, fluxes, incompatible components and rare earth elements (Simmons & Webber Reference Sederholm2008). The intrusion of such silicic melts in metamorphic terrains can initiate partial melting in the country rocks by providing the necessary heat and influx of volatiles. From field observations, it appears that the intrusion of hotter silicic melts in the gneissic rocks and amphibolites of our study area initiated partial melting in the country rocks by raising the temperature and promoting local influx of volatiles, especially H2O, into the hot rocks (Finger & Clemens Reference Finger and Clemens1995; Johnson et al. Reference Johannes and Gupta2001; White et al. Reference Ubide, Gale, Larrea, Arranz, Lago and Tierz2005; Sawyer Reference Saikia, Gogoi, Kaulina, Lialina, Bayanova, Ahmad, Pant and Dasgupta2008). The partial melting of the amphibolites or paleosome produced a partially molten rock, which is now preserved as the melanosome. After its formation, the melanosome was intruded by thin leucocratic filaments from the nearby felsic intrusions. The felsic melt that intruded the melanosome as discrete veins is now preserved as leucosome in the latter. As the highly viscous leucocratic veins or leucosome ventured into the partially molten rocks or melanosome, the former experienced compressional stress owing to viscosity difference between the two mediums, and underwent viscous folding. The mixing of the leucosome and the melanosome produced a mixed rock – that is, neosome.
The possible mechanisms responsible for the generation of migmatites in our study area are igneous intrusion and partial melting. Results presented in this work suggest that a migmatic rock is a mixing product of primary material and material introduced from outside – that is, the process of migmatisation operates in an open system. As such, the nature of migmatic rocks may be dependent on a number of factors like nature and size of igneous intrusions, degree of partial melting in the country rocks, composition of the country rocks and nature of interaction between the country rocks and igneous intrusions.
6. Conclusions
From field, petrographical and mineral chemical data interpretations, we summarise that the gneissic rocks and amphibolites of our study area were intruded by granitic and pegmatitic magmas. These intrusions are pervasive in nature and are aligned parallel to the main anisotropy represented by foliation planes in the host rocks. The first interaction that took place between the felsic intrusions and amphibolites is diffusion of heat and volatiles from the hotter felsic magma to the colder country rocks. The diffusion of heat and volatiles initiated partial melting in the amphibolites, forming melanosome. Gradually, the felsic magma veined into melanosome, by progressively melting it and then interacting, leading to chaotic mixing dynamics. The development of chaotic mixing allowed the felsic magma to venture into the adjacent melanosome as discrete veins by stretching and folding dynamics. As the leucocratic veins or leucosome traversed through the partially molten rocks or melanosome due to advection, they underwent viscous folding due to the action of compressional stress brought about by the viscosity difference between the two mediums. The occurrence of viscous folding exponentially increased the contact area between the leucosome and melanosome, ultimately leading to enhanced diffusion to augment mixing. In conclusion, migmatites are mixing products of primary material and material introduced from outside – that is, the process of migmatisation operates in an open system.
7. Acknowledgements
This research did not receive any specific grant from funding agencies in the public, commercial or not-for-profit sectors. The authors are grateful to Professor NV Chalapathi Rao and Dr Dinesh Pandit for EPMA analyses at DST-SERB National Facility, Department of Geology (Center of Advanced Study), Institute of Science, Banaras Hindu University. The authors are thankful to Professor Parag Phukon, Gauhati University, for providing the necessary permissions and facilities to carry out the petrographic work. The optical photomicrographs were obtained using the microscope-imaging facility established through DST-FIST funding (SR/FST/ESI-152/2016) at the Department of Geological Sciences, Gauhati University.