1 Introduction
The effects of language contact are varied and far-reaching, and the fact that languages can ‘borrow’ much more than lexical items is well-documented in contact situations around the globe (Thomason & Kaufman Reference Thomason and Kaufman1988). Phonetic and phonological transfer are especially common structural results of long-term contact (Matras Reference Matras2009: 222), and one example of this phenomenon can be observed in Jones (Reference Jones, Ball and Jones1984), which indicates that younger speakers of Patagonian Welsh may be innovating unaspirated voiceless stops as a result of increasing contact with Spanish. The unique situation of Welsh – spoken as a minority language on two continents, in two different social contexts, and under the influence of two different superstrate languages – allows us to observe the process of language contact ‘in action’. In particular, we can see how language contact unfolds with respect to both social and structural factors by examining how a single phonetic feature – the aspiration of voiceless stops – varies under the influence of different contact languages.
This paper measures the voice-onset time (VOT) of Welsh oral plosives /p/, /t/, and /k/ using contemporary conversational speech data from both Patagonia and Wales, for speakers from three different age groups (0–29, 30–59, and 60+ years), to investigate the effects of contact on the aspiration of Welsh stops in Patagonia.
1.1 The Welsh language in Patagonia
The Welsh colony in Argentina (known as Y Wladfa in Welsh) was founded specifically to preserve the Welsh language, religion, and cultural values in a location far removed from English influence (Johnson Reference Johnson2009). Several locations were considered, including Vancouver Island and Brazil, but the emigrants eventually settled on the Chubut Valley in Argentina, a desert area which the Argentine government hoped to populate with European immigrants (Birt Reference Birt and Néill2005). A single ship carrying 160 colonists arrived at what is now Puerto Madryn on July 28th 1865, and 3,000 more followed over the next 50 years, founding several towns in two distinct settlement areas: Dyffryn Camwy (or Camwy Valley) in the east (Gaiman, Trelew, Rawson, and Dolavon), and Cwm Hyfryd (Lovely Valley) in the Cordillera region of the Andes to the west (Esquel and Trevelin) (Johnson Reference Johnson2009).
Welsh-language religious, educational, and local government institutions helped cement the status of the language in public life, and the colony remained largely Welsh-speaking until the end of the 19th century (Jones Reference Jones, Ball and Jones1984, Birt Reference Birt and Néill2005). Local and settlement-wide Eisteddfodau – Welsh-language music and culture festivals, which include competition in song, dance, instrumental music, poetry, drama, readings, and literature – were held often and drew large numbers of attendees, giving the language an important, continuous presence in local culture (Williams Reference Williams1991, Birt Reference Birt and Néill2005). As the central Argentine government began to extend its influence in the region and immigration from other parts of Europe and Argentina intensified, however, a diglossic situation arose. By the end of the second World War, Spanish had become the language of public life, Welsh-language institutions dwindled, the Eisteddfodau were in decline, and the use of Welsh was restricted to Welsh-speaking homes, social circles, and religious services (Williams Reference Williams1991, Johnson Reference Johnson2009).
The 1965 centenary of the colony marked a turning point for the Welsh language in Patagonia, with a renewed interest in Welsh as a heritage language for those of Welsh descent, and as a cultural icon for all inhabitants of the historically Welsh settlements. The centenary also saw the rebirth of the Eisteddfodau – this time as bilingual Welsh–Spanish events – which have continued annually ever since, and a rise in contact and cultural visits between Patagonia and Wales (Williams Reference Williams1991, Birt Reference Birt and Néill2005). This shift led to a marked improvement in the status of the language in Patagonia, especially since the 1990s (Jones Reference Jones1996, Johnson Reference Johnson2009).
While current estimates of fluent speakers are difficult to obtain, in 1973, 15% of the population of Gaiman spoke Welsh regularly (Jones Reference Jones, Ball and Jones1984: 240), and in 2005 at least ‘several thousand’ people in Chubut had ‘some knowledge of Welsh with varying degrees of fluency’ (Ó Néill Reference Ó Néill and Néill2005: 429). In terms of identity, most members of the Welsh-speaking Patagonian community consider themselves ‘both Argentinian and Welsh . . . Welsh being considered an ethnic identity and being Argentine as a civic identity’ (Johnson Reference Johnson2009: 145).
Access to Welsh-medium education has also increased significantly in the decades following Jones' survey, with Ysgol Gymraeg y Gaiman, Ysgol yr Hendre in Trelew, and the newly launched (2015) Ysgol y Cwm in Trevelin providing full Welsh-immersion nursery and primary schooling, and Ysgol Gymraeg yr Andes in Trevelin and Coleg Camwy in Gaiman offering successful after-school programs for older children and adults (Kiff Reference Kiff2013, Arwel Reference Arwel2016). Since 2008, a program known as Menter Patagonia, sponsored by the Welsh National Assembly, has also sent young Welsh speakers from Wales to both Dyffryn Camwy & Cwm Hyfryd to act as community language teachers, mentors, and cultural ambassadors (Mac Giolla Chríost Reference Mac Giolla Chríost2012). Most recently, the colony's 150th anniversary celebrations in 2015 drew in a large number of visitors from Wales, including organized visits from the Welsh-language youth organization Yr Urdd (Cymdeithas Cymru-Arianinn Reference Cymru-Arianinn2015). These celebrations resulted in a significant increase in the number of adults learning Welsh in the Wladfa (Arwel Reference Arwel2016), and the links between Patagonia and Wales – especially Welsh-speaking Wales – are only expected to increase following the celebrations. Ysgol Gymraeg y Gaiman, for example, plans to employ teachers from Wales starting in 2017, and has partnered with University of Wales Trinity St. David for staff training, while in 2016 the Welsh Language Project in Chubut began talks to develop partnerships with organizations in Wales including the National Centre for Learning Welsh, Yr Urdd, Y Coleg Cymraeg Cenedlaethol, and Cardiff University (Arwel Reference Arwel2016).
1.2 Voice-onset timing
Much previous research on voice-onset time has focused on cross-linguistic variation in VOT values, beginning with Lisker & Abramson's (Reference Lisker and Abramson1964) seminal cross-linguistic study. Using data from 11 languages, they showed that voicing, aspiration, and force of articulation are all ‘predictable consequences’ of differences in voice-onset time, and showed that languages broadly select from three categories of VOT: voicing lead (around –30 ms or lower), zero-onset or short-lag (from 0 to ~30 ms), and long-lag (~50 ms or greater). Their data also point to place of articulation playing a role in VOT values: the velar stops in their study consistently display longer VOT values than their alveolar or bilabial counterparts, and for most languages in their sample – excepting Tamil, Cantonese, and Eastern Armenian – alveolar stops have longer VOT values than bilabial stops.
Cho & Ladefoged (Reference Cho and Ladefoged1999) present VOT data from 18 endangered and less-studied languages, showing that, within languages, VOT values for different stop consonants vary based on place of articulation, extent of articulator contact, and articulator movement speed. They identified four categories of positive VOT values, based on a comparison of velar stops among languages: unaspirated (~30 ms), slightly aspirated (~50 ms), aspirated (~90 ms), and highly aspirated (reserved for Navajo and Tlingit plosives, with average values over 120 ms). Despite these clusterings, however, they note that no languages contrast more than three categories of VOT distinctions, which they represent phonetically as voiced, voiceless unaspirated, and voiceless aspirated.
Importantly, the three languages of interest to the present study – English, Spanish, and Welsh – contrast the phonologically ‘voiceless’ and ‘voiced’ stop series /ptk/ and /bd ɡ/ using the three patterns of phonetic realization distinguished in Lisker & Abramson (Reference Lisker and Abramson1964) in different ways. For English, for instance, Lisker & Abramson (Reference Lisker and Abramson1964) list the following word-initial VOT values, based on four speakers, shown in Table 1Footnote 1.
Average VOT (ms) in English (Lisker & Abramson Reference Lisker and Abramson1964).

Thus English, at least word-initially, contrasts aspirated /ptk/ with voiceless unaspirated /bd ɡ/ (Cho & Ladefoged Reference Cho and Ladefoged1999).
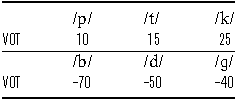
For Argentinian Spanish, as spoken in Buenos Aires, Borozone de Manrique (Reference Borozone de Manrique1980) found the following VOT values in a study of six male speakers, shown in Table 2. Spanish, unlike English, contrasts voiceless unaspirated /ptk/ with voiced /bd ɡ/, indicated by the negative VOT values for the (both phonetically and phonologically) voiced series.
Average VOT (ms) in Buenos Aires Spanish (Borozone de Manrique Reference Borozone de Manrique1980).

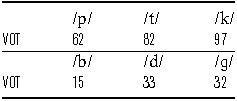
For Welsh, an acoustic study of initial stops by Ball (Reference Ball, Ball and Jones1984) using 1 male and 5 female speakers from Carmarthen, Wales, gave the following VOT values, shown in Table 3. In Carmarthen Welsh, then – as in English, but unlike Spanish – /ptk/ and /bd ɡ/ are phonetically distinguished by VOT, as opposed to by voicing, with /ptk/ being voiceless aspirated and /bd ɡ/ being voiceless unaspirated (Ball Reference Ball, Ball and Jones1984: 15), although VOT values are longer than in Lisker & Abramson's English study.
Average VOT (ms) in Carmarthen Welsh (Ball Reference Ball, Ball and Jones1984).

Along with cross-linguistic diversity in the realization of voice-onset timing, socially-conditioned VOT variation has become an important area of study, especially with regards to gender. Swartz (Reference Swartz1992) looked at VOT of the English stops /t/ and /d/ in 16 speakers of American English, eight female and eight male, and found that women produced both stops with longer average VOT values than men. Whiteside & Irving (Reference Whiteside and Irving1998) examined VOT values in five female and five male adult British English speakers, finding that, on average, the female speakers displayed longer VOT values for voiceless stops /ptk/ than their male counterparts. A later study by Whiteside, Henry & Dobbin (Reference Whiteside, Henry and Dobbin2004) found the same tendencies in data from young British English speakers (between five and 13 years old), showing that these differences may develop before adulthood.
In terms of cross-linguistic variability, Thomas (Reference Thomas2011: 116) notes that VOT can be a variable of interest ‘especially in language contact situations’, as shown by a growing body of research. Heselwood & McChrystal (Reference Heselwood and McChrystal1999), for example, studied speakers of Punjabi in Bradford, England, and found that younger bilingual speakers were losing the contrast between pre-voiced stops (ostensibly with negative VOT) and voiceless unaspirated stops, likely due to English influence. Harlow et al. (Reference Harlow, Keegan, King, Maclagan, Watson, Stanford and Preston2009) similarly examined diachronic change in VOT (among other phonetic variables) in Māori, finding that younger speakers generally produced voiceless stops with longer VOT values than older speakers, due to increased contact with English. Finally, Fowler et al. (Reference Fowler, Sramko, Ostry, Rowland and Hallé2008) measured VOT in the speech of bilingual French–English speakers in Montréal. Their results showed that bilingual speakers produced French voiceless stops with longer VOT values than monolingual French speakers, and English voiceless stops with shorter VOT values than monolingual English speakers. Since English voiceless stops are normally aspirated in initial position, and French voiceless stops are not (Cho & Ladefoged Reference Cho and Ladefoged1999), these results indicate bidirectional phonetic contact effects: bilingual speakers produce voiceless stops with longer VOT in French and shorter VOT in English.
1.3 Patagonian Welsh
While there has been substantial interest in the Welsh spoken in Patagonia in the Welsh-language popular press, and several sociocultural investigations of Welsh language vitality, maintenance, and use in Patagonia (Birt Reference Birt and Néill2005, Trosset, Thornton & Caulkins Reference Trosset, Thornton and Caulkins2007, Johnson Reference Johnson2009, Coupland & Garrett Reference Coupland and Garrett2010) very few studies have attempted to systematically examine unique linguistic features of Patagonian Welsh. Those that have focus primarily on potential contact effects from Welsh–Spanish bilingualism. Agozzino (Reference Agozzino2006) explores the folkloric traditions of Welsh Patagonia through ethnographic interviews, and touches briefly on lexical contact features unique to Patagonian Welsh, including calques, loanwords, and Welsh–Spanish hybrid idioms. In terms of phonology, Bell (Reference Bell2015) examines the production of phonemic vowel length in Patagonian Welsh as a possible locus of contact-induced phonological change, finding that – contrary to predictions based on first language (L1) Spanish phonology – Welsh–Spanish bilinguals in Patagonia retain the phonemic vowel length distinctions of Welsh, regardless of order of language acquisition (Welsh L1 or Spanish L1).
As one of the first studies to focus on potentially unique phonetic features of Patagonian Welsh, Jones (Reference Jones, Ball and Jones1984) provides a variationist account of the production of several phonemes in the Welsh spoken in Gaiman, Chubut, based on fieldwork conducted from 1971 to 1973. Variation studied included /x/ vs. /x̟/, /ʃ/ vs. /s/, /ə/ vs. /ɪ/, and, notably, /phthkh/ vs. /ptk/, with each of these secondary realizations said to be contact-influenced developments from Spanish. Without providing specific VOT values, Jones' survey indicates that the speakers in his ‘Young’ (under 30) and ‘Young Middle-aged’ (30–45 years) categories ‘consistently’ produced the Welsh /ptk/ using ‘the Spanish unaspirated phones’, ‘Elderly’ (60+ years) speakers used the ‘Welsh aspirated phones’, and ‘Middle-aged’ (45–60 years) speakers differed on the basis of their level of affiliation with the Welsh cultural community: speakers more active in Welsh religious and social life were more likely to produce aspirated stops when speaking Welsh (Jones Reference Jones, Ball and Jones1984: 247).
Jones calls this age-graded change in aspiration ‘an indicator of the growth in the importance of Spanish and consequent bilingualism within the life of the community’ (Jones Reference Jones, Ball and Jones1984: 248), and it patterns predictably with linguistic trends in education. Jones' elderly speakers were educated when the community was still monolingual Welsh-speaking, the middle-aged group might or might not have attended the Welsh-language Ysgol Ganolraddol secondary school, and the younger speakers would have been educated entirely in Spanish (Jones Reference Jones, Ball and Jones1984: 248).
Nearly fifty years on from Jones' initial investigation, the sociolinguistic situation of Welsh in Patagonia has shifted yet again, resulting in increased access to Welsh-language education and a notable rise in prestige for the language since the 1990s, at the same time that Spanish has become the unmarked language of daily life for nearly everyone in Welsh Patagonia. This current study aims to quantitatively investigate whether the contact-induced changes in VOT impressionistically noted in Jones (Reference Jones, Ball and Jones1984) have indeed become a phonetic feature of modern Patagonian Welsh, and increase our understanding of both phonetic contact effects in general and a distinguishing feature of this unique, underdescribed variety of Welsh.
2 Data and methods
2.1 Data
The data for this study are drawn from two corpora of contemporary, conversational Welsh speech: the Bangor Patagonia Corpus (for the Patagonian data) and the Bangor Siarad Corpus (for the Wales data), both assembled by the ESRC Centre for Research on Bilingualism in Theory & Practice at Bangor University, licensed under the Free Software Foundation's General Public License, and available at http://www.bangortalk.org.uk (Deuchar et al. Reference Deuchar, Webb-Davies, Herring, Parafita Couto, Carter, Thomas and Mennen2014). Conversations were recorded in speakers' homes, schools, and workplaces, in 2006 (Wales) and 2009 (Patagonia), and both the audio data and glossed transcriptions are available in the corpora. The Bangor Patagonia corpus contains 21 hours of conversation by 94 speakers, and the Bangor Siarad corpus features 151 speakers and approximately 40 hours of conversation.
Most phonetic studies of VOT have utilized data elicited from wordlists, to provide maximum control over potentially influencing factors, including the effects of speech rate, differing phonetic environments, and stress and intonational patterns. While all these factors can affect VOT measurements, there are also benefits to using naturalistic speech data to examine phonetic phenomena, as this study does for VOT, particularly when sociocultural and/or stylistic factors may influence phonetic production. No single speaker always uses a single style, and speakers are more or less attentive to their speech depending on the context and type of interaction in which they find themselves (Eckert Reference Eckert, Eckert and Rickford2001: 122). As Labov (Reference Labov1981: 3) points out, ‘any systematic observation of a speaker defines a formal context where more than the minimum attention is paid to speech’. Though this is certainly true, different types of observation are more or less formal, and more or less systematic, and Eckert (Reference Eckert, Eckert and Rickford2001) and others have argued that different observational contexts influence speakers' language use to a greater or lesser degree, especially with respect to standard language ideologies.
The conversations in the Patagonia and Siarad corpora, for instance, in which participants recorded themselves without a researcher present (in most cases), represent a context where speakers are far less attentive to their speech than when recording a wordlist in a laboratory setting. Because of the prestige which Welsh from Wales carries in Patagonia, and the popular perception that Patagonian speakers speak Welsh with a ‘Spanish accent’ or ‘Spanish-influenced rhythm’ (Agozzino Reference Agozzino2006), it could be that speakers recording a wordlist may be more conscious of their self-presentation (Eckert Reference Eckert, Eckert and Rickford2001: 122) and trying to sound authentically ‘Welsh’, potentially altering their phonetic production as part of a style-shift. Since aspiration vs. non-aspiration of stops is a relatively salient feature of Welsh vs. Spanish phonetic production, this could conceivably affect speakers' productions of VOT. In the naturalistic speech of the corpus recordings, however, effects of the consciousness of observation are expected to be reduced due to both the less formal nature and longer duration of the recording, and the first five minutes of each recording after the researcher left the room are not included in the corpora.
2.2 Phonetic method
Nine female and nine male speakers from each of three age categories – Young (0–29 years), Middle (30–59 years), and Older (60+ years) – were selected from each corpus, yielding eighteen Patagonian speakers and eighteen speakers from Wales, for a total of 36. Speakers were selected based on the availability of tokens in their recorded discourse suitable for measuring the VOT of word-initial Welsh stops /p/, /t/, and /k/. The youngest speaker from Patagonia was 18 at the time of recording, and the youngest speaker from Wales was 15; the oldest speaker from Patagonia was 82, and the oldest speaker from Wales was 81.
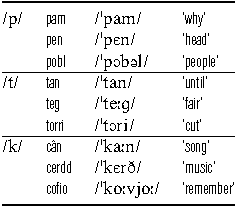
Since vowel quality has been shown to affect VOT, particularly in relation to vowel height (Klatt Reference Klatt1975), all tokens consisted of words with word-initial /p/, /t/, or /k/ followed by one of the non-high vowel pairs /aaː/, /ɛ eː/, or /ɔ oː/. In addition, in order to minimize the effects of different domain positions and stress on VOT (Jun Reference Jun1993, Keating et al. Reference Keating, Cho, Fougernon, Hsu, Local, Ogden and Temple2003), tokens were taken from non-prominent words in phrase-medial domains, and with initial world-level stress wherever possible. A selection of example tokens is given in Table 4.
Example tokens produced by speakers.

For each speaker, up to twelve tokens representing each initial consonant under investigation were selected for analysis. While ideally the data would include twelve tokens of each sound for every speaker, the realities of drawing data from a corpus of natural speech – including background noise, overlap, and other obfuscating environmental factors – in addition to the specificity of the token selection process – phrase-medial, non-prominent realizations – meant that often speakers produced fewer than twelve tokens for at least one initial consonant.
Individual tokens were extracted from longer conversations using ELAN (Brugman & Russel Reference Brugman, Russel, Lino, Xavier, Ferreira, Costa and Silva2004), and analyzed in Praat (Boersma & Weenink Reference Boersma and Weenink2015) using a downsampled version (to 22.5 kHz) of the original .wav file. VOT was measured from waveforms and with the aid of a time-aligned spectrogram in seconds. Positive VOT was measured from the first stop burst (in cases with multiple bursts) to the first peak in the waveform following the zero crossing with the onset of the following vowel. Tokens in which the release burst and the start of voicing coincided were treated as zero VOT. Cases of negative VOT did not occur in the targeted tokens examined.
2.3 Statistical method
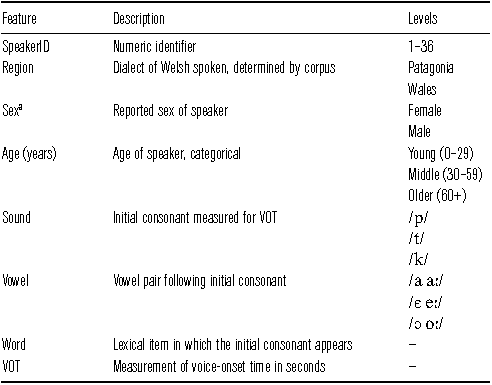
In total, 708 tokens were analyzed. Once isolated, each token was coded for the features presented in Table 5.
Features coded.

a This category and its binary levels come directly from the corpora; no information about speaker gender identity is provided.
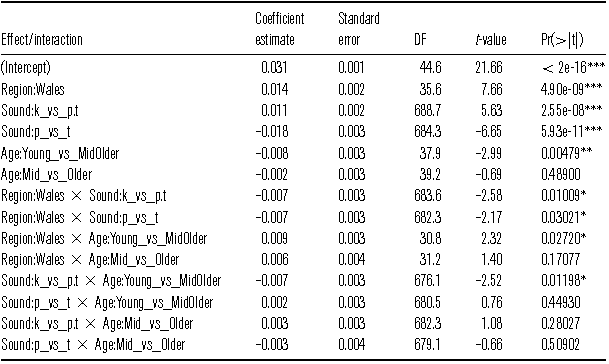
The data were analyzed in R (R Core Team Reference Core Team2015) through a linear mixed-effects model using the lme4 package (Bates et al. Reference Bates, Mächler, Bolker and Walker2014), with VOT as the dependent variable. Since previous cross-linguistic research has shown that VOT is consistently longer for velar stops than for both alveolar or bilabial stops, while alveolar stops can have longer or shorter VOT than bilabial stops depending on language and articulatory factors (Lisker & Abramson Reference Lisker and Abramson1964, Cho & Ladefoged Reference Cho and Ladefoged1999), contrasts were set a priori between /k/ and /pt/ on the one hand, and between /p/ and /t/ on the other (Gries Reference Gries2013). Similarly, as a result of an initial modeling process which showed that Age:Middle and Age:Older speakers in this study pattern together in terms of VOT, user-defined contrasts were also set in the predictor Age between Young and Middle/Older on the one hand, and between Middle and Older on the other.
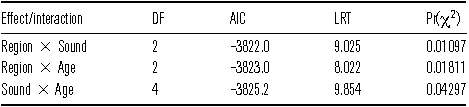
Following Zuur et al. (Reference Zuur, Ieno, Walker, Saveliev and Smith2009: 127), the optimal random-effects structure of the model was first determined using restricted maximum likelihood estimation (REML), with the result that SpeakerID was included as a random effect, as an adjustment to intercepts, and Word was discarded. Next, the fixed-effects structure was determined starting from a maximal model with all main effects and their pairwise interactions using maximum likelihood estimation (ML), with p-values calculated via the lmerTest package (Kuznetsova, Brockhoff & Christensen Reference Kuznetsova, Brockhoff and Christensen2017). This procedure resulted in three significant predictors of VOT being retained: the interaction between Region and Sound (Pr(χ2) = 0.01097), the interaction between Region and Age (Pr(χ2) = 0.01811) and the interaction between Sound and Age (Pr(χ2) = 0.04297). With the fixed-effects structure set, the final model was re-computed using REML, and visualization was carried out using ggplot2 (Wickham Reference Wickham2009). After linear mixed-effects modeling, post-hoc pairwise t-tests using conservative Bonferroni corrections were used to determine significant effects between specific predictor levels within the context of the final model.
3 Results
The results of the final mixed-effects model (R2marginal = 0.39; R2conditional = 0.43) are shown in Tables 6–8.
Highest-level predictors.

DF = degrees of freedom; AIC = Akaike information criterion;
LRT = likelihood-ratio test
Random effects.

Fixed effects.

*** = 0; ** = .001; * = .01
Most importantly, within the interaction of Region and Sound, these results show that VOT for the Welsh voiceless stops does vary by region in the direction predicted by Jones' (Reference Jones, Ball and Jones1984) observations: Patagonian speakers produce each of the voiceless stops /p/ (p = 4.6e-10), /t/ (p = 9.3e-11), and /k/ (p = 6.9e-06) with significantly lower VOT values than speakers from Wales.
This result is shown in Figure 1. The graph depicts the mean VOT for each segment in both regions side-by-side, with Patagonian speakers (/p/ = 18 ms, /t/ = 35 ms, /k/ = 38 ms) on the left side and speakers from Wales (/p/ = 31 ms, /t/ = 56 ms, /k/ = 48 ms) on the right, showing that, on the whole, Patagonian speakers produce the voiceless stops /ptk/ with shorter VOT values than speakers from Wales.
Effect of Region by Sound on VOT (whiskers show 95% confidence intervals).

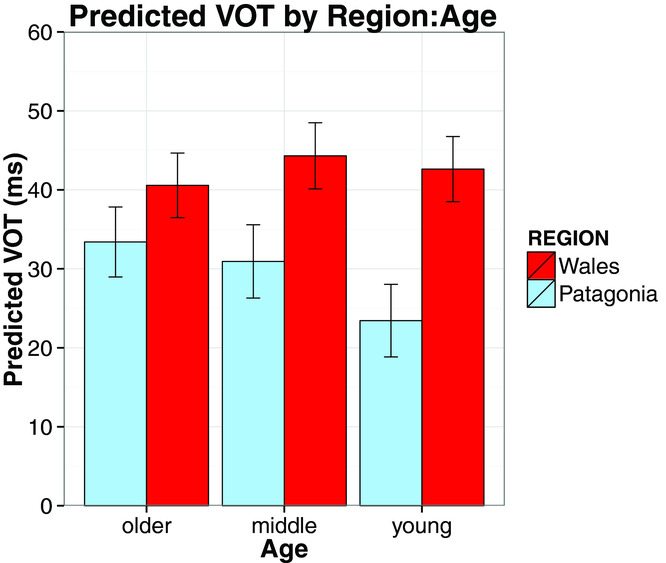
The interaction between Region and Age was also a significant predictor of VOT in this model, and can be seen in Figure 2. This graph shows mean VOT values for each of the three age groups in both Patagonia and Wales, and illuminates several interesting patterns of age gradation across the two regions. First, there is no significant age effect on VOT in Wales – none of the three age groups of speakers from Wales differs significantly from any other in terms of overall VOT. There is, however, a significant difference among Patagonian speakers, with Young Patagonian speakers producing significantly shorter VOT than Older Patagonian speakers (p = .002). And while Older Patagonian speakers still produce significantly shorter VOT values than Older Wales speakers (p = .005), the divergence in means is greater between Middle Patagonian and Middle Wales speakers (p = 2.6e-06), and greater still between Young Patagonian and Young Wales speakers (p = 4.6e-15). This indicates that the trend of divergence is increasing in apparent time, so while significantly lower VOT values are found throughout Patagonian speakers with respect to speakers from Wales, younger speakers show the most advanced effects of this phenomenon, as would be expected in a diachronic shift.
Effect of Region by Age on VOT (whiskers show 95% confidence intervals).

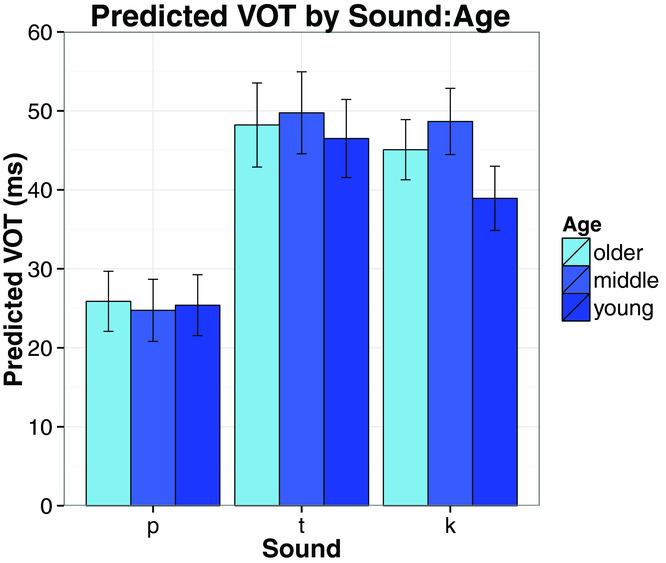
The final significant predictor of VOT was the interaction between Sound and Age, shown in Figure 3. This graph shows mean VOT values for each of the voiceless stops by age group, and illustrates that no significant difference in VOT exists by age for /p/ or /t/. There is one significant difference for /k/, however, with Young speakers producing significantly lower VOT values than Middle speakers (p = .004). As the mean VOT for /k/ for Middle speakers as a whole is 48 ms, this difference is likely driven by Young speakers from Patagonia (mean /k/ VOT = 28 ms) rather than Young speakers from Wales (mean /k/ VOT = 46 ms).
Effect of Age by Sound on VOT (whiskers show 95% confidence intervals).

4 Discussion
These results confirm the hypothesis suggested by Jones' (Reference Jones, Ball and Jones1984) observations: Patagonian speakers produce each of the Welsh voiceless stops /ptk/ with shorter VOT than speakers from Wales. While the interaction between Region and Age shown in Figure 2 shows that younger Patagonian speakers are leading this change, and diverge further from speakers from Wales than their Middle or Older counterparts, the difference between Patagonian and Welsh speakers is still significant within each age group, indicating that the age-graded difference is aspiration seen in Jones' study has resulted in a diachronic shift. In Jones' results, younger speakers produced Welsh /ptk/ with unaspirated ‘Spanish phones’, middle-aged speakers varied in whether they used unaspirated or aspirated /ptk/ based on their degree of affiliation with Welsh cultural institutions in Patagonia, and older speakers used aspirated /ptk/, as in Welsh spoken in Wales. Here, however, the effect of Region on VOT holds across Age groups; Patagonian speakers of each age group produce Welsh voiceless stops with lower VOT values than their Welsh counterparts. Since the very oldest speakers in the present study are peers of speakers in Jones' middle-aged category from 1971 to 1973, this indicates that the less-aspirated voiceless stops seen in Jones' younger and middle-aged speakers represented the beginnings of a diachronic shift, rather than simply a synchronically age-graded pattern.
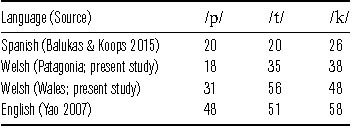
For reference, Table 9 provides the mean VOT values for each dialect from the present study, along with those of their respective contact languages as measured in corpus studies of spontaneous speechFootnote 2, also plotted in Figure 4.
Average VOT (ms) in Spanish, Welsh, and English.

Average VOT in Spanish, Welsh, and English.

In this context, the two varieties of Welsh fit into a continuum of VOT values that points towards phonetic influence from contact: Patagonian Welsh patterns closer to Spanish, and the Welsh spoken in Wales patterns closer to English. While the (New Mexican) Spanish and (American) English VOT values above are not necessarily representative of the specific bilingual speech patterns of the Patagonian and Welsh speakers in this sample, the results still show language contact effects with shorter VOT values in bilingual Welsh/Spanish speakers and longer VOT in Welsh/English speakers. The pattern seen above is consistent with Fowler et al.’s (Reference Fowler, Sramko, Ostry, Rowland and Hallé2008) results, for instance, which show that bilingual French–English speakers in Montréal produced French voiceless stops with longer VOT values than monolingual French speakers, and English voiceless stops with shorter VOT than monolingual English speakers, each as a result of cross-language phonetic influence. The fact that Patagonian speakers produce voiceless Welsh stops with lower VOT values than speakers from Wales indicates an analogous effect of ‘phonetic pull’ from each of the respective contact languages.
Further, any lowering in VOT values of unaspirated stops is significant in Welsh because, as discussed above, Welsh canonically contrasts initial /ptk/ and /bd ɡ/ phonetically on the basis of aspiration, rather than voicing – both sets of stops are phonetically realized as voiceless, with the difference in VOT providing the main perceptual cue for the phonological distinction (Ball Reference Ball, Ball and Jones1984: 15). This means that the shorter VOT in Patagonian Welsh could potentially point towards a phonological transfer in bilingual speakers, since it actually represents a move away from maximum perceptibility in monolingual (Welsh) terms. If Patagonian Welsh /bd ɡ/ values have begun to shift towards or even into negative values as a form of differentiation from shortened /ptk/, this could mean that the contrast between voiceless aspirated /ptk/ and voiceless unaspirated /bd ɡ/ previously reported in the Welsh spoken in Wales could move towards a contrast between voiceless unaspirated /ptk/ and voiced /bd ɡ/, in terms of Cho & Ladefoged's (Reference Cho and Ladefoged1999) phonetic realizations of the voicing contrast. Future research should therefore investigate Patagonian Welsh speakers' productions of /bd ɡ/ in terms of VOT measurements, to see if a shortening effect analogous to the one seen in the voiceless series /ptk/ has taken place as a result of contact with Spanish.
Aside from the significant predictors of VOT, the data also show a few potential points of interest in terms of phonetic features of Patagonian Welsh. The first is that all tokens in the data (n = 23) which displayed 0 VOT – that is, where the voicing on the following vowel begins at the same time as the stop release – came from Patagonian speakers, and predominately (n = 19/23) for tokens of /p/. This phenomenon, and its localization to Patagonian Welsh, is consistent with the general finding that Patagonian speakers produce voiceless stops with shorter VOT than speakers from Wales. In terms of language contact, it is also consistent with accounts of Spanish as having voiceless stops with ‘unaspirated’ or ‘near-zero’ (a category which includes zero) VOT (Lisker & Abramson Reference Lisker and Abramson1964, Cho & Ladefoged Reference Cho and Ladefoged1999, Dmitrieva et al. Reference Dmitrieva, Llanos, Shultz and Francis2015). Similarly, the fact that no speakers from Wales produced any stops with 0 VOT means that this could be a distinctive, contact-induced feature of Patagonian Welsh.
In the overall distribution of the data for each sound shown in Figure 5, which illustrates density of observations by relative width and marks the mean of each group (Patagonia /p/ = 18 ms, Patagonia /t/ = 35 ms, Patagonia /k/ = 38 ms, Wales /p/ = 31 ms, Wales /t/ = 56 ms, Wales /k/ = 48 ms), we can see that these 0 VOT cases play a part in distinguishing the Patagonian pattern from the Welsh data for /p/.
Distribution of observed VOT for /ptk/ by Region.

This graph also shows that Patagonian speakers produce a range of shorter, Spanish-like VOTs and longer, more canonically Welsh-like VOTs, but that – as expected from the results – the overall pattern sees Patagonian speakers producing shorter VOTs than speakers from Wales.
5 Conclusions
The results of this study show that Welsh–Spanish bilingual Patagonian Welsh speakers produce the voiceless stops /p/, /t/, and /k/ with lower VOT values than Welsh–English bilingual speakers from Wales. These results confirm and quantify the observation in Jones (Reference Jones, Ball and Jones1984) that younger speakers of Patagonian Welsh have developed less aspirated voiceless stops through increased contact with Spanish. The effect seen in the present study applies to Patagonian Welsh speakers of all ages – though younger speakers are more divergent between the two regions than older speakers – indicating that a diachronic shift has taken place, resulting in lower VOT values on voiceless stops as a unique phonetic feature of Patagonian Welsh.
Importantly, this contact-induced phonetic change may have phonological implications. Welsh, like English but unlike Spanish, has been reported to contrast the stop series /ptk/ and /bd ɡ/ on the phonetic basis of aspiration rather than voicing (Lisker & Abramson Reference Lisker and Abramson1964, Ball Reference Ball, Ball and Jones1984, Cho & Ladefoged Reference Cho and Ladefoged1999), and a shortening of VOT in the voiceless series thus results in a shift away from maximum perceptibility. Further research should therefore examine the VOT values of the stop series /bd ɡ/ in Patagonian Welsh, to see whether these stops have undergone a similar shift – or even begun to move into negative VOT values and a true voicing distinction – as a result of the contact-induced change in /ptk/.
Finally, with the sociolinguistic situation in Chubut changing constantly, it will be important to continue systematically studying the effects of language contact in Patagonian Welsh in order to get a fuller sense of the dialect as it is spoken in Patagonia today. A recent rise in Wales–Patagonia exchange programs (Birt Reference Birt and Néill2005), the 2008 introduction of the Menter Patagonia program – where young people from Wales are brought over to Patagonia to act as community teachers and language advisors each year – and an influx of Welsh-speaking visitors for the colony's recent sesquicentennial celebrations in 2015 all point towards the increasing importance of another contact language for Patagonian Welsh: Welsh from Wales. Whether that contact leads to dialect leveling – potentially including a reversal of the VOT shift seen here – or further divergence remains to be seen, and the results are likely to be determined by the sociocultural realities of language contact in Patagonia as much as structural factors.
Acknowledgments
I am so grateful to the researchers, transcribers, and translators at the ESRC Centre for Research on Bilingualism in Theory & Practice at University of Wales, Bangor, who worked to create the excellent Bangor Siarad and Bangor Patagonia corpora, along with the generous speakers who contributed their time and conversation, without which this (and much other) research would not have been possible. I would also like to thank Matt Gordon, Marianne Mithun, and Stefan Gries for their invaluable guidance and help on this project, as well as Jessica Love-Nichols, Kayla Palakurthy, Elise Bell, and two anonymous reviewers for their very helpful feedback on earlier drafts. Any remaining errors are my own.