1. Introduction
During the last few decades, a huge amount of work has been devoted to dusty plasmas (Janaki & Dasgupta Reference Janaki and Dasgupta1998) due to their wide range of application in different plasma processing technologies (Tsytovich, Morfill & Thomas Reference Tsytovich, Morfill and Thomas2002; Morfill, Tsytovich & Thomas Reference Morfill, Tsytovich and Thomas2003) in the microelectronics industry e.g. thin film deposition, sputtering and semiconductor substrate etching (Wang, Chen & Huang Reference Wang, Chen and Huang2019) as well as in several astrophysical plasma environments such as planetary rings, comet tails and asteroid zones (Prajapati Reference Prajapati2011; Hong & Jung Reference Hong and Jung2016). The nonlinear analysis of dusty plasmas, such as the existence of various kinds of shock waves in dusty plasmas, is carried in Popel, Tsytovich & Yu (Reference Popel, Tsytovich and Yu1998) to show that dust charging processes results in a new kind of shock wave. The experimental and theoretical estimation of dusty plasmas is presented in Tsytovich (Reference Tsytovich1997), where the authors discuss in detail the dusty grain attraction and the self-contraction instabilities etc. Dust ion acoustic shock waves in a Q-machine are formulated in Popel et al. (Reference Popel, Losseva, Golub, Merlino and Andreev2005) to show that the most important dissipative processes are the charging of dust grains, the absorption of ions by grains etc. The dust charging equations were formulated in Tsintsadze & Tsintsadze (Reference Tsintsadze and Tsintsadze2008) to emphasize that the surface charge fluctuations and the total current remain invariant in electrodynamics and it was pointed out in this paper that papers published on dust charging need to be amended accordingly.
In tokamaks, the impurities coming out from the walls of the vessel can create a dusty plasma at the edge of the discharge, and in the environment of Earth, the plasma usually encounters an interface with two plasmas of different densities, a plasma–vacuum boundary or a conducting interface. Such bounded plasma allows the propagation of various kinds of surface waves (SWs) along the interface (Trivelpiece & Gould Reference Trivelpiece and Gould1959; Allis, Buchsbaum & Bers Reference Allis, Buchsbaum and Bers1963; Mcbride & Kaw Reference Mcbride and Kaw1970; Vladimirov & Yu Reference Vladimirov and Yu1993; Cramer & Vladimirov Reference Cramer and Vladimirov1996).The SW is one of the important phenomena in atomic spectroscopy (Hubert et al. Reference Hubert, Bordeleau, Tran, Michaud, Milette, Sing, Jalbert, Boudreau, Moisan and Margot1996), plasma diagnostics, (Shivarov, Stoychev & Russeva Reference Shivarov, Stoychev and Russeva1975) laser fusion and corona (Buti Reference Buti1985; Aliev & Brodin Reference Aliev and Brodin1990) as well as in various astrophysical situations such cornet tails downstream from the nucleus bounded and separated from the surrounding regions (Aroj, Rozina & Jamil Reference Aroj, Rozina and Jamil2016), white dwarf stars magnetars (Glenzer et al. Reference Glenzer, Landen, Neumayer, Lee, Widmann, Pollaine, Wallace, Gregori, Holl and Bornath2007) and the interface of a plasmon (Ritchie Reference Ritchie1957; Trivelpiece & Gould Reference Trivelpiece and Gould1959) etc. In addition, plasma surface waves (Moisan, Shivarova & Trivelpiece Reference Moisan, Shivarova and Trivelpiece1982; Grozev, Shivarova & Tanev Reference Grozev, Shivarova and Tanev1991; Margot & Moisan Reference Margot and Moisan1993; Zhelyazkov & Atanassov Reference Zhelyazkov and Atanassov1995) were found to be in good agreement between the theoretical estimations and the available experimental data.
In the past, SW phenomenon has been investigated for various dusty plasma interfaces such as the propagation of SWs at the interface of two dusty plasmas which was discussed in Cramer et al. (Reference Cramer, Vladimirov, Ostrikov and Yu1999). In various laboratory situations, the different aspects of surface waves at the interface of a dusty plasma and a metallic or a dielectric interface were followed in Ostrikov, Yu & Azarenkov (Reference Ostrikov, Yu and Azarenkov1998), Cramer et al. (Reference Cramer, Vladimirov, Ostrikov and Yu1999), Ostrikov, Yu & Sugai (Reference Ostrikov, Yu and Sugai1999), and Ostrikov, Yu & Stenflo (Reference Ostrikov, Yu and Stenflo2000). In this context, one of the important types of SW includes the inhomogeneity of the fluid caused by the gravitational field (Landu & Lifshitz Reference Landu and Lifshitz1984), which may propagate on the interface of an incompressible fluid such that pressure varies with height. Consequently, the displacement of fluid in height may destroy the equilibrium state, leading to oscillatory motions at the interface, known as gravity waves. The stability analysis of such gravity waves at the charged interface of an electron–positron pair plasma and a vacuum was discussed in Tsintsadze (Reference Tsintsadze1998). By following one fluid magnetohydrodynamic (MHD) model, the gravity SWs were investigated in Tsintsadze et al. (Reference Tsintsadze, Rozina, Shah and Murtaza2007), to discuss the surface charge instability at the interface of a dusty cloud and vacuum. More recently, gravity SWs at the interface of an incompressible electron–ion plasma and a vacuum were discussed in Rozina et al. (Reference Rozina, Tsintsadze, Tsintsadze and Ruby2019), to show that both surface charge and surface gravitational oscillations are coupled together to address star formation through the surface Jeans instability. It was determined in these papers that the one fluid MHD approximation does not hold (Tsintsadze Reference Tsintsadze1998) in the presence of a large gradient in surface charge density, especially on the surface between plasma and vacuum due to the fact that the thermal speed of electrons is much larger than that of ions and dust, so electrons are the most favourable candidate to diffuse on the surface, thus disturbing the electrical neutrality of the plasma. In other words in the absence of an external electric field, both the separation of charge and the potential field on the plasma–vacuum interface are maintained only by the thermal motion of the electrons (Tsintsadze Reference Tsintsadze1998) such that  $e\varPhi \sim K_{B}T_{e}$. Presently, we aim to investigate the surface Jeans instability at the charged interface of a self-gravitating–radiative dusty plasma and vacuum, while taking into account the energy equation to address the temperature oscillations, which may generate charges on the interface.
On the other hand, it is also well known that the gravitational pressure plays a vital role in the dusty plasma collapse, resulting in the formation of large astrophysical dusty objects. Relying on the density and mass of the dusty grain, the electrostatic forces on the dusty grain become comparable to the gravitational forces, thus introducing the concept of the gravitational or Jeans instability. In this context, a huge amount of work is devoted to investigating the influence of different aspects of the Jeans instability such as the influence of thermal radiation (Tsintsadze et al. Reference Tsintsadze, Rozina, Shah and Murtaza2008), quantized magnetic pressure (Tsintsadze et al. Reference Tsintsadze, Rozina, Ruby and Tsintsadze2018), degree of ionization (Shukla & Stenflo Reference Shukla and Stenflo2006), fluid viscosity (Mamun & Shukla Reference Mamun and Shukla2000), rotation (Janaki, Chakrabarti & Banerjee Reference Janaki, Chakrabarti and Banerjee2011), effect of magnetic fields (Goldreich & Lynden-Bell Reference Goldreich and Lynden-Bell1965) and many other parameters that significantly influence the Jeans criterion. The importance of the self-gravitating, magnetized gravitational instability in the case of an astronomical plasma was discussed in Chandrashekhar (Reference Chandrashekhar1961). However, in all of these above mentioned works, the Jeans instability criterion is related to the dust density oscillations. To the best of our knowledge no work has been devoted to investigating the surface Jeans instability of an incompressible dusty plasma.
Our objective here is to present compact MHD equations for a dense, incompressible dusty plasma to formulate the surface Jeans instability, by assuming that the characteristic wave frequency is sufficiently smaller than the ion gyrofrequency so that the electron and ion inertial forces are negligibly small as compared to their associated Lorentz forces. We assume that plasma is under the influence of electric, magnetic, gravitational forces as well as thermal radiation and shall show that the inclusion of the radiated heat transfer term in the MHD equations will change the dispersive properties of SWs. We shall depict here that the electron surface charge and the surface dust mass density oscillations will couple together to generate the surface Jeans instability in a radiative dusty plasma, thus leading to gravitational collapse of astrophysical objects. The low frequency dusty MHD SWs presented here are applicable to the boundaries of sunspots, coronal holes, coronal loops and canopies in the chromosphere etc.
2. Basic model
In order to investigate the SW phenomena at the interface of a radiative plasma and vacuum, we assume an incompressible diluted gas composed of photons, electrons, ions and dusty grains, considered under the influence of electromagnetic thermal radiation, electric, magnetic and gravitational forces. We also suppose that thermal effects are important for electrons and ions only, while gravity will be taken into account for massive dusty grains. We choose a geometry such that the plasma lies in the  $y{-}z$ plane and the vacuum is normal to the surface i.e. the
 $x$-axis. For our purposes the basic set of equations includes Poisson's equations for the gravitational potential
 $\varPsi$ and electrostatic potential
 $\varPhi$, respectively, as
 \begin{gather} \nabla^{2}\varPsi=4{\rm \pi} G\rho_{d}, \end{gather}
 \begin{gather}\boldsymbol{\nabla}\boldsymbol{\cdot}\boldsymbol{E}=4{\rm \pi}\rho_{e}=4{\rm \pi} e\left[ Z_{i}n_{i}-n_{e} -Z_{d}n_{d}\right] , \end{gather}
the Maxwell's equations,
 \begin{gather} \boldsymbol{\nabla}\boldsymbol{\cdot}\boldsymbol{H}=\boldsymbol{0}, \end{gather}
 \begin{gather}\boldsymbol{\nabla}\times\boldsymbol{H}=\frac{4{\rm \pi}}{c}\boldsymbol{J}, \end{gather}
 \begin{gather}\boldsymbol{\nabla}\times\boldsymbol{E}=-\frac{\partial\boldsymbol{H}}{\partial t}, \end{gather}
the continuity equation of plasma species
 \begin{equation} \frac{\partial n_{e,i,d}}{\partial t}+\boldsymbol{\nabla}\boldsymbol{\cdot}(n_{e,i,d}\boldsymbol{v} _{e,i,d})=0 \end{equation}
and the MHD equation
 \begin{equation} \boldsymbol{E}+\boldsymbol{v}\times\boldsymbol{H}=\eta\boldsymbol{J}, \end{equation}
where  $H$ is the magnetic field,
 $\eta$ is the resistivity and all other are usual plasma notations. We shall incorporate here the thermodynamics of a photon gas presented in Tsintsadze, Callebauti & Tsintsadze (Reference Tsintsadze, Callebauti and Tsintsadze1996), where it was shown that when an electron executes a quantum jump in the electric field of an ion, it may emit a photon or it may absorb a photon, thus attaining additional kinetic energy, and we formulate the pressure expression of a high density and low temperature plasma medium i.e.
 $\hbar \omega _{p\,e,i}/T_{e,i}\gg 1$, involving the electromagnetic radiation in a plasma medium in terms of electron–ion radiation energy density
 $(E_{r\,e,i})$, as
 \begin{equation} \frac{3}{2}p_{re,i}=E_{re,i}\equiv\frac{0.202T_{e,i}^{4}b_{e,i}^{3/2}}{(\hbar c)^{3}}. \end{equation}
Here,  $b_{e,i}=\hbar \omega _{pe,i}/T_{e,i}$, with
 $\omega _{pe,i}[ =(4{\rm \pi} n_{0e,i}e^{2}/m_{e,i})^{1/2}]$,
 $T_{e,i}$ and
 $\hbar$ as the plasma oscillation frequency, thermal temperature (in energy units) and scaled Planck constant respectively. (2.8), was derived by Tsintsadze et al. (Reference Tsintsadze, Callebauti and Tsintsadze1996). Let us rewrite (2.8) as
 \begin{equation} p_{re,i}=\frac{2E_{re,i}}{3}=\alpha_{re,i}T_{e,i}^{5/2}\quad \text{with } \alpha_{r_{e,i}}=\frac{0.202}{\left(\hbar c\right)^{3}}(\hbar \omega_{p_{e,i}})^{3/2}. \end{equation}
In our present investigation, we shall take into account the radiation pressure due to plasma particles (via (2.8)) in the electron–ion momentum equations besides the usual thermal pressure (Tsintsadze et al. Reference Tsintsadze, Rozina, Shah and Murtaza2007), whereas both thermal and radiation pressures will be ignored for the massive dusty grains, so dusty grains will be assumed to have a constant charge. Accordingly, the momentum equations for inertialess electron–ion and inertial dusty grains are respectively
 \begin{gather} -en_{e}\boldsymbol{E}-\frac{e}{c}n_{e}\left(\boldsymbol{u}_{e}\times\boldsymbol{H} \right) -\boldsymbol{\nabla}\left(P_{te}+P_{re}\right) =0, \end{gather}
 \begin{gather}+Z_{i}en_{i}\boldsymbol{E}+\frac{Z_{i}en_{i}}{c}\left(\boldsymbol{u}_{i} \times\boldsymbol{H}\right) -\boldsymbol{\nabla}\left(P_{ti}+P_{ri}\right) =0, \end{gather}
and
 \begin{equation} m_{d}n_{d}\frac{\textrm{d}\boldsymbol{u}_{d}}{\textrm{d}t}=-Z_{d}en_{d}\boldsymbol{E}-\frac{Z_{d}en_{d} }{c}\left(\boldsymbol{u}_{d}\times\boldsymbol{H}\right) -m_{d}n_{d}\nabla \varPsi, \end{equation}
where thermal effects of the dusty grains are ignored due to their large mass. Adding (2.8)–(2.10), we obtain one fluid radiative–magnetohydrodynamic (RMHD) equation
 \begin{equation} \rho_{d}\frac{\textrm{d}\boldsymbol{u}_{d}}{\textrm{d}t}=e(Z_{i}n_{i}-n_{e}-Z_{d}n_{d} )\boldsymbol{E}+\frac{1}{c}(\boldsymbol{J}\times\boldsymbol{H})-\boldsymbol{\nabla}\left(P_{t} ^{t}+P_{r}^{t}\right) -\rho_{d}\nabla\varPsi, \end{equation}
where  $J=-e[ -Z_{i}n_{i}\boldsymbol {u}_{i}+n_{e}\boldsymbol {u}_{e}+Z_{d} n_{d}\boldsymbol {u}_{d}]$ is the plasma current density,
 $P_{t}^{t} =P_{te}+P_{ti}$ and
 $P_{r}^{t}=P_{re}+P_{ri}$. It is essential to indicate here that the electric field
 $E$ arising due to the charge separation on the interface is perpendicular to the surface of the plasma instead of the usual parallel component, i.e.
 $E=-\nabla _{\bot }\varPhi$ is normal to the plasma surface at every point. Let us rewrite (2.2) to have
 \begin{equation} \rho_{e}\boldsymbol{E}=\frac{1}{4{\rm \pi}}\left(\boldsymbol{\nabla} \boldsymbol{\cdot} \boldsymbol{E}\right) \boldsymbol{E}=\frac{1}{8{\rm \pi}}\boldsymbol{\nabla}_{x}E^{2}, \end{equation}
here  $\rho _{e}=e[ Z_{i}n_{i}-n_{e}-Z_{d}n_{d}]$ is the charge density and
 $E=-{\partial \varPhi }/{\partial x}$. Substituting (2.4) and (2.14) into (2.13), we obtain
 \begin{equation} \rho_{d}\frac{\textrm{d}\boldsymbol{u}_{d}}{\textrm{d}t}=\frac{1}{8{\rm \pi}}\boldsymbol{\nabla}_{n} E^{2}-\boldsymbol{\nabla}\left(P_{t}^{t}+P_{r}^{t}+\frac{H^{\mathbf{2}}}{8{\rm \pi} }\right) +\frac{1}{4{\rm \pi}}\boldsymbol{H}\left(\boldsymbol{H}\boldsymbol{\cdot} \boldsymbol{\nabla}\right) -\rho _{d}\nabla\varPsi, \end{equation}
where  $\rho _{d}=m_{d}n_{d}$ is the mass density of dusty grains, here the first term on the right-hand side of (2.15) is the negative pressure gradient acting normal to the plasma–vacuum interface. Using (2.5), (2.7) we may obtain the following MHD equation
 \begin{equation} \frac{\partial\boldsymbol{H}}{\partial t}=\boldsymbol{\nabla}\times\left(\boldsymbol{u}\times \boldsymbol{H}\right) . \end{equation}
Since the dusty plasma under consideration is an incompressible fluid, in this case the fluid continuity (2.6) reduces to  $\boldsymbol {\nabla }\boldsymbol {\cdot } \boldsymbol {u}=0$, which further allows us to express
 $u$ as the gradient of the scalar potential
 $\boldsymbol{\mathsf{F}}$ i.e.
 $u=\nabla \boldsymbol{\mathsf{F}}$, or
 \begin{equation} \nabla^{2}{\boldsymbol{\mathsf{F}}}=0. \end{equation}
It is noticeable here that electrons (the electron being the lightest particle as compared to the ions) may jump to the interface due to the high thermal speed and are the most favourable candidate to diffuse there, so on the plasma–vacuum interface only an electron charge will appear. Since in the equilibrium state the free charged surface of dusty plasma under the influence of gravitational, magnetic and radiation fields is plane, consequently one may write (2.2) as
 \begin{equation} E_{0x}=4{\rm \pi}\int\rho_{0e}\,\textrm{d}x=4{\rm \pi}\sigma_{se}, \end{equation}
where  $\sigma _{se}=en_{0e}x$ is the electron surface charged density. One can write the equilibrium electrostatic potential,
 $\varPhi _{0}$, from (2.18) as
 \begin{equation} \varPhi_{0}=-4{\rm \pi}\sigma_{se}x. \end{equation}
Similarly, the equilibrium gravitational potential  $\varPsi$ can be calculated from (2.1) as
 \begin{equation} \varPsi=4{\rm \pi} G\sigma_{sd}x, \end{equation}
where  $\sigma _{sd}=m_{d}n_{0d}x=\rho _{0d}x$ is the dust surface mass density. Further, in the linear approximation, when the plasma surface is perturbed, the oscillating electrostatic and gravitational potentials will take the following forms respectively,
 \begin{gather} \delta\varPhi=4{\rm \pi}\sigma_{se}\zeta\left(y,z,t\right), \end{gather}
 \begin{gather}\delta\varPsi=-4{\rm \pi} G\sigma_{sd}\zeta\left(y,z,t\right), \end{gather}
where  $\delta \varPhi$ and
 $\delta \varPsi$ are the perturbed electrostatic and gravitational potentials, respectively,
 $\zeta (y,z,t)$ is the displacement of the surface above the equilibrium position. For surface waves with small amplitude, we can represent
 $\delta _{\varPhi ,\varPsi } \sim \exp [ \textrm {i}(k_{y}y+k_{z}z-\omega t) -kx]$ where
 $k^{2}=(k_{y}^{2}+k_{z}^{2})$ and
 $(k>0)$ which vanishes for
 $x\rightarrow \infty$. By making use of (2.14) and (2.19), one may have
 \begin{equation} \frac{E_{x}^{2}}{8{\rm \pi}}=2{\rm \pi}\sigma_{se}^{2}+k\sigma_{se}\delta\varPhi|_{x=0} =2{\rm \pi}\sigma_{se}^{2}+4{\rm \pi}\sigma_{se}^{2}k\zeta\left(y,z,t\right). \end{equation}
In the case of linear oscillations (the convective derivative is ignored) the normal component of the velocity  $v_{x}$ on the surface is described as the time derivative of
 $\zeta (y,z,t)$,
 $u_{dx}={\partial \zeta }/{\partial t}$. Also, as mentioned above,
 $u=\nabla \boldsymbol{\mathsf{F}}$, so
 $u_{dx} ={\partial \boldsymbol{\mathsf{F}}}/{\partial x}$, or by comparing both velocities we may write
 \begin{equation} \left.\frac{\partial{\boldsymbol{\mathsf{F}}}}{\partial x}\right|_{x=0}=\frac{\partial\zeta }{\partial t}. \end{equation}
Since for an incompressible plasma the usual definition of thermal pressure is not applicable, and as we consider the plasma–vacuum interface to be under tension due to two types of oppositely directed pressures (one is the negative pressure gradient  $\nabla _{n}E^{2}$ acting upward and the other is the coupled thermal and radiation pressure acting downwards to the surface), so we shall follow Laplace's formula
 $P-P_{0}=-\alpha ({\partial ^{2} \zeta }/{\partial y^{2}}+{\partial ^{2}\zeta }/{\partial z^{2}})$ (Tsintsadze et al. Reference Tsintsadze, Rozina, Shah and Murtaza2007); here
 $P$ and
 $P_{0}$ are the pressures of the two media (plasma and vacuum) and
 $\alpha$ represents the coefficient of surface tension. Applying a Fourier transform to the
 $x$ component of (2.15) and taking into account (2.23), (2.24) then integrating, we may obtain a differential equation at the interface as
 \begin{align} &\left[ \frac{\partial{\boldsymbol{\mathsf{F}}}}{\partial t}-\frac{k\sigma_{se}}{\rho_{d} }\delta\varPhi+\left(\frac{\partial\delta P_{r}}{\partial T}\right) \frac{\delta T}{\rho_{d}}-\frac{H_{\mathbf{0}}}{4{\rm \pi}\rho_{d}}\frac {\partial}{\partial y}\int\delta H_{x}\,\textrm{d}x+\delta\varPsi\right.\nonumber\\ &\quad \left.\left.-\frac{\alpha}{\rho_{d} }\left(\frac{\partial^{2}\zeta}{\partial y^{2}}+\frac{\partial^{2}\zeta }{\partial z^{2}}\right) \right] \right|_{x=0}=0. \end{align}
We can define the sharp boundary condition on the interface by taking into account (2.21), (2.22) and (2.24) as
 \begin{gather} \frac{\partial\delta\varPhi}{\partial t}=4{\rm \pi}\sigma_{se}\frac{\partial\zeta }{\partial t}=4{\rm \pi}\sigma_{se}\left.\left(\frac{\partial{\boldsymbol{\mathsf{F}}}}{\partial x}\right)\right|_{x=0}, \end{gather}
 \begin{gather}\frac{\partial}{\partial t}\delta\varPsi=\left.-4{\rm \pi} G\sigma_{sd}\frac{\partial\zeta }{\partial t}=-4{\rm \pi} G\sigma_{sd}\left(\frac{\partial{\boldsymbol{\mathsf{F}}}}{\partial x}\right) \right|_{x=0}. \end{gather}
Equation (2.16) may lead to the following relation
 \begin{equation} \frac{\partial H_{x}}{\partial t}=H_{0}\frac{\partial v_{x}}{\partial y} =H_{0}\frac{\partial^{2}{\boldsymbol{\mathsf{F}}}}{\partial x\partial y}.\end{equation}
Next, differentiating (2.25) with respect to  $t$ and making use of (2.26)–(2.28), we get
 \begin{align} &\left[ \frac{\partial^{2}{\boldsymbol{\mathsf{F}}}}{\partial t^{2}}-\frac{4{\rm \pi}\sigma_{se} ^{2}k}{\rho_{d}}\frac{\partial{\boldsymbol{\mathsf{F}}}}{\partial x}+\frac{1}{\rho_{d} }\left(\frac{\partial P_{r}}{\partial T}\right) \frac{\partial\delta T}{\partial t}-V_{A}^{2}\frac{\partial^{2}{\boldsymbol{\mathsf{F}}}}{\partial y^{2}}\right.\nonumber\\ &\quad \left.\left.-4{\rm \pi} G\sigma_{md}\frac{\partial{\boldsymbol{\mathsf{F}}}}{\partial x}-\frac{\alpha}{\rho_{d}} \left(\frac{\partial^{2}}{\partial y^{2}}+\frac{\partial^{2}}{\partial z^{2} }\right) \frac{\partial{\boldsymbol{\mathsf{F}}}}{\partial x}\right] \right|_{x=0}=0, \end{align}
where  $V_{A}=(1/\sqrt {4{\rm \pi} \rho _{d}}) H_{0}$ is the magnetic Alfvén velocity. Now, in order to calculate the temperature oscillations
 $\delta T$, we shall consider the energy equation, which for non-relativistic temperatures is (Tsintsadze Reference Tsintsadze1995)
 \begin{equation} \frac{\partial}{\partial t}\left(\frac{3}{2}T+\frac{E_{re,i}}{n}\right) +\left(\boldsymbol{u}\boldsymbol{\cdot}\boldsymbol{\nabla}\right) \left[ \frac{3}{2} T+\frac{P_{t}}{n}+\frac{4}{3}\frac{E_{re,i}}{n}\right] +\boldsymbol{\nabla} \boldsymbol{\cdot}\frac{\mathbf{p}}{n}=0, \end{equation}
here, the Poynting vector  $p$ may be defined (Chandrashekhar Reference Chandrashekhar1984; Mihalas & Mihalas Reference Mihalas and Mihalas1984) in terms of heat flux through radiation heat conduction as
 \begin{equation} \boldsymbol{p}=-\frac{\lambda c}{3}\boldsymbol{\nabla}E_{r}=-K_{0} \boldsymbol{\nabla}T, \end{equation}
where  $\lambda$ represents the Rosseland radiation mean free path, which is proportional to some power of the temperature i.e.
 $\lambda =AT^{\beta }$,
 $\beta =1,2,3,\ldots$ and
 $K_{0}=5/2(\lambda c/3) \alpha _{r_{e,i} }T^{{3}/{2}}$ is the coefficient of thermal radiation conductivity. Let us now rewrite (2.31) as
 \begin{equation} \boldsymbol{\nabla}\boldsymbol{\cdot}\boldsymbol{p}=-\frac{5\alpha_{r_{e,i}}cA}{6}\frac{1}{\chi }\boldsymbol{\nabla}\boldsymbol{\cdot}\left(\boldsymbol{\nabla}T^{\chi}\right)=-\frac{5\alpha_{r_{e,i}}cA}{6} \left(2\boldsymbol{\nabla}T_{0} ^{\chi-1}\boldsymbol{\nabla}\delta T+\Delta T_{0}^{\chi-1}\delta T\right), \end{equation}
here,  $\chi =\beta +\frac {5}{2}$. In the equilibrium state, (2.30) reduces to
 \begin{equation} \boldsymbol{\nabla}\boldsymbol{\cdot}\frac{\boldsymbol{p}}{n}=-\frac{5\alpha_{r_{e,i}} cA}{6n}\frac{1}{\chi}\left[ \boldsymbol{\nabla}\boldsymbol{\cdot}\left(\boldsymbol{\nabla }T^{\chi}\right) \right] =0. \end{equation}
Integrating the above equation twice with the boundary condition  $T=0$ at
 $x=x_{s}$, we obtain
 \begin{equation} T_{0}=\varTheta_{0}|x_{s}-x|^{1/\chi}, \end{equation}
where  $x_{s}$ is the surface coordinate and
 $\varTheta _{0}$ is the constant temperature inside the plasma. It is quite clear from the above equation that temperature is not constant even at equilibrium and is found to be a function of the surface coordinate
 $x_{s}$; (2.34) also points out that the temperature vanishes at
 $x=x_{s}$, thus showing a sharp boundary of the plasma–vacuum interface. Let us now substitute (2.32) into (2.30), then, after applying Fourier transformation
 $\delta _{\varPhi ,\varPsi } \sim \exp [ \textrm {i}(k_{y}y+k_{z}z-\omega t) +kx]$, we get
 \begin{align} \delta T=\frac{\dfrac{\partial{\boldsymbol{\mathsf{F}}}}{\partial x}\dfrac{\partial}{\partial x}\left(\dfrac{3}{2}T_{0}+\dfrac{P_{t}}{n}+\dfrac{4}{3}\dfrac{E_{re,i}} {n}\right) }{\left(\dfrac{3}{2}+\dfrac{1}{n_{0}}\dfrac{\partial E_{re,i} }{\partial T}\right) \left[ \textrm{i}\omega+\dfrac{5\alpha_{r_{e,i}}cA}{6n_{0}\left(\dfrac{3}{2}+\dfrac{1}{n}\dfrac{\partial E_{r}}{\partial T}\right)}\left(2k\dfrac{\partial}{\partial x}T_{0}^{\chi-1}+\dfrac {\partial^{2}}{\partial x^{2}}T_{0}^{\chi-1}\right) \right]}.\end{align}
By substituting (2.35) into (2.29) we obtain the following dispersion equation of surface magneto-radiative, capillary, gravity waves on the plasma–vacuum interface
 \begin{align} &\omega^{2}-k^{2}V_{A}^{2}\cos^{2}\theta-g\frac{a^{2}k^{3}}{2}-k\left(G_{r}-iG_{r}\frac{\left(B/\omega\right) }{1+\left(B^{2}/\omega ^{2}\right) }\right)\nonumber\\ &\quad +k\left(kV_{E}^{2}+4{\rm \pi} G\sigma_{md}\right) =0, \end{align}
where  $V_{E}^{2}={E_{0s}^{2}}/{4{\rm \pi} \rho _{d}}$ represents the electric Alfvén velocity of dusty grains,
 $a^{2}=2a/\rho _{d}g$ is the capillary constant,
 \begin{gather} B=\frac{5\alpha_{r_{e,i}}cA}{6n\left(\dfrac{3}{2}+\dfrac{1}{n} \dfrac{\partial E_{r}}{\partial T}\right)}\left(2k\dfrac{\partial}{\partial x}T_{0}^{\chi-1}+\dfrac{\partial^{2}}{\partial x^{2}}T_{0}^{\chi-1}\right), \end{gather}
 \begin{gather}G_{r}=\frac{5\alpha_{r_{e,i}}T^{3/2}}{6\rho_{d}}\frac{\left(\dfrac{3} {2}+\dfrac{1}{n}\dfrac{\partial P_{t}}{\partial T_{0}}+\dfrac{4}{3n} \dfrac{\partial E_{re,i}}{\partial T_{0}}\right) \dfrac{\partial T_{0} }{\partial x}}{1+(B^{2}/\omega^{2}) }. \end{gather}
Let us now discuss dispersion equation (2.36) for some particular cases. (i) In the absence of radiation (2.36) takes the form,
 \begin{equation} \omega^{2}=k^{2}V_{A}^{2}\cos^{2}\theta+g\frac{a^{2}k^{3}}{2}-k\left(kV_{E}^{2}+4{\rm \pi} G\sigma_{md}\right) \end{equation}
to describe the dispersion relation of magnetocapillary gravity surface waves. If the inequality  $k(kV_{E}^{2}+4{\rm \pi} G\sigma _{md})\gg k^{2} V_{A}^{2}\cos ^{2}\theta +g({a^{2}k^{3}}/{2})$ holds, for some specific values of electron surface charge density through
 $V_{E}$ and dust mass density,
 $\sigma _{md}$, the above equation become unstable with a growth rate,
 $\gamma$
 \begin{equation} \gamma=\sqrt{k\left(kV_{E}^{2}+4{\rm \pi} G\sigma_{md}\right) -\left(k^{2}V_{A} ^{2}\cos^{2}\theta+g\frac{a^{2}k^{3}}{2}\right)}. \end{equation}
(ii) In the absence of a magnetic field, surface tension and the imaginary part of (2.36) we have,
 \begin{equation} \omega^{2}=k\left(G_{r}-(4{\rm \pi} G\sigma_{md}+kV_{E}^{2})\right), \end{equation}
if  $G_{r}\gg (4{\rm \pi} G\sigma _{md}+kV_{E}^{2})$, then on surface radiative–gravity waves will propagate such that the group velocity becomes a function of wavelength, i.e.
 $V_{g}=\sqrt {({g_{r}}/{8{\rm \pi} })\lambda }$, where
 $\lambda ={2{\rm \pi} .}/{k}$. Oppositely, if
 $G_{r}\ll (4{\rm \pi} G\sigma _{md} +kV_{E}^{2})$, the surface of an astrophysical object may undergo gravitational collapse due to the surface Jeans instability such that the instability criterion is a function of both the dust surface mass density,
 $\sigma _{md}$, and the electron surface charge density via
 $V_{E}$. In the absence of the surface charge (2.41) becomes,
 \begin{equation} \omega^{2}=k\left(G_{r}-4{\rm \pi} G\sigma_{md}\right), \end{equation}
depicting that, in this case, the instability criterion will be a function of the dust surface mass density only with a growth rate  $\dot {\gamma }$
 \begin{equation} \dot{\gamma}=\sqrt{k(4{\rm \pi} G\sigma_{md}-G_{r})}. \end{equation}
(iii) In the presence of surface charge, there exist values of the wave vector
 \begin{align} k_{\pm}=\frac{1}{ga^{2}}(V_{E}^{2}-V_{A}^{2}\cos^{2}\theta)\pm \frac{1}{ga^{2}}\sqrt{(V_{E}^{2}-V_{A}^{2}\cos^{2}\theta)^{2}-(ga^{2})^{2}\left(G_{r}-4{\rm \pi} G\sigma_{md}\right)} \end{align}
for which (2.36) reduces to
 \begin{equation} \omega^{3}+\textrm{i}kG_{r}|B|=0 \end{equation}
provided  $|B|^{2}\ll \omega ^{2}$. Among one of the two possible complex roots of the above equation, the positive root leads to the instability of surface waves due to electromagnetic (thermal) radiation in the plasma medium with a growth rate,
 $\ddot {\gamma }$
 \begin{equation} \ddot{\gamma}=\frac{\sqrt{3}}{2}\left(k_{\pm}G_{r}|B|\right)^{{1}/{3}},\end{equation}
clearly depicting that the growth rate of the radiative dissipative instability is a strong function of both the temperature inhomogeneity (due to radiation heat flux) as well as the thermal radiation pressure.
3. Parametric analysis and discussion
To show the impact of both dust surface mass,  $\sigma _{sd}$ and electron surface charge densities,
 $\sigma _{se}$
 $(V_{E}^{2}={E_{0x}^{2}}/{4{\rm \pi} \rho _{d}}={4{\rm \pi} \sigma _{se}^{2}}/{\rho _{d}}$) on the surface Jeans instability, we solve numerically (2.39), by choosing some typical parameters of an astrophysical environment (Tsintsadze et al. Reference Tsintsadze, Callebauti and Tsintsadze1996; Tsintsadze Reference Tsintsadze1998; Mamun & Shukla Reference Mamun and Shukla2010) as
 $n_{i}=1\times 10^{31}$ cm
 $^{-3}$,
 $n_{e}=1\times 10^{31}$ cm
 $^{-3}$,
 $n_{d}=10^{-4}n_{i}$ cm
 $^{-3}$,
 $T_{0}=1\times 10^{7}$ K,
 $m_{d}=10^{6}m_{i}$,
 $m_{i}=1.67\times 10^{-24}$,
 $H_{0}=1\times 10^{6}G$,
 $\theta ={\rm \pi} /8$,
 $E=0.3\times 10^{6}$ statvolt cm
 $^{-1}$. By substituting these parameters along with the surface coordinate as
 $x=2$ cm, one can easily calculate the dust surface mass density (in the absence of electron surface charge density)
 $\sigma _{sdm}=m_{d}n_{0d}x=3.34\times 10^{9}$ g cm
 $^{-2}$ and the consequent numerical value of the threshold wave vector of the surface Jeans instability turns out to be
 $k_{j}=64$ cm
 $^{-1}$, whereas the increase in mass of dust
 $m_{d}=1.3\times 10^{6}m_{i}$ leads to an increases in dust surface mass density
 $\sigma _{sdm}=4.342\times 10^{9}$ g cm
 $^{-2}$ with the threshold Jeans wave vector
 $k_{j}=110$ cm
 $^{-1}$. Similar results may also appear by varying the dust surface mass density through the density of dusty grains. Then, to show the combined effect of
 $\sigma _{sd}$ and
 $\sigma _{se}$ on the instability criterion of Jeans surface waves, we may fix the dust mass at
 $m_{d}=1\times 10^{6} m_{i}$ to find the total surface density (
 $\sigma _{sT}$),
 $\sigma _{sT}=\sigma _{sd}+\sigma _{se}=9.6\times 10^{21}$ g cm
 $^{-2}$ at
 $n_{e}=1\times 10^{31}$ cm
 $^{-3}$,
 $n_{d}=1.001\times 10^{27}$ cm
 $^{-3}$. Further,
 $\sigma _{sT}=9.60192\times 10^{21}$ g cm
 $^{-2}$ for
 $n_{e}=1.0002\times 10^{31}$ cm
 $^{-3}$ and
 $n_{d} =1.2012\times 10^{27}$ cm
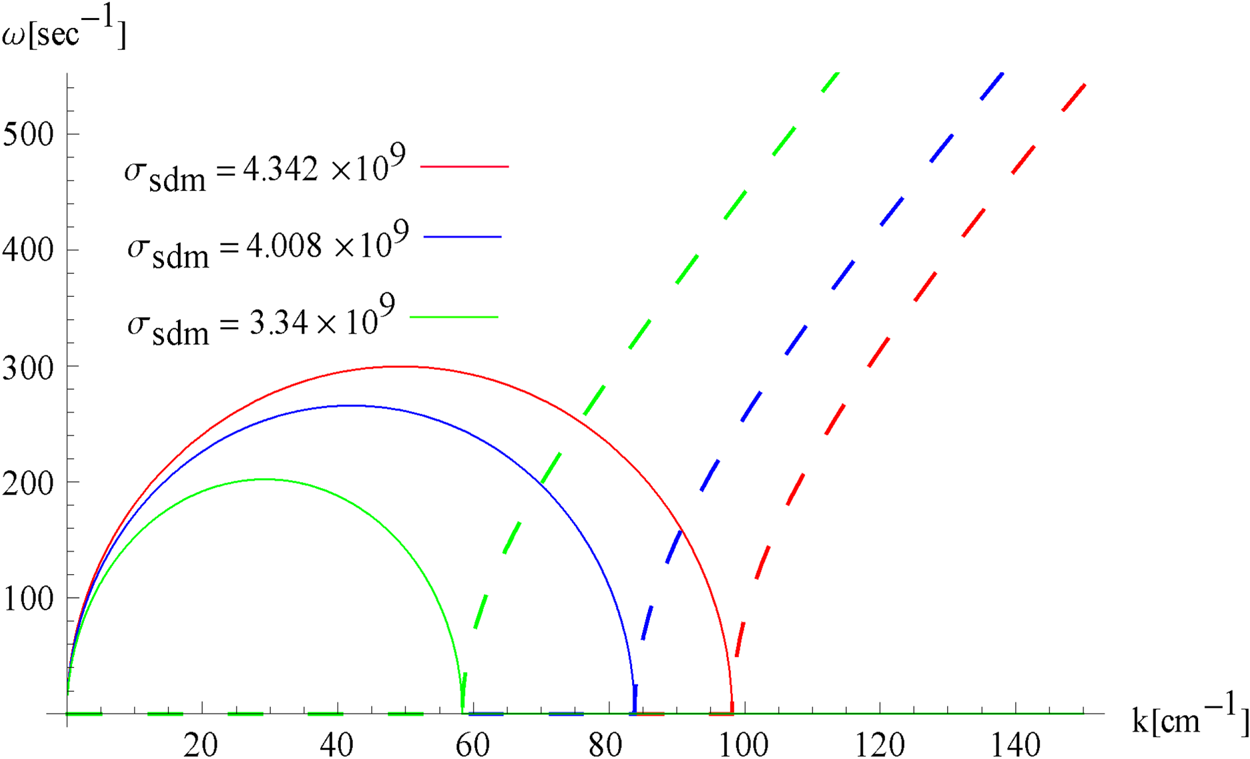
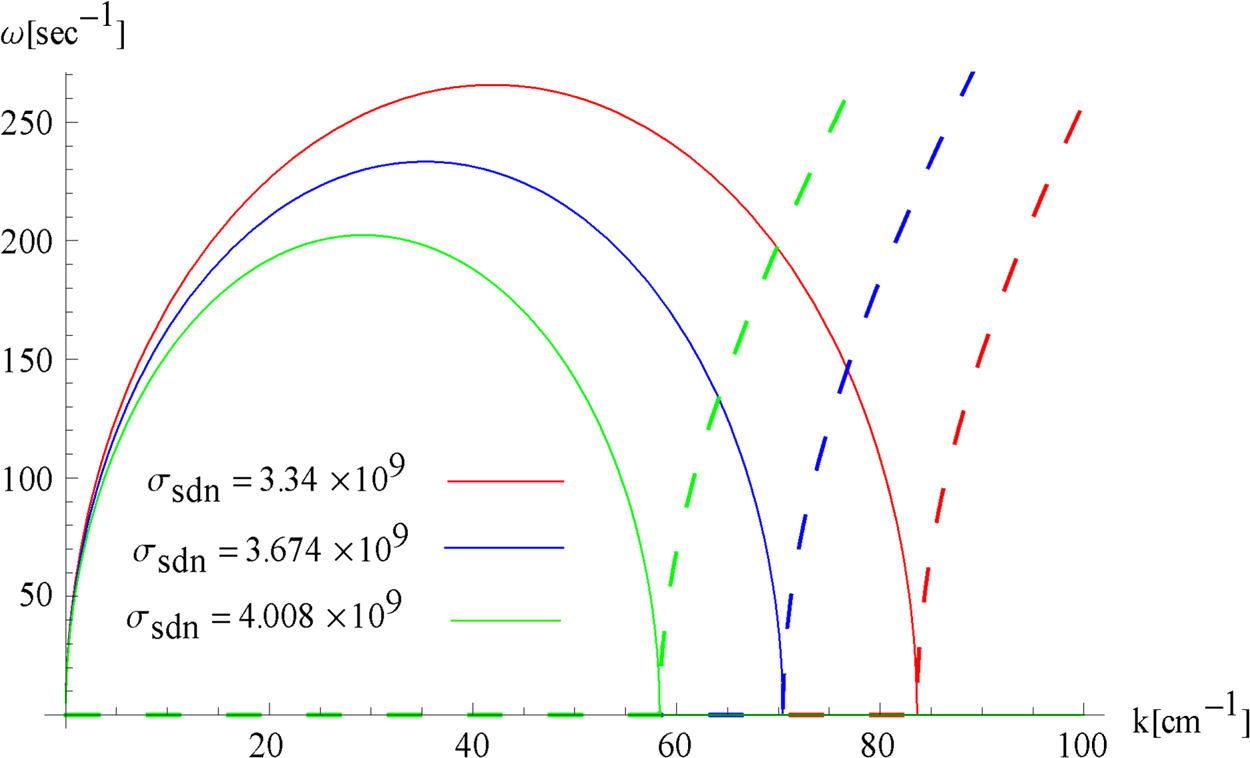
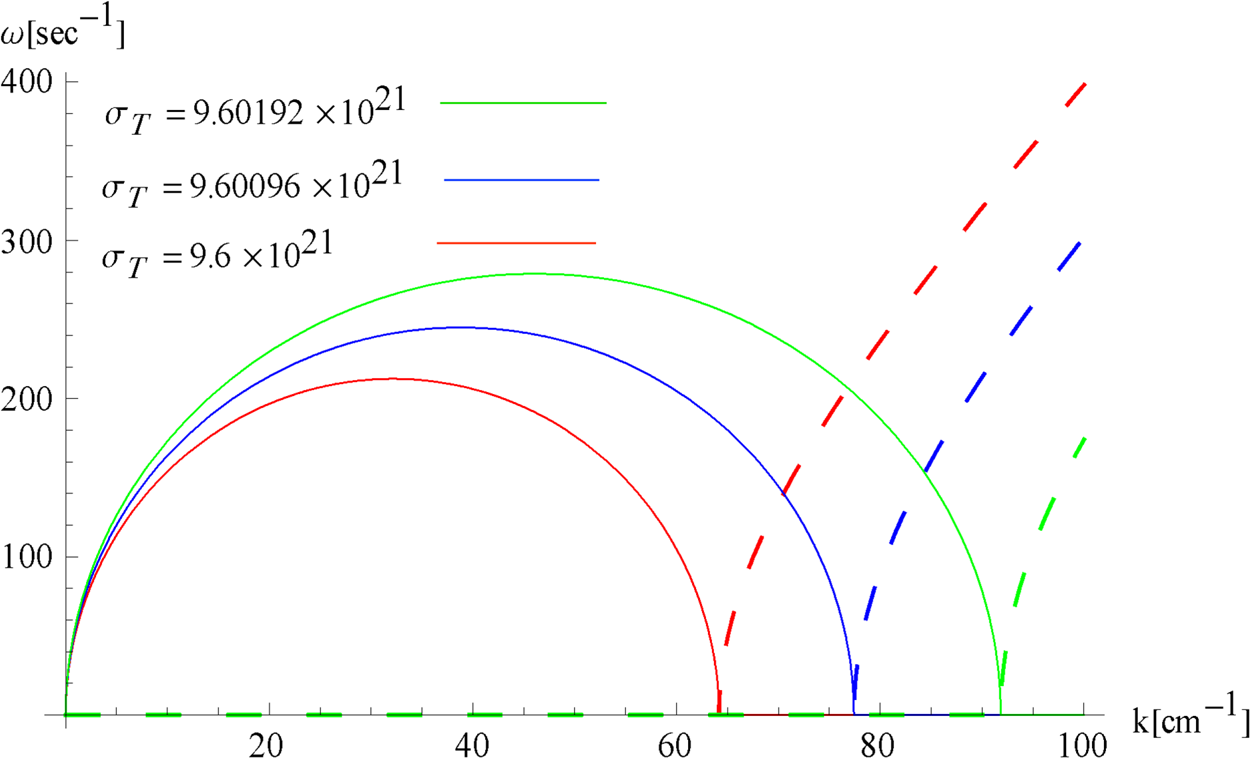
 $^{-3}$. This analysis clearly shows that electron surface charge density is coupled with the dust mass density to enhance the gravitational collapse of the surface of astrophysical objects as is shown in (2.39), while in the absence of surface charge, dust surface mass density alone is responsible for the gravitational collapse. The graphical representation of (2.39) is presented in figures 1–3. Figure 1 shows that in the absence of electron surface charge, dust surface mass density alone leads to surface Jeans instability via the mass of a dusty grain or the density concentration of dusty grains, as is shown in figure 2. Figure 3 depicts that, in the presence of surface charge, both
 $\sigma _{sd}$ and
 $\sigma _{se}$ are coupled together to enhance the surface oscillation amplitude of the surface Jeans instability.
Frequency  $(\omega )$ of magnetocapillary gravity surface waves (as shown in (2.39)) is plotted against the wavenumber
 $(k)$ for different values of dust surface mass density,
 $\sigma _{sdm}=4.342\times 10^{9}$ g cm
 $^{-2}$ (red curve),
 $\sigma _{sdm}=4.008\times 10^{9}$ g cm
 $^{-2}$ (blue curve) and
 $\sigma _{sdm}=3.34\times 10^{9}$ g cm
 $^{-2}$ (green curve). These values correspond to different masses of dusty grains;
 $m_{d}=1.3\times 10^{6}m_{i}$,
 $m_{d}=1.2\times 10^{6}m_{i}$ and
 $m_{d}=1\times 10^{6}m_{i}$, respectively, with other fixed parameters as
 $n_{e0}=10^{31}$ cm
 $^{-3}$,
 $n_{i0}=1\times 10^{31}$ cm
 $^{-3}$,
 $n_{d}=1\times 10^{-4}n_{i}$,
 $H_{0}=1\times 10^{6}$ G,
 $E=0.3\times 10^{6}$ statvolt cm
 $^{-1}$ and
 $T_{0}=10^{7}$ K. The solid curves are for
 $\textrm {Im}(\omega )$ and dashed curves are for
 $\textrm {Re}(\omega )$.

Frequency  $(\omega )$ of magnetocapillary gravity surface waves is plotted against the wavenumber
 $(k)$ for different values of dust surface number density,
 $\sigma _{sdn}=4.008\times 10^{9}$ g cm
 $^{-2}$ (green curve),
 $\sigma _{sdn}=3.674\times 10^{9}$ g cm
 $^{-2}$ (blue curve) and
 $\sigma _{sdn}=3.34\times 10^{9}$ g cm
 $^{-2}$ (red curve). These values correspond to the dust densities
 $n_{d}=1\times 10^{-4}n_{i}$,
 $n_{d}=1.1\times 10^{-4}n_{i}$ and
 $n_{d}=1.2\times 10^{-4}n_{i}$, respectively, with other parameters the same as in figure 1. The solid curves are for
 $\textrm {Im}(\omega )$ and dashed curves are for
 $\textrm {Re}(\omega )$.

Frequency  $(\omega )$ of magnetocapillary gravity surface waves [as shown in (2.39)] is shown as a function of wavenumber
 $(k)$ for different values of total surface density,
 $\sigma _{sT}=9.60192\times 10^{21}$ g cm
 $^{-2}$ (green curve),
 $\sigma _{sT}=9.60096\times 10^{21}$ g cm
 $^{-2}$ (blue curve) and
 $\sigma _{sT}=9.6\times 10^{21}$ g cm
 $^{-2}$ (red curve). The solid curves are for
 $\textrm {Im}(\omega )$ and dashed curves are for
 $\textrm {Re}(\omega )$.

To conclude, we have studied the stability criteria of charged SWs in a semi-bounded half-space incompressible, self-gravitating, radiative, magnetized dusty plasma. Following the RMHD model along with the full set of Maxwell equations, we have formulated that one fluid MHD approximation does not exist in the presence of large thermal effects, consequently, the electrons being the most favourable candidate to diffuse on the plasma–vacuum interface leads to the negative pressure gradient. We have depicted that in equilibrium state, the temperature of plasma species becomes a function of the surface coordinates and there may exist small temperature oscillations on the surface. We have formulated the general dispersion relation of charged radiative, magneto, gravity capillary waves propagating at the charged plane interface, which further is discussed for some particular cases. It is shown that electron surface charge density is coupled with the dust mass density to enhance the gravitational collapse of the surfaces of astrophysical objects such as stars, and galaxies via the Jeans surface instability, while in the absence of surface charge, dust surface mass density alone is responsible for the gravitational collapse of the surface of astrophysical objects. Further, it is also shown that the electromagnetic thermal radiation in the plasma medium may lead to the instability of SWs through the thermal radiation coefficients only.
Editor Ed Thomas thanks the referees for their advice in evaluating this article.