INTRODUCTION
In Brazil, recent studies indicate that the Guinea grass cv. Tanzania (P. maximum Jacq. cv. Tanzania), under rotational stocking, must be grazed when the sward reach 70 cm, which the height corresponding to the 95% light interception by this forage grass (Barbosa et al., Reference Barbosa, Domício, Vilela, Da Silva, Euclides, Sbrissia and Sousa2011, Euclides et al., Reference Euclides, Montagner, Difante, Barbosa and Fernandes2014). With this management, the pasture presents more accumulation of leaves and less accumulation of stems and dead tissues (Pereira et al., Reference Pereira, Paiva, Geremia and Da Silva2015).
However, in environments favourable to pasture growth, such as in fertilized or irrigated pastures, it is common that a higher number of pastures reach the ideal condition of pasture relatively to the necessary number (Volaire et al., Reference Volaire, Barkaoui and Norton2014). In this situation, the performance of grazing before the ideal goal of 95% light interception by the sward could generate flexibility of management.
In addition to the setting of the frequency, the intensity of defoliation must also be adjusted, ensuring a remaining leaf area that promotes fast and efficient regrowth, without compromising the organic reserves of the plant or the sward structure. In light of this, the study of the growth and development dynamics of plants which make up a pasture, by means of morphogenesis is relevant, for it allows the understanding of how the plant works and helps at the establishment of practices more suitable for the grazing management.
The objective of this study was therefore to determine the morphogenetic and structural characteristics of guineagrass pastures under rotational stocking strategies.
MATERIAL AND METHODS
Local characteristics, experimental design and treatments
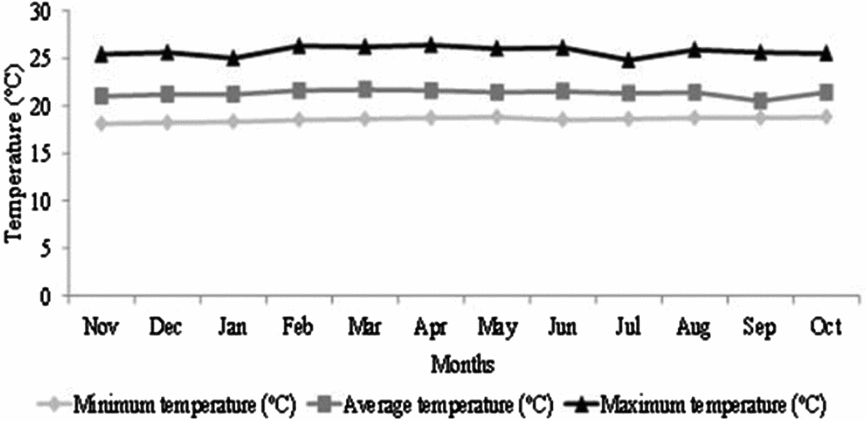
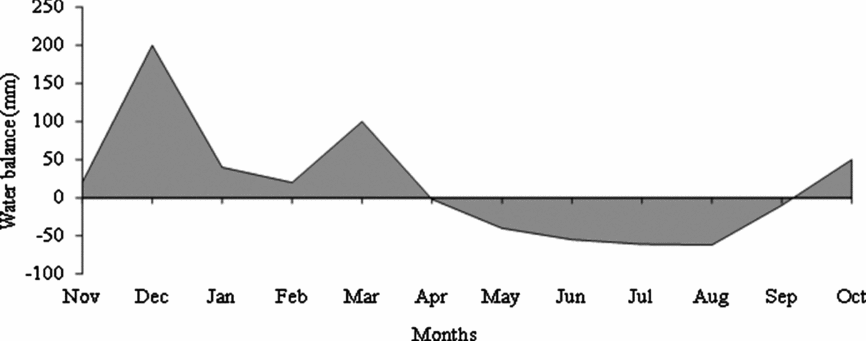
The research was conducted in an area belonging to the Department of Animal Science, Federal University of Viçosa, in Vicosa, MG, Brazil (20° 45′ S, 42° 51′ O and 651 m), with Guinea grass cv. Tanzania, in the period from November 2005 to October 2006 (data collection). According to the Köppen classification, the climate of the region is Cwa subtropical type, with well-defined dry (autumn/winter) and rainy seasons (in the spring/summer). The climatic information data were obtained from a meteorological station approximately 1000 m away from the experimental area (Figure 1). The monthly water balance was calculated by utilizing a water holding capacity of 50 mm (Figure 2).
Minimum, average and maximum air temperatures from November 2005 through October 2006.

Monthly water balance from November 2005 through October 2006.

The soil of the experimental area is classified as red-yellow Argisoil of loamy-clayey texture. Samples of ground at 0–20 cm depth were collected for analysis of chemical characteristics. Because of the elevated natural soil fertility, the high pH value (above 6.4) and the absence of exchangeable aluminium, there was no need to perform the correction and fertilization in the area for the establishment of the grass.
The establishment of the Guinea grass cv. Tanzania was performed in January, 2005 by means of sowing with 3 kg pure viable seeds per hectare. In March 2005, the area underwent lenient grazing aiming to stimulate plant tillering. After removal of the animals from the paddocks, fertilization with 60 kg ha−1 nitrogen as urea was carried out. From this date, weeds were manually controlled and the area was managed with continuous defoliation with crossbred cattle until the beginning of the spring. In the beginning of October, 2005, standardization cut of the pasture was done at 35 cm from the soil level, with backpack mower. After another plant growth cycle, evaluations started (11/07/2005); their end was on October 10, 2006.
Combinations of two frequencies (period of time needed for the canopy to reach 90 and 95% light interception during regrowth) and two post-grazing heights (30 and 50 cm) were evaluated according to a 2 × 2 factorial arrangement. Thus, treatments corresponded to four grazing management strategies: 90/30 (90% light interception and 30 cm post-grazing height), 90/50 (90% light interception and 50 cm post-grazing height), 95/30 (95% light interception and 30 cm post-grazing height) and 95/50 (95% light interception and 50 cm post-grazing height). Grazing management strategies were allocated to the experimental units (144 m² paddocks) in a completely randomized blocks design with three repetitions, totalling 12 experimental units, which received the following denomination (90/30, 90/50, 95/30 and 95/50).
Monitoring of the light interception, nitrogen and grazing
The monitoring of the light interception by the pastures was done with the aid of plant canopy analyser AccuPAR Linear PAR/LAI ceptometer. During regrowth, assessments occurred at every seven days, until values close to 90 and 95% were achieved. From this moment, the interval between the evaluations was reduced to two days, until the pre-grazing goals were reached. Readings were done at 16 sampling spots per paddock. At each spot, one reading was done above and another below the sward, taking the soil level as reference.
During the experiment, 150 kg ha−1 nitrogen was used as urea, divided in three doses of 50 kg ha−1 after the departure of the animals from the paddocks. Since the grazing intervals and the conditions of animal entry in the paddocks were variable, the application dates were also distinct, although being so that all the treatments could receive the same nitrogen amount by the end of the experimental period.
Grazing was done by crossbred cattle of approximately 460 kg body weight. High stocking rates were employed so that the grazing would not exceed the day-time at the obtainment of the specific residue height of each treatment. After grazing, animals remained in a reserve pasture and only returned to the experimental unit when they reached the pre-grazing goals established once more (90 or 95% light interception).
Evaluation of the morphogenetic and structural characteristics
The evaluation of the morphogenetic and structural characteristics was done in four tillers per experimental unit. After each grazing cycle, tillers were randomly tagged on representative spots of the average sward condition (visual evaluation of height and forage mass).
These tillers were assessed twice weekly by means of measurements of the leaf blades and stems (stem + leaf sheaths) length, leaf appearance, leaf expansion and senescence. These evaluations enabled the calculation of the leaf appearance rate (number of leaves appearing per tiller divided by the number of days of the evaluation period - leaf/tiller.day), the elongation rate (sum of all the leaf blades elongation per tiller divided by the number of days under valuation - cm/tiller.day) and the leaf senescence rate (sum of the senesced lengths of leaf blades present on the tiller divided by the number of days of the evaluation period - cm/tiller.day), the stem elongation rate (sum of all the elongation of stems (stems + leaf sheaths) per tiller divided by the number of days of the evaluation period - cm/tiller.day), the final leaf blade length (average length of the leaf blades of expanded leaves - cm/leaf), the number of live leaves per tiller (average number of expanding leaves and leaves expanded per tiller, not considering the leaves with more than 50% of this length senesced - leaves/tiller) and the leaf lifespan (period of time between the appearance of a leaf until its death, estimated by the multiplication of the number of live leaves per tiller by the inverse of the leaf appearance rate - days/leaf), according to (Lemaire and Chapman, Reference Lemaire, Chapman, Hodgson and Illius1996).
Statistical analysis
The experimental design was of completely randomized blocks with three replications, in a 2 × 2 factorial arrangement. Due to the variable nature of the grazing intervals of the treatments, the data were clustered by period of the year. For so, weighted means were calculated, considering the number and duration of the grazing cycles for each replicate, and the results were grouped in the following periods of the year: end of the spring (November and December, 2005), summer (January to March, 2006), fall (April to June, 2006), and winter/beginning of the spring (July to October, 2006). The data grouped so were submitted to variance analysis through the Generalized Linear Models (GLM) feature of the statistical package SAS (Statistical Analysis System, version 6.4). The comparison of means, when necessary, was performed by means of the Tukey test, adopting significance level of 5%.
RESULTS
Morphogenetic and structural characteristics
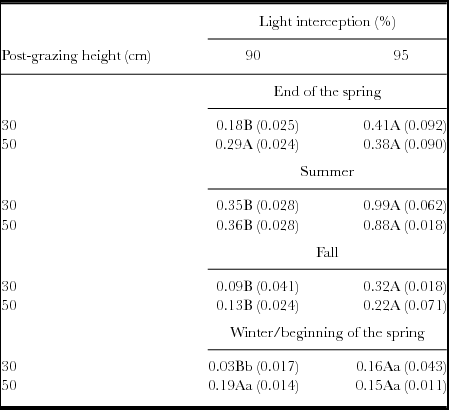
Leaf appearance rate was affected by the post-grazing height × light interception × time of the year interaction (p < 0.05). In the end of the spring, there was no difference on leaf appearance rate across the management strategies assessed. In the summer, grazing managed at 90% light interception and 50 cm post-grazing height presented higher values, compared with those managed at 90/30 and 95/50 light interception/post-grazing height, respectively. The differences disappeared in the fall and in the winter/beginning of the spring (Table 1).
Leaf appearance rate (leaf/tiller.day) in Guinea grass cv. Tanzania pastures under rotational stocking strategies.

Means followed by the same capital letter in the rows and small letter in the columns did not differ by the Tukey test (p > 0.05).
Numbers inside parentheses correspond to the standard error of the mean.
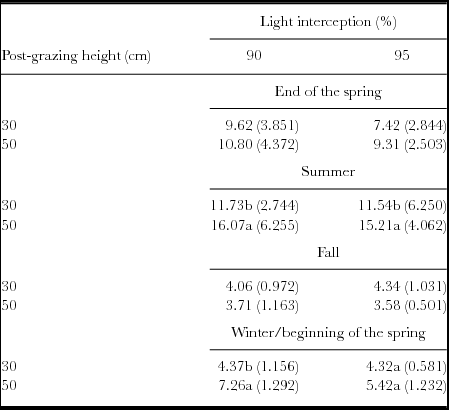
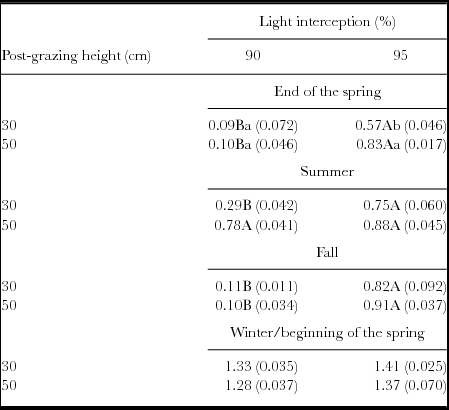
Leaf elongation rate was affected by the post-grazing height × light interception × time of the year interaction (p < 0.05). In the end of the spring, there was no difference on leaf appearance rate across the management strategies assessed.
In the summer, pastures managed with 90/50 and 95/50 presented higher values in relation to those managed at 90/30 and 95/30, respectively, with differences which disappeared in the fall. Pastures managed with 90/30 presented lower leaf elongation rate than pastures managed at 90/50, with no differences between pastures managed at 95/50 or 95/30 in the winter/beginning of the spring (Table 2).
Leaf elongation rate (cm/tiller.day) in Guinea grass cv. Tanzania pastures under rotational stocking strategies.

Means followed by the same letter in the columns did not differ by the Tukey test (p > 0.05).
Numbers inside parentheses correspond to the standard error of the mean.
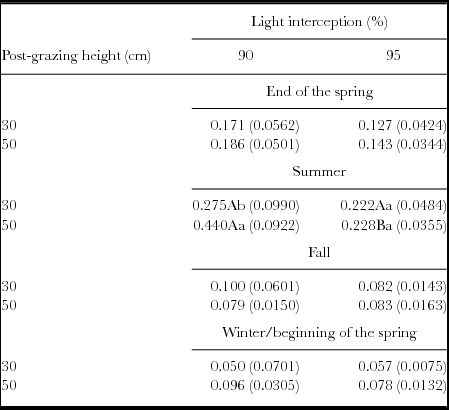
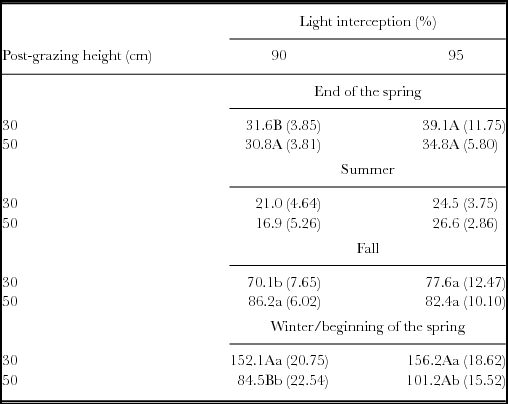
Stem elongation rate was affected by the post-grazing height × light interception × time of the year interaction (p < 0.05). In the end of the spring, pastures managed at 90/30 presented lower stem elongation rate than those managed at 95/30. There was no difference between 90/50 and 95/50 targets for stem elongation rate.
In the summer and fall, lower value was recorded on pastures managed at 90/30 and 90/50 in relation to those managed at 95/30 and 95/50, respectively. In the winter/beginning of the spring, pastures managed at 90/30 presented lower stem elongation rate in comparison with those managed at 90/50 and 95/30 (Table 3).
Stem elongation rate (cm/tiller.day) in Guinea grass cv. Tanzania pastures under rotational stocking strategies.

Means followed by the same capital letter in the rows and small letter in the columns did not differ by the Tukey test (p > 0.05).
Numbers inside parentheses correspond to the standard error of the mean.
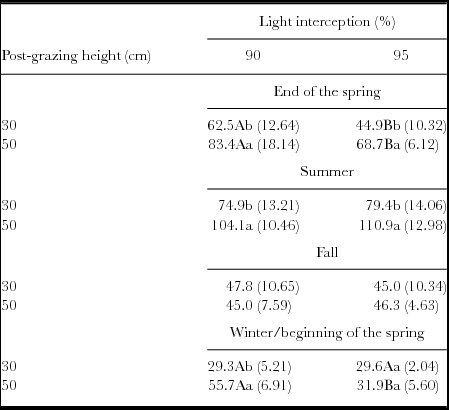
Leaf senescence rate was affected by the post-grazing height x light interception x time of the year interaction (p < 0.05). Higher leaf senescence rate was recorded in pastures managed at 95/50, in relation to grazing 90/50 and 95/30, and the managements of 95/30 showed higher leaf senescence rate that the grazing 90/30 in end of the spring.
In the summer, pastures managed at 90/30 presented lower value in comparison with those managed at 95/30. In the fall, lower leaf senescence rate was recorded in pastures managed at 90/30 and 90/50 in relation to those managed at 95/30 and 95/50, respectively; differences disappeared in the winter/beginning of the spring (Table 4).
Leaf senescence rate (cm/tiller.day) in Guinea grass cv. Tanzania pastures under rotational stocking strategies.

Means followed by the same capital letter in the rows and small letter in the columns did not differ by the Tukey test (p > 0.05).
Numbers inside parentheses correspond to the standard error of the mean.
Leaf lifespan was affected by the post-grazing height × light interception × time of the year interaction (p < 0.05). At the end of the spring, pastures managed with 90/30 presented shorter leaf lifespan when compared with those at 95/30. These differences did not occur in the summer.
In the fall, lower value was recorded in pastures managed at 90/30 in comparison with those managed at 90/50. Pastures managed at 90/30 and 95/50 presented longer leaf lifespan in relation to those managed at 90/50 and 95/50 in the winter/beginning of the spring (Table 5).
Leaf lifespan (days) in Guinea grass cv. Tanzania pastures under rotational stocking strategies.

Means followed by the same capital letter in the rows and small letter in the columns did not differ by the Tukey test (p > 0.05).
Numbers inside parentheses correspond to the standard error of the mean.
Leaf blade final length was affected by the post-grazing height × light interception × time of the year interaction (p < 0.05). At the end of the spring, greater leaf blade final length was recorded in pastures managed at 90/50, compared to 90/30 and 95/50 with managed. However, the managed 95/50 provided greater leaf blade final length compared to the grazing of 95/30.
In the summer, pastures managed at 90/50 presented higher value than those managed at 90/30; however, the handling of 95/50 showed higher leaf blade final length in relation to grazing to 95/30; these differences disappeared in the fall. In the winter/spring beginning, pastures managed at 90/50 presented greater leaf blade final length in relation to those managed at 90/30 and 95/50 (Table 6).
Leaf blade final length (cm) in Guinea grass cv. Tanzania pastures under rotational stocking strategies.

Means followed by the same capital letter in the rows and small letter in the columns did not differ by the Tukey test (p > 0.05).
Numbers inside parentheses correspond to the standard error of the mean.
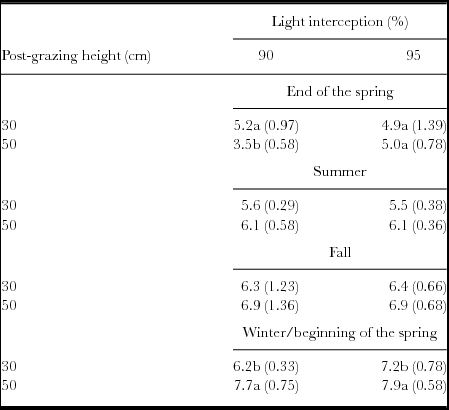
The number of live leaves per tiller was affected by the post-grazing height × light interception × time of the year interaction (p < 0.05). At the end of the spring, summer and fall there were no differences in the number of live leaves over the management strategies evaluated.
In the Winter/beginning of the spring, pastures managed at 90/50 presented higher number of live leaves per tiller than pastures managed at 90/30. Similar behaviour was observed for the managements 50/95 compared to 95/30, respectively (Table 7).
Number of live leaves (leaf/tiller) in Guinea grass cv. Tanzania pastures under rotational stocking strategies.

Means followed by the same letter in the columns did not differ by the Tukey test (p > 0.05).
Numbers inside parentheses correspond to the standard error of the mean.
DISCUSSION
The removal of the aerial part by cut or gazing represents stress to the plant, whose magnitude depends on the frequency and intensity of the defoliation, which, together, define the intensity at which the plant is defoliated (Lestienne et al., Reference Lestienne, Thornton and Gastal2006). This way, the plant responses to the defoliation disturbance must be understood as a mechanism of re-establishment and maintenance of the growth patterns, where all the factors available must be utilized for the formation of new photosynthetic tissues (Lemaire and Chapman, Reference Lemaire, Chapman, Hodgson and Illius1996).
In this scenario, it has been demonstrated that the leaf appearance rate increases with reduction in the sward leaf area index, in conjunction with the high levels of blue light (400 to 500 nm) and the higher red (600 to 700 nm):far-red (700 to 800 nm) ratio at this condition (Ferro et al., Reference Ferro, Zanine, Ferreira, Souza and Geron2015). So, it was expected that the greater defoliation frequencies and lower post-grazing heights would result in greater Guinea grass cv. Tanzania leaf appearance rate, which was not verified in the present study. It is likely that both the light interception levels evaluated (90 and 95%) ensured the adequate quantity and quality of light inside the sward, which would explain the absence of effects on the leaf appearance rate.
After grazing, the light interception of the sward on pastures managed with 30 cm residue was 40%, whereas for the pasture managed with 50 cm, it was 67% (Zanine et al., Reference Zanine, Nascimento, Santos, Pena, Da Silva and Sbrissia2011). This difference in the light interception values furthered regrowth in pastures under more lenient grazing (50 cm), which can be verified by the higher leaf elongation rate (Table 2).
Pastures managed at 50 cm post-grazing height also presented greater leaf blade final length in comparison with those managed at 30 cm, except in the winter, where there was no difference in the management strategies evaluated (Table 6). The leaf blade final length is determined by the ratio between leaf appearance and leaf elongation rates (Lemaire and Chapman, Reference Lemaire, Chapman, Hodgson and Illius1996). Since the leaf appearance rate was relatively constant over the management strategies assessed (Table 1), except in the summer, the greater leaf elongation rate in pastures managed with 50 cm post-grazing height (Table 2) certainly determined this greater leaf blade length.
Leaf blade final length is a plastic feature responding to the defoliation intensity; its greatest values are associated to greater post-grazing height, duet to the long leaf sheath length (Volaire et al., Reference Volaire, Barkaoui and Norton2014). This way, the distance to be crossed by the leaf blade inside the pseudostem is longer, which results in longer elongation time, and consequently, longer length of the new leaf, since there is no elevation in the apical meristem ((Duru and Ducrocq, Reference Duru and Ducrocq2000). The defoliation frequencies evaluated did not affect (p > 0.05) the Guinea grass cv. Tanzania leaf elongation rate (Table 2). This result indicates that, when necessary, the Guinea grass cv. Tanzania can be grazed at 90% light interception, with no damage to the leaf, when compared with the ideal pre-grazing condition (95% light interception). In this sense, when the environment is very favourable to pasture growth a condition which is common and in which it is usual that, simultaneously, a greater number of pastures reach the ideal grazing condition (95% light interception) relatively to the necessary number, the flexibility to perform the adequate pasture management can be achieved by the use of more frequent defoliation cycles (90% light interception) (Zanine et al., Reference Zanine, Nascimento, Bráulio, Silveira, Silva and Santos2013).
In the contrary, stem elongation rate (Table 3) and leaf senescence (Table 4) were more affected by the frequency than the height after grazing. Overall, pastures defoliated at 90% light interception presented lower stem elongation and leaf senescence rates, in comparison with those managed at 95% light interception. As the plant grows and recovers its leaf area, the intraspecific competition for light increases progressively (Da Silva and Nascimento Júnior, 2007), decreasing both the quantity and the quality of the light that penetrates the sward. As an adaptation response to the elevation in the light interception by the sward, the plant starts to invest in internodes elongation to allocate its leaves on the top of the sward, where the light is more plentiful. Simultaneously, the greater shading of the leaves located on the bottom of the sward, which accelerates leaf senescence (Duchini et al., Reference Duchini, Ribeiro and Sbrissia2013). Because of this, during the regrowth period, stem elongation and leaf senescence rates present the same response pattern. These results corroborate those described by Barbosa et al. (Reference Barbosa, Domício, Vilela, Da Silva, Euclides, Sbrissia and Sousa2011) for Guinea grass cv. Tanzania. It is worth emphasizing that this greater stem elongation and leaf senescence of the pasture at the 95% light interception does not affect the pasture structure negatively.
It could be observed that the mean leaf elongation rate value (8.05 cm/tiller.day) was about 25 times superior to the mean stem elongation rate (0.32 cm/tiller.day), which indicates great relative participation of the leaf blade and low contribution of the stem to the growth of the tiller of Guinea grass cv. Tanzania. This demonstrates a desirable characteristic on the pasture under the management strategies evaluated, for the leaf blade is the morphological component of the plant which has the best nutritive value (Santos et al., Reference Santos, Fonseca, Braz, Silva, Gomes and Silva2011) and is preferentially consumed by grazing cattle (Euclides et al., Reference Euclides, Montagner, Difante, Barbosa and Fernandes2014).
Overall, in the end of the spring and in the summer, leaf senescence rate was superior in the pastures managed with 50 cm post-grazing height, in comparison with those of 30 cm (Table 4). The post-grazing residue is composed, mostly, of older leaves, which, consequently, start the senescence process faster. This process is even more pronounced when the post-grazing height is greater: situation in which the shading of the leaves increases, especially for those of lower height of insertion on the tiller. This way, it is likely that the leaf blades of the pastures managed with more post-grazing residue reached the light compensation point quicker, during the rest period. And from this point, the respiratory rate is superior to the photosynthesis rate, which triggers the leaf senescence (Volaire et al., Reference Volaire, Barkaoui and Norton2014).
The number of live leaves per tiller was higher in pastures managed with post-grazing height of 50 cm, except in the end of the spring, where there was no difference between the management strategies evaluated (Table 7). Pastures lowered to the 50 cm height presented bigger amount of forage after grazing (Zanine et al., Reference Zanine, Nascimento, Santos, Pena, Da Silva and Sbrissia2011), which might have reduced the renewal of tissues in individual tillers. Since the renewal is smaller, the plant adjusts in a way that the leaves take longer to senesce, remaining alive in the tiller for a longer period.
The number of live leaves per tiller is determined by the phyllochron (inverse of the leaf appearance rate) and leaf life span ratio (Boval et al., Reference Boval, Fanchone, Archimède and Gib2007). Thus, there are alterations in the leaf appearance rate and in the leaf lifespan in response to the management strategy adopted (Tables 1 and 5, respectively), as a way to keep the number of live leaves relatively constant. Despite being determined genetically and assuming a relatively constant value, the number of live leaves per tiller varies in function of the environment conditions and pasture management (Duchini et al., Reference Duchini, Ribeiro and Sbrissia2013), which can explain the variations in the values of the present study.
Another possible explanation for the higher number of live leaves on Guinea grass cv. Tanzania pastures managed with 50 cm post-grazing height, in relation to those with 30 cm, can be related to the evaluation criterion utilized in this study, where a leaf was considered dead when more than 50% of its leaf blade tissue was senescent. Thus, longer leaf blades in pastures with 50 cm post-grazing height (Table 6), in spite of presenting a trend towards higher leaf senescence rate (Table 4), had greater quantity of tissues and, consequently, took longer to be considered dead, and therefore, showed higher number of live leaves (Table 7).
Overall, greater leaf appearance (Table 1) and elongation (Table 2) rates, greater stem elongation rate (Table 3) and greater leaf blade final length (Table 6) were recorded at the end of the spring and the summer, in relation to the winter/beginning of the spring, which demonstrates that the morphogenetic and structural characteristics of plants are strongly influenced by the environmental conditions (Lemaire and Chapman, Reference Lemaire, Chapman, Hodgson and Illius1996). Thus, reduction in the renewal flow of the tissue in the tiller is coherent with the occurrence of lower temperatures, reduced precipitation (Figures 1 and 2) and low luminosity (short days) in the winter/beginning of the spring. In response, in the winter/beginning of the spring, there was elevation in leaf lifespan (Table 5) and number of live leaves per tiller (Table 6), in spite of the greater leaf senescence rate (Table 4).
This pattern suggests morphological adaptation of the Guinea grass cv. Tanzania to keep its leaf area for longer, once longevous leaves contribute to the conservation of nutrients in the plant at times of limited nutrients availability (Duru and Ducrocq, Reference Duru and Ducrocq2000). A consequence of the greater conservation of nutrients in the plant during the winter was the low leaf and stem elongation rates verified in this season (Tables 2 and 3), which characterizes a period of minimum pasture growth.
The efficiency at the nutrients utilization, given by the longer leaf lifespan of the Guinea grass cv. Tanzania during the fall and winter/beginning of the spring (Table 5) is appropriate when the environment is characterized by lesser occurrence of defoliation, a fact that happened in these seasons of the years, where the Guinea grass cv. Tanzania pastures remained with no animals, due to the long rest periods (Zanine et al., Reference Zanine, Nascimento, Bráulio, Silveira, Silva and Santos2013).
As for leaf senescence rate, its highest value occurred in the winter and beginning of the spring (Table 4). It is possible that, with the increase in temperature, solar radiation and soil humidity at the beginning of the spring (Figures 1 and 2), leaves began senescence immediately, in order to supply nutrients and, consequently, help the expansion of new leaves, via greater translocations of nutrients from the senescing organs to those under development in the plant (Ferro et al., Reference Ferro, Zanine, Ferreira, Souza and Geron2015). In fact, there is possibility that 50% of the carbon and 80% of the nitrogen being recycled from the senescing leaves and being utilized by the plant for the synthesis of leaf tissues (Lemaire and Agnusdei, Reference Lemaire, Agnusdei, Lemaire, Hodgson and Moraes2000).
It is worth pointing out that the light interception levels assessed (90 and 95%) did not compromise the sward structure, for they provided stem elongation and leaf senescence rates in low magnitudes. Barbosa et al. (Reference Barbosa, Domício, Vilela, Da Silva, Euclides, Sbrissia and Sousa2011) also verified that pasture frequencies corresponding to the aims of 90 and 95% of light interception by the sward were efficient at the control of the stem elongation and leaf senescence, especially in the summer and fall, which guaranteed the maintenance of the sward, in comparison to the aim of 100% light interception.
The existence of interactions between the grazing management strategies and the seasons of the year on the morphogenetic and structural characteristics of the Guinea grass cv. Tanzania indicates the need to establish seasonal defoliation strategies for this forage grass.
CONCLUSIONS
Management strategies do not compromise the tissue flow in tillers and, consequently, can be utilized for the management of Guinea grass cv. Tanzania.
Acknowledgements
We thank National Council for Scientific and Technological Development and Foundation for Research Support of the State of Minas Gerais.