I. INTRODUCTION
Viscoelastic materials possess the unique ability to simultaneously store and dissipate kinetic energy, which makes them well suited to applications that require the attenuation of dynamic instabilities such as mechanical shock and vibration. The key metric used to describe a material's energy dissipation capability is the loss factor or tangent delta (tan δ); the larger tan δ the more energy dissipation capability the material possesses. Tan δ is frequently determined by experimental techniques such as dynamic mechanical analysis (DMA). In a DMA experiment, the instrument subjects the material to cyclic loading at a fixed frequency and amplitude and either simultaneously or posttest determines the phase angle, δ, between the load and displacement. The upper and lower limits of δ are 90 and 0°, which correspond to purely viscous and purely elastic materials, respectively. Phase angles between 90 and 0° classify the material as viscoelastic, meaning it exhibits both viscous and elastic deformation mechanisms such that upon removal of an applied load, the material returns a portion of the stored energy immediately and the remainder is dissipated in the form of heat.
When the volume of the material becomes too small to test using DMA, e.g., polymer thin films, individual phases, modified surfaces, or microstructural features to name a few, then the energy dissipation capability of the material is commonly measured using state-of-the-art dynamic nanoindentation methods such as the continuous stiffness measurement (CSM) technique.Reference Oliver and Pharr1,Reference White, Vanlandingham, Drzal, Chang and Chang2 The primary attraction of dynamic nanoindentation is its high resolution in load, displacement, and x–y positioning; typical values for commercially available instruments are approximately 10 nN, 0.1 nm, and <1 μm, respectively. Most test methods utilize a single phase-lock amplifier (PLA) to drive the actuator at a fixed frequency and amplitude while simultaneously measuring the corresponding phase angle between the controlled load and measured displacement signals; the larger the phase angle, the greater the damping and energy dissipation.
Although the results from this investigation are generally applicable to nearly all dynamic nanoindentation test methods, the study was specifically motivated by an interest in utilizing the CSM technique to advance our understanding of the correlation between the energy dissipation capability of bone and its fracture resistance; in particular, assessing changes in the phase angle of bone as a function of aging and disease.Reference Pathak, Swadener, Kalidindi, Courtland, Jepsen and Goldman3–Reference Isaksson, Nagao, MaŁkiewicz, Julkunen, Nowak and Jurvelin10 In examining the energy dissipation capability of bone, it is important to measure the phase angle as a function of numerous variables such as hydration, gender, disease, aging, and microstructural length scale with sufficient accuracy and precision to discern between 10% changes in the phase angle.Reference Pathak, Swadener, Kalidindi, Courtland, Jepsen and Goldman3 Over the frequency range from 1 to 50 Hz, the phase angle of bone at 22 °C varies approximately from 1 to 5°, and thus, quantifying small but possibly critical changes in the phase angle will require determining δ to within approximately 0.1°.Reference Pathak, Swadener, Kalidindi, Courtland, Jepsen and Goldman3 Dynamic nanoindentation experiments performed with flat punch indenter geometries have been refined and successfully used to characterize the energy dissipation capability of bulk high damping materials with this level of precision.Reference Sakai11−Reference Herbert, Oliver, Lumsdaine and Pharr13 Implementing geometrically self-similar indenter geometries such as the Berkovich and applying the technique to small volumes of low damping materials (tan δ ≤ 0.1 or δ ≤ 5°) such as bone, on the other hand, has not been as rigorously examined. In this paper, we will utilize four reference materials, two of which are similar to the bone in their damping capability, to document two significant problems that prevent the standard CSM technique from providing the level of accuracy and precision required to reliably measure the phase angle of bone and other low damping materials. Common to all dynamic nanoindentation techniques, the test method must possess the ability to accurately account for the cumulative phase shifts created by the instrument's actuator, load frame, and the electronics that process the load and displacement signals. In addition, the test method must have the ability to achieve steady state harmonic motion over the time scale in which the phase angle measurement is made. Reliable measurements of the phase angle can only be made when these conditions are satisfied. At 22 °C and 45 Hz, which is a common operating frequency for the CSM technique, we will show that these conditions are not met, and as a result, the phase angle of polycarbonate (δ = 0.3°) and polymethyl methacrylate (δ = 3.4°) are overestimated by approximately 1900% and 135%, respectively. In this investigation, we will provide experimental evidence to document these errors, propose robust solutions that will further enable the capabilities of dynamic nanoindentation, and offer experimental verification to demonstrate the validity of our proposed solutions.
Accordingly, the goal of this work is to develop, implement, and experimentally validate a modified form of the CSM technique that is optimized to measure and quantify the viscoelastic energy dissipation capability of small volumes of material using nanoindentation with geometrically self similar indenters like the Berkovich. Determining the phase angle with improved accuracy and precision is the most important objective of this work, as these enhancements will further enable our ability to discern between small changes in energy dissipation as a function of numerous variables such as microstructural length scale and/or changes brought about by processing and environmental degradation, or in the case of bone, tissue type, hydration, age, gender, and disease. Two significant changes to the CSM technique are required to achieve these goals: (i) the utilization of fused silica and sapphire, which are assumed to exhibit no measurable damping, to establish a new correction to the reference phase calibration, and (ii) the implementation of a loading history that is better suited to evaluating and achieving the steady state harmonic motion needed for accurate dynamic property measurements. Verification of the proposed test method is performed at 22 °C in PC and PMMA over the frequency range of 4–48 Hz, for which damping data are independently available.
II. EXPERIMENTAL METHODS
The dynamic nanoindentation experiments were performed using a NanoIndenter XP (Agilent Technologies, Chandler, AZ) configured with the CSM option and a sharp Berkovich diamond indenter. By virtue of their mass, stiffness, and damping, over critically damped actuators like the XP are not as well suited to measuring small changes in energy dissipation as their underdamped counterparts. Nevertheless, instruments like the XP are frequently used to measure energy dissipation and, thus, the aim of this work is to help identify how to work within their inherent dynamic limitations to make meaningful phase angle measurements. The test materials utilized in this investigation were bulk specimens of fused silica, single crystal aluminum oxide (sapphire, c-axis [0001] oriented parallel to the indentation axis), polycarbonate (PC), and polymethyl methacrylate (PMMA). Fused silica and sapphire were purposely selected because at room temperature, both are simple linear elastic solids with a phase angle very close to zero. Thus, both materials are well suited to validate the measured phase angle as a function of frequency and, if deemed necessary, to be used in creating a new calibration to the reference waveform of the phase lock amplifier. The silica specimen (20 × 20 × 7 mm) is a standard reference block provided by Agilent Technologies. The sapphire specimen is an optical grade window (15-mm diameter, 7-mm thick) obtained from GT Crystal Systems (Salem, MA). PC and PMMA were purposely chosen because at room temperature, they possess damping capability that is similar to bone. At 45 Hz and ∼22 °C, the nominal phase angles of PC and PMMA have been measured to be approximately 0.3 and 3.4°, respectively.Reference Capodagli and Lakes14−Reference Kolman, Ard and Beatty17 The PC and PMMA (cut to size: 20 × 20 mm from a 7-mm thick sheet) were obtained from the Goodfellow Corporation (Coraopolis, PA). None of the specimen surfaces received any preparation or polishing before testing. The silica and sapphire were cleaned using Kimwipes (Fisher Scientific, Pittsburgh, PA) and high purity ethanol. To maximize the stiffness of the sample mounting, all four specimens were bonded to the aluminum sample mounts using a thin layer of adhesive. The silica and sapphire were attached using a thermal set wax, Crystal Bond (Ted Pella, Inc., Redding, CA), and PC and PMMA were attached using a 2-part epoxy resin (Ace Hardware, Knoxville, TN). Excess adhesive and air pockets were removed by firmly pressing the specimens onto the sample mounts and repeatedly twisting the specimens. Fifteen indentation experiments were performed on each specimen in 5 × 3 arrays with a lateral spacing in the x and y directions of 30 times the maximum indentation depth. Throughout these experiments, the laboratory temperature was controlled to 22 ± 0.1 °C.
A. The CSM technique
The CSM technique is a dynamic nanoindentation test method that is frequently used to characterize the mechanical properties of viscoelastic solids.Reference Oliver and Pharr1,Reference White, Vanlandingham, Drzal, Chang and Chang2,Reference Herbert, Oliver, Lumsdaine and Pharr13 To assess the test method's ability to accurately and precisely estimate the phase angle of low damping materials, CSM experiments were performed in silica, sapphire, PC, and PMMA. Basic principles of the CSM technique are well-documented elsewhere and will not be revisited here.Reference Oliver and Pharr1 For each of the four specimens, the experiments were conducted with a fixed drive frequency of 45 Hz, a fixed oscillation amplitude of 2 nm (rms), and a controlled load-time history such that the loading rate divided by the applied load  $({\raise0.7ex\hbox{${\dot p}$} \!\mathord{\left/ {\vphantom {{\dot p} p}}\right.\kern-\nulldelimiterspace}\!\lower0.7ex\hbox{$p$}})$ was held constant at 0.05 s−1. During the constant
 $({\raise0.7ex\hbox{${\dot p}$} \!\mathord{\left/ {\vphantom {{\dot p} p}}\right.\kern-\nulldelimiterspace}\!\lower0.7ex\hbox{$p$}})$ loading, the phase angle between the controlled load and measured displacement was directly measured by the PLA.
It is important to understand that the CSM technique as implemented on the Nanoindenter XP has three built-in features that are used to account for the instrument's collective contributions to the measured phase angle. The first is a frequency-dependent reference phase angle that is used to configure the PLA in a manner that compensates for phase changes induced by the instrument's electronics that process the load signal. The second is the ability to account for the frequency dependent stiffness and damping of the instrument's actuator. The third is the ability to account for the finite stiffness of the instrument's load frame. The significance of these built-in features will become apparent in subsequent sections. Although the ability to continuously measure the phase angle during the  $({\raise0.7ex\hbox{${\dot p}$} \!\mathord{\left/ {\vphantom {{\dot p} p}}\right.\kern-\nulldelimiterspace}\!\lower0.7ex\hbox{$p$}})$ loading segment is a key benefit of the CSM method, we will show that for viscoelastic solids, the PLA may not generate reliable measurements of the phase angle because steady-state harmonic motion, which is a required condition for dynamic property measurement, may not be achievable while the contact area changes during the experiment.
B. A modified CSM technique: enabling steady-state harmonic motion
Rather than relying on phase angle measurements made during the  $({\raise0.7ex\hbox{${\dot p}$} \!\mathord{\left/ {\vphantom {{\dot p} p}}\right.\kern-\nulldelimiterspace}\!\lower0.7ex\hbox{$p$}})$ loading segment, during which the contact area changes, we propose that more reliable phase angle measurements can be made during a subsequent hold period where the applied load is held constant and changes in the contact area are possible only by time dependent deformation, e.g., creep. Accurate measurements of the phase angle require steady-state harmonic motion, which can be achieved in one of two ways: (i) waiting for the time-dependent mechanisms to effectively exhaust themselves or (ii) operating the PLA at sufficiently high frequencies and utilizing fast measurement time constants in the PLA such that the change in contact area is insignificant relative to the time scale over which the phase angle is measured. Either way, the critical objective is to minimize complex interactions between the transient response in the specimen in the time domain, e.g., creep, and the measured response in the frequency domain. We collectively refer to this as frequency separation and note that it is critical in performing accurate measurements of the phase angle since it is the only means by which the required condition of steady-state harmonic motion can be achieved. To that end, we have implemented a modified form of the CSM technique that is better suited to achieving frequency separation and also provides a simple means to experimentally assess the level of frequency separation that has been attained.
In the modified CSM method, the normal loading (via the  $({\raise0.7ex\hbox{${\dot p}$} \!\mathord{\left/ {\vphantom {{\dot p} p}}\right.\kern-\nulldelimiterspace}\!\lower0.7ex\hbox{$p$}})$ algorithm) is terminated at a user-defined load limit that is held constant until the subsequent frequency measurements are completed. During the constant load and hold, the phase angle of each specimen is measured at 12 frequencies over the range of 4–48 Hz, all of which are well within the range over which the actuator behaves as a simple harmonic oscillator.Reference Herbert, Oliver, Lumsdaine and Pharr13,Reference Herbert, Oliver and Pharr18 Note that sweeping the frequency from 4 to 48 Hz does not facilitate the measurement in any way; rather, it merely provides the opportunity to investigate the phase angle as a function of frequency. Throughout the frequency sweep measurements performed here, the time constant in the PLA was fixed at 0.5 s, the time constant on the displacement signal was fixed at 0.1 s, and the averaging time at each frequency was fixed at 30 s. Accordingly, no attempt was made to achieve frequency separation through the configuration of the PLA, rather the modified method relies on simply waiting for the time-dependent mechanisms of creep that change the contact area to effectively exhaust themselves. However, in lieu of implementing a displacement rate stability criterion after reaching the prescribed load limit, the specimen was purposely given a relatively short stabilization time of 30 s so that the effect of not achieving frequency separation could be experimentally observed. As the frequency was swept from 4 to 48 Hz, the specimen was allowed to stabilize for approximately 100 s after each frequency change. Following the 100 s stabilization period, the phase angle was measured at a fixed harmonic load and averaged over a 30 s interval to maximize the precision of the measurement. For PC and PMMA, the frequency sweep was repeated 3 times at each test site. Reproducibility of the phase angle from one sweep to the next was taken to be a direct measure of whether or not sufficient frequency separation has been achieved. Because the phase angle in PC and PMMA is relatively small over the range of 4–48 Hz (δ ≤ 4°), we assume that when the contact area is effectively constant, the 100 s interval between each frequency change provides sufficient time to allow the deformation mechanisms to reach steady state, regardless of the drive frequency. Also, unlike the built-in feature of the CSM technique, which relies on a calibration file to determine the frequency specific stiffness and damping of the actuator, the modified method directly measures the stiffness and damping as a function of frequency with the displacement sensor located within 1 μm of the same physical position at which the specimen was characterized.Reference Herbert, Oliver, Lumsdaine and Pharr13,Reference Herbert, Oliver and Pharr18 This direct measurement, which is performed with the indenter column hanging in free space, provides a more accurate assessment of the actuator's stiffness and damping because it takes into account the dependence on the displacement sensor position as well as the test temperature and humidity level. Over its full range of travel, which is approximately 2 mm, the stiffness and damping of the actuator are physically dependent on the drive frequency, anomalies in the leaf springs that support the indenter shaft, and the location of the electromagnetic coil that applies the force. These factors are critical when the actuator rather than the specimen dominates the measured phase angle.
C. Magnitude of the displacement oscillation
The ideal experiment would be to perturb the system as little as possible to ensure that throughout each oscillation cycle, changes in the projected contact area are insignificant, thus suggesting that the displacement amplitude should be kept as small as possible. On the other hand, large displacement amplitudes are attractive because they improve the signal-to-noise ratio and decrease the scatter in the measured phase angle. However, as previously reported, large displacement amplitudes in linear elastic solids can cause the measured stiffness to be significantly underestimated.Reference Pharr, Strader and Oliver19 While correction methods have been developed to resolve this error, they are not directly applicable to viscoelastic deformation.
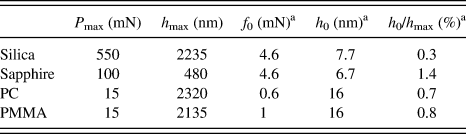
For this reason, the ratio of harmonic displacement to the maximum indentation depth, h 0/h max, (based on the rms amplitude) was limited to 1.4% or less in all of the performed experiments.
III. RESULTS AND DISCUSSION
For each specimen, Table I summarizes the approximate values of the maximum load, P max, the maximum indentation depth, h max, the harmonic load oscillation amplitude, f 0, the harmonic displacement oscillation amplitude, h 0, and h 0/h max. No cracking was observed in any of the residual hardness impressions. To be consistent with the output from the instrument's software, the magnitudes of h 0 and f 0 are expressed as rms values. It is important to recognize that the peak-to-valley amplitudes are actually larger by a factor of  $2\sqrt 2 $. Data presented in the following plots represent the average of all 15 experiments performed on each sample. No data were discarded before averaging. The scatter bars span one standard deviation about the mean.
Selected experimental variables.

a The magnitudes of f 0 and h 0 are rms values.
A. The CSM technique: Evaluating the accuracy and precision in the measured phase angle of silica, sapphire, PC, and PMMA
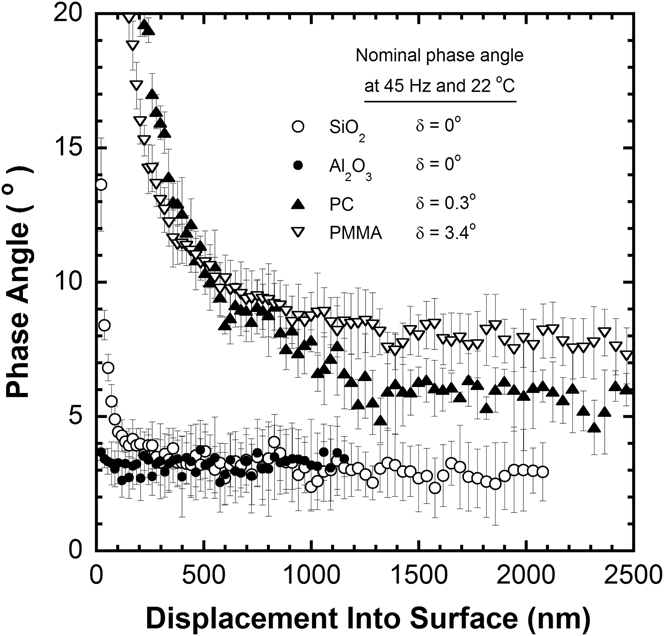
At room temperature, both fused silica and sapphire are simple linear elastic solids with a phase angle very close to zero. PC and PMMA, on the other hand, are viscoelastic solids at room temperature, and at 45 Hz, their nominal phase angles have been measured to be approximately 0.3 and 3.4°, respectively.Reference Capodagli and Lakes14−Reference Kolman, Ard and Beatty17 As measured by the standard CSM technique, Fig. 1 shows the phase angle as a continuous function of indentation depth for all four materials. Using the previously described built-in features of the CSM method, contributions to the measured phase angle from the stiffness and damping of the actuator, the stiffness of the load frame, and the electronics that process the load signal have been removed. For silica and sapphire, the phase angle, which is relatively constant at all but the smallest depths, is approximately 3° and, thus, much greater than expected. The PC and PMMA specimens exhibit a strong skin effect that results from processing and persists to a depth of approximately 1500 nm. Beyond this depth, the phase angles determined by the CSM method for PC and PMMA are approximately 6 and 8°, respectively, both of which are also much greater than expected. We propose that the errors observed in all four materials are caused by two problems: (i) an additional phase shift (beyond the normal corrections) induced by either the electronics that process the displacement signal or physical damping in the load frame and (ii) the inability to achieve steady-state harmonic motion over the time scale in which the phase angle measurement was made. Additionally, we note that the precision of the measured phase angle is approximately ±1°, which is 10 times larger than our previously stated objective.
Phase angle as a function of displacement, measured at 45 Hz using the CSM technique and a Berkovich indenter.

Among the factors that affect the accuracy of the measured phase angle in a CSM experiment is the built-in frequency-dependent digital phase shift, called the reference phase angle, which is used to configure the reference waveform of the PLA. The reference phase angle has traditionally been used to compensate only for frequency-dependent phase changes that are created by the electronics that carry the command signal for the harmonic load. Since its introduction in 1992, implementation of the CSM technique has implicitly assumed that physical damping in the load frame and the electronics used to carry the displacement signal make no significant contribution to the measured phase angle. Over the past 20 years, this assumption has justifiably been ignored because the CSM method has primarily been used to determine the elastic contact stiffness in experiments performed on specimens that behave as linear elastic solids. For these materials, the elastic contact stiffness is insensitive to errors in the reference phase because the phase angle of the specimen is near zero, and the elastic contact stiffness is directly proportional to the cosine of the phase angle, e.g., cos5° = 0.996. Energy dissipation or damping, on the other hand, is directly related to the phase angle, and therefore, any violation of the assumptions associated with the reference phase will naturally result in an error in the measured phase angle. Although the error in the reference phase is presumably small and of little consequence in high damping materials, it becomes increasingly important as the phase angle of the specimen approaches zero. Based on the severely overestimated phase angles obtained in silica, sapphire, PC, and PMMA, which are shown in Fig. 1, we submit that the assumptions associated with the reference phase angle are not valid, and are, therefore, a significant source of the observed error. Regardless of whether the additional phase shift is caused by physical damping in the instrument's load frame or a shift in the displacement electronics, we expect that the error manifests itself as a frequency-dependent increase in the measured phase angle, which is consistent with the 3° error observed in both silica and sapphire.
At depths beyond 1500 nm in PC and PMMA, a fixed 3° correction only reduces the error from 1900% to 900% in PC and from 135% to 47% in PMMA. Thus, there is an additional error in PC and PMMA that results from the complex interactions between the specimen's viscoelastic behavior in the time and frequency domains, i.e., poor frequency separation and the lack of steady state harmonic behavior. Because reliable phase angle measurements require steady-state harmonic motion, the load-time history is constrained in two important ways: (i) the contact area must be nearly constant over the duration of the measurement, i.e., during each oscillation cycle, changes in the projected contact area must be insignificant and (ii) at any given frequency, sufficient time must be given to allow all of the specimen's various deformation mechanisms to reach steady state. During a standard CSM experiment utilizing constant  $({\raise0.7ex\hbox{${\dot p}$} \!\mathord{\left/ {\vphantom {{\dot p} p}}\right.\kern-\nulldelimiterspace}\!\lower0.7ex\hbox{$p$}})$ loading conditions, the normal load and the projected contact area increase continually with time, making it difficult to achieve either condition. Despite this, we recognize that through the implementation of high frequencies and fast time constants relative to the time rate of change of the contact area, the PLA can be configured to generate reliable phase angle measurements. However, rather than attempting to identify the test conditions under which reliable phase angle measurements may or may not be obtained during continuous loading, we have chosen to implement the previously described constant load and hold method. Although the modified method sacrifices the ability to measure the phase angle continuously with depth, it optimizes the ability to work within the constraints needed to assure nearly constant contact areas and steady-state harmonic conditions.
B. Using the modified CSM technique to establish a new calibration to the reference phase angle
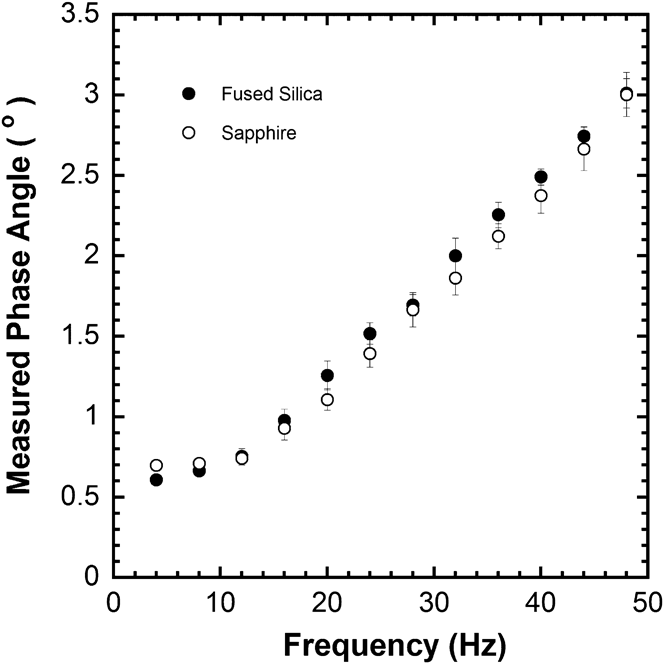
Figure 2 shows the measured phase angle of fused silica and sapphire as a function of frequency as measured by the modified CSM technique. The damping capability of silica and sapphire at 22 °C is presumably well below the measurement resolution of the test method; thus, the phase angle is taken to be zero for both specimens. With exception to the data at 4 Hz, the measured phase angles in silica and sapphire are nominally the same to within one standard deviation about the mean, which is consistent with our assumptions. The key element of the data, however, is the increasingly large frequency-dependent discrepancy between the measured and nominally expected phase angle of zero.
The effect of frequency-dependent contributions from the instrument's electronics or physical damping on its load frame to the measured phase angle of fused silica and sapphire, which are simple linear elastic solids.
Throughout these measurements, the PLA was configured with the standard reference phase angles, which only compensate for the electronically induced phase shift in the load signal. The data were purposely not corrected to account for the frequency-dependent stiffness and damping of the instrument's actuator or the finite stiffness of the instrument's load frame because, as we will show, neither of these factors make a significant contribution to the measured phase angles. By virtue of the thin layer of adhesive (elastic modulus of ∼3 GPa) and the large contact area, it is also unlikely that the specimen mounting makes any significant contribution to the measured phase angles. We propose, therefore, that the higher than expected values are the result of an additional phase shift from the instrument's electronics or possibly physical damping in the load frame.
Theoretically, the instrument's contribution to the measured phase angle can never be reduced to zero, although the specimen can effectively dominate the measured phase angle under certain conditions. Universal criteria that identify these conditions are difficult to define because they depend on a number of factors such as the phase angle of the specimen, the dimensions of the contact, the mass, stiffness and damping of the test instrument itself, the resolution of the measured phase angle, and the magnitude of the instrument's frame stiffness. With these limitations in mind, we propose as a general guide that the instrument's contribution to the measured phase angle can safely be ignored only when both of the following experimentally measured criteria are met:
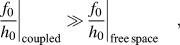 $${\left. {{{{f_0}} \over {{h_0}}}} \right|_{\rm{coupled}}} \gg {\left. {{{{f_0}} \over {{h_0}}}} \right|_{{\rm{free\,space}}}}\quad ,$$
 $${K_{{\rm{lf}}}} \gg {K_{{\rm{contact}}}}\quad ,$$
where K lf is a constant representing the stiffness of the load frame, K contact, which will be defined in terms of experimental parameters shortly, is the contact stiffness, and in the parlance of electrical engineering,  $\left. {f_0 /h_0 } \right|_{{\rm{coupled}}} $ is the combined or coupled apparent power of the actuator and specimen, measured with the actuator and specimen in contact, and
 $\left. {f_0 /h_0 } \right|_{{\rm{freespace}}} $ is the apparent power of the actuator itself, measured with the actuator hanging in free space to accurately determine the properties of the actuator at the same physical position, as well as the temperature, and humidity level at which the measurement was performed on the specimen. To minimize the instrument's contribution to the measured phase angle, the magnitude of these inequalities must increase as the resolution of the measured phase angle increases and/or the magnitude of the specimen's phase angle approaches zero. For these reasons, we do not offer absolute values for these inequalities but provide the relative magnitudes achieved in this investigation, which are shown in Table II.
Summary of comparative metrics.

Evaluating the comparative metrics established by Eqs. (1) and (2) shows that at 4 and 48 Hz in fused silica,  $\left. {f_0 /h_0 } \right|_{{\rm{coupled}}} $ is 7000 and 430 times larger than
 $\left. {f_0 /h_0 } \right|_{{\rm{freespace}}} $, respectively, and that the magnitude of K lf is more than 10 times larger than K contact and is predominantly independent of frequency. In sapphire, the f 0/h 0 inequalities are slightly larger, and the difference between K lf and K contact is slightly less. As the data clearly show, however, there is no significant difference in the measured phase angle between silica and sapphire. Based on the magnitude of these inequalities and more importantly, experimental evidence that will be provided shortly, we conclude that neither the actuator nor the finite frame stiffness make a significant contribution to the measured phase angle.
Having eliminated the stiffness and damping of the actuator and the stiffness of the load frame and the specimen mounting as potential explanations for the higher than expected phase angles shown in Fig. 2, we conclude that the most likely explanation is a shift created by the displacement electronics or possibly physical damping in the load frame. Regardless of the source, we propose that the error in the phase angle can be removed by building into the reference phase the observed deviation between the measured phase angle and zero for the fused silica and sapphire data (Fig. 2), as this will more completely account for the instrument's contribution to the phase angles measured by the PLA.
From 4 to 48 Hz, the standard reference phase angles for the instrument used in this investigation are stored in an instrument calibration file and vary in a nonlinear way from 4.24 to −3.46°. Subtracting the average value of the silica and sapphire data in Fig. 2 from the reference phase angles, the corrected values now range from 3.59 to −6.48°. To verify these values, the PLA was reconfigured with the new calibrations, and the experiments were repeated in silica. The frequency sweep was performed twice at each location; the first sweep from 4 to 48 Hz and the second in reverse order, from 48 to 4 Hz. To demonstrate that contributions to the measured phase angle from the instrument's actuator and the load frame stiffness are in fact negligible, the phase angle of the specimen was also calculated from the stiffness and damping measured by the PLA. The calculations are simple to implement and frequently used because it is the only way to determine the phase angle of the specimen when the criteria established by Eqs. (1) and (2) are not met, which we will show is precisely the case for the data acquired in PC and PMMA.Reference Herbert, Oliver, Lumsdaine and Pharr13,Reference Herbert, Oliver and Pharr18
Contributions to the measured phase angle from the instrument's actuator and the stiffness of the load frame can be removed using the following well-established relations:
 $${\rm{\delta }}_{{\rm{corrected}}} = {\rm{tan}}^{ - 1} \left( {{{C_{{\rm{contact}}} {\rm{\omega }}} \over {K_{{\rm{contact}}} - m{\rm{\omega }}^2 }}} \right)\quad ,$$
 $$C_{{\rm{contact}}} {\rm{\omega }} = \left. {{{f_0 } \over {h_0 }}\sin {\rm{\delta }}} \right|_{{\rm{coupled}}} - \left. {{{f_0 } \over {h_0 }}\sin {\rm{\delta }}} \right|_{{\rm{free\,\,space}}} \quad ,$$
 $$K_{{\rm{contact}}} - m{\rm{\omega }}^2 = \left[ {{1 \over {\left. {{{f_0 } \over {h_0 }}\cos {\rm{\delta }}} \right|_{{\rm{coupled}}} - \left. {{{f_0 } \over {h_0 }}\cos {\rm{\delta }}} \right|_{{\rm{free\,\,space}}} }} - {1 \over {K_{{\rm{lf}}} }}} \right]^{ - 1} \quad ,$$
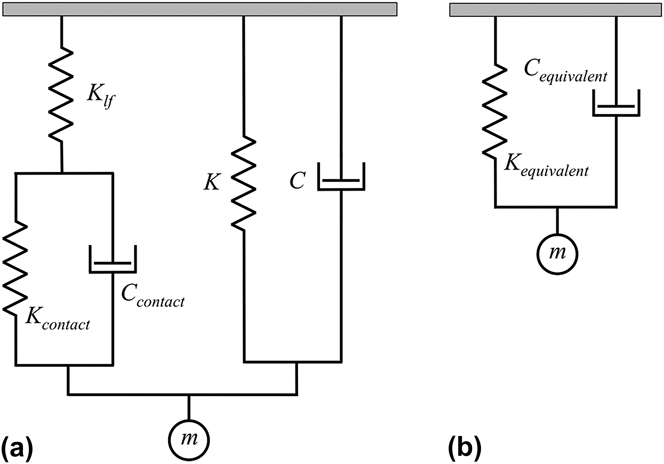
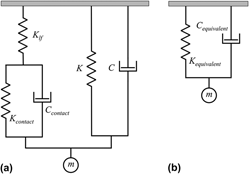
where δcorrected represents the phase angle of the specimen, and the terms K contact − mω2 and C contactω represent the in-phase and out-of-phase components, respectively, of the specimen's response to the imposed harmonic oscillation. The basis of these relations is the spring and dashpot model shown in Fig. 3(a), where K, m, and C physically represent the frequency independent stiffness, mass and damping coefficient of the instrument's actuator, respectively, K lf is the frequency-independent stiffness of the instrument's load frame, C contact is the equivalent damping coefficient of the contact, and K contact is the equivalent spring constant of the contact. Note that Eq. (5) implicitly assumes that the moving mass in the system is constant, i.e., the moving mass of the specimen must be negligible in comparison to the moving mass of the instrument. During an experiment, the model reduces to Fig. 3(b), where the spring and dashpot represent the equivalent or combined stiffness and damping of the instrument and test specimen. It is important to note that these models do not assume any particular parametric model for the specimen, and they have little to no predictive capability because they only provide the equivalent stiffness and damping of the contact at a single frequency. In other words, the model cannot be used to determine the frequency-independent spring constant (K contact) or the damping coefficient of the test specimen (C contact) unless the specimen can be accurately modeled by the single spring and dashpot in parallel [Fig. 3(a)], which is very unlikely since the majority of viscoelastic solids require multiple springs and dashpots.Reference Lakes20 However, the output from these models, which is the equivalent frequency-specific stiffness and damping of the contact, is precisely the data needed to reliable estimate the phase angle of the specimen or, if the contact area is known, the components of the complex modulus at a single fixed frequency.Reference Herbert, Oliver and Pharr18 Measurements made at multiple frequencies can in turn be used to develop a parametric model that describes the specimen's behavior over the range of measured frequencies.Reference Herbert, Oliver and Pharr18
(a) The dynamic model of the instrument and the test specimen. (b) A simplified dynamic model that represents the equivalent stiffness and damping.
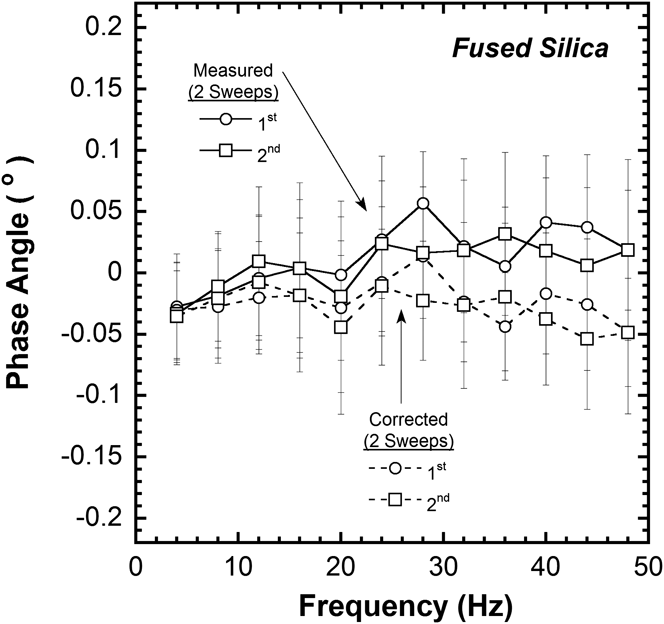
Figure 4 shows the measured and corrected phase angles of fused silica. The measurements were performed using the new reference phase calibration for the PLA, and the corrected phase angles were calculated using Eqs. (3)–(5). The magnitude of K lf that we have used throughout this work is 6.35 × 10⁶ N/m. To within one standard deviation about the mean, the data show that the measured and corrected phase angles are nominally the same, which clearly demonstrates that the new reference phase angles effectively account for the instrument's collective contribution to the measured phase angle. Although the average phase angles suggest that there may be a very small frequency-dependent error in the applied corrections, or perhaps an additional unaccounted source of damping, the scatter is too large to draw any meaningful conclusions. Nevertheless, as expected, the average corrected phase angle is very close to zero, approximately −0.03, practically independent of frequency, and insensitive to the order in which the frequency sweep was performed. The scatter of ±0.06° does not reflect variability in the specimen, but rather the ratio of signal to noise associated with the 8-nm oscillation. Collectively, the phase angle data obtained in fused silica and sapphire, which are shown in Figs. 2 and 4, clearly demonstrate that over the frequency range of 4–48 Hz, the proposed corrections to the reference phase angles of the PLA are required when the correction values shown in Fig. 2 are a significant fraction of the specimen's phase angle.
The measured and corrected phase angle versus frequency in fused silica, illustrating the effect of a new calibration to the PLA that accounts for contributions to the measured phase angle from the instrument's electronics and/or physical damping in the load frame.
It is important to note that the PLA's reference phase angles will be different from one instrument to the next, irrespective of the make and model. Although the technique that was used to determine the additional reference phase angles shown in Fig. 2 is generally applicable to all instruments, the specific measured values are unique to the instrument used to perform the experiment and are not suitable to be implemented elsewhere. Assuming the additional calibration is independent of the instrument's load frame, then the calibration is fixed and would only need to be repeated if the instrument's PLA or electronics were changed. As previously noted, the additional reference phase angles shown in Fig. 2 are most likely caused by the instrument's electronics and are, therefore, not unique to overcritically damped actuators such as the XP. Underdamped systems are potentially just as susceptible to the reference phase angle errors documented in this investigation.
To briefly summarize, the salient aspects of the experimental technique that was used here to determine the additional reference phase calibration were as follows: (i) the phase angle of fused silica and sapphire, both of which are taken to be linear elastic solids at room temperature, was measured over a frequency range in which the instrument's actuator behaves as a single degree of freedom simple harmonic oscillator. The contact dimensions were chosen by design such that the criteria established by Eqs. (1) and (2) were met. The PLA was configured with the standard reference phase angles, which compensate for the phase shift induced only by the electronics that process the load signal; (ii) the new reference phase calibration values were determined by subtracting the phase angles measured at each frequency from the standard reference phase values; (iii) The new calibration, which now compensates for the shift induced by the load and displacement electronics, was confirmed by configuring the PLA with the new reference phase values and then repeating the experiments in fused silica. Validation of the method was evaluated based on the test method ability to accurately measure the phase angle of fused silica, which is nominally taken to be zero. Further validation of the new reference phase calibration is provided in the following sections, where the new calibration values and the proposed test method were applied to PC and PMMA, for which phase angle values are independently available. As will be described, the critical elements of these experiments are achieving steady state harmonic motion, realizing frequency separation from creep transients and avoiding potential skin effects.
C. Experimental verification of the modified CSM technique and the new reference phase calibration
1. Polycarbonate
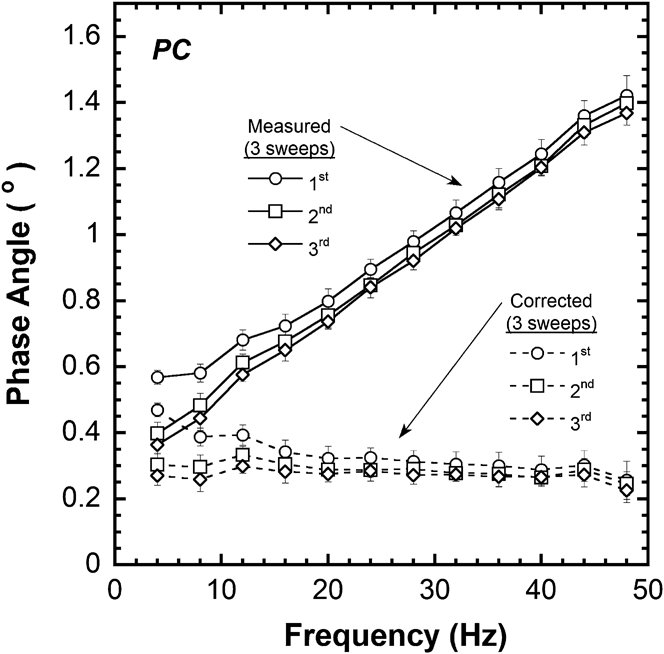
Figure 5 shows the measured and corrected phase angles obtained in PC over the frequency range of 4–48 Hz. The phase angle results are presented in two groups: measured and corrected. Within each group, the results are labeled 1st, 2nd, and 3rd to indicate the chronological order of the 3 sweeps. Four important observations in these results merit discussion: (i) the sweep-to-sweep repeatability of the phase angle and the effect of insufficient frequency separation, (ii) the instrument's relative contributions to the measured phase angle, (iii) the excellent correlation between the corrected and expected literature value of 0.3°, and (iv) the significant improvement in precision.
The measured and corrected phase angle of PC, showing the effect creep through 3 successive sweeps from 4 to 48 Hz as well as the influence of the instrument's actuator and load frame stiffness.
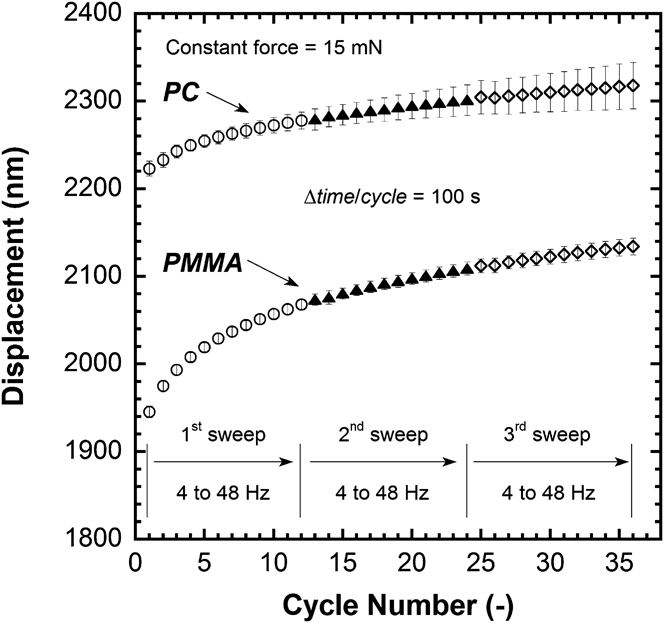
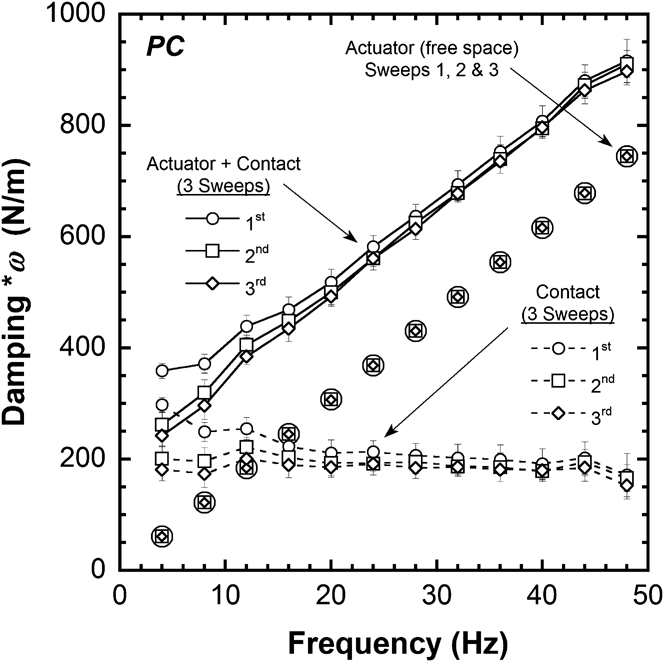
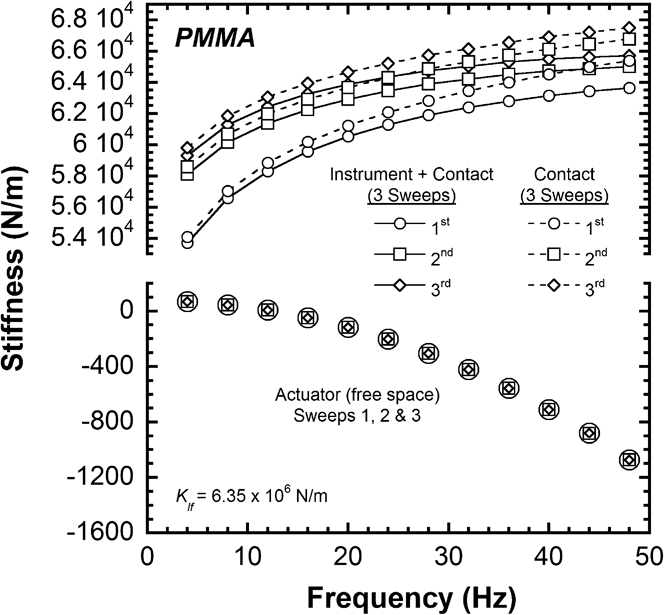
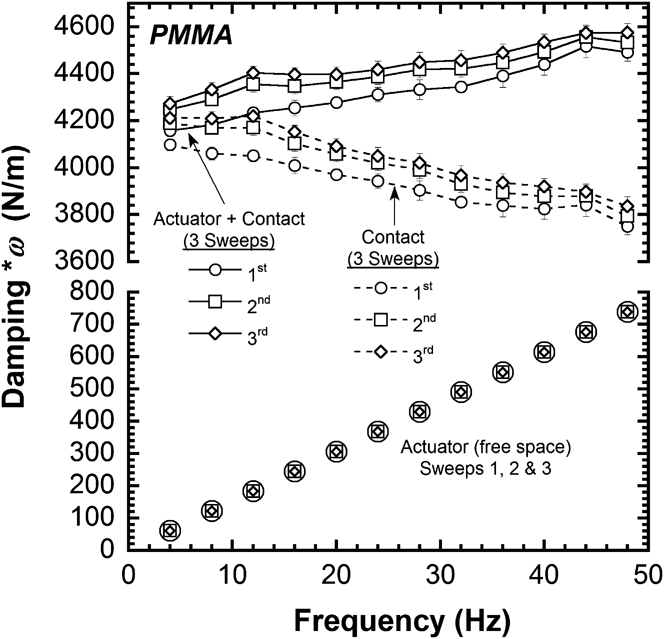
To facilitate the discussion of these observations, Figs. 6–9 examine changes in the normal displacement with time as well as the frequency and sweep-to-sweep dependence of the parameters  $\left. {f_0 /h_0 } \right|_{{\rm{coupled}}} $, stiffness, and damping. For both PC and PMMA, Fig. 6 shows the normal displacement versus cycle number for all 36 cycles (12 frequencies per sweep repeated 3 times), each of which are separated in time by approximately 100 s. These data show that in PC, the creep rates prior to starting each sweep (cycles 1, 13, and 25) are approximately 0.2, 0.05, and 0.03 nm/s, respectively. In PMMA, the rates are approximately 0.9, 0.06, and 0.04 nm/s, respectively. Figure 7 shows the frequency and sweep-to-sweep dependence of the parameter
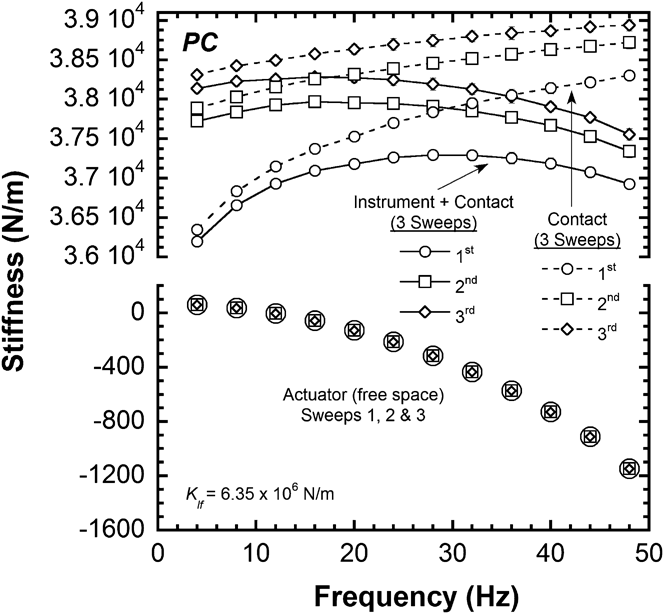
 $\left. {f_0 /h_0 } \right|_{{\rm{coupled}}} $ for both PC and PMMA. Figures 8 and 9 show the frequency and sweep-to-sweep dependence of stiffness and damping in PC. To quantify the various contributions to the measured stiffness and damping, the data in Figs. 8 and 9 are presented in 3 groups: (i) the actuator itself, (ii) the combined or coupled response of the instrument and contact, and (iii) the contact itself. In terms of the model illustrated in Fig. 3, the frequency-specific stiffness and damping of the actuator are defined according to:
 $$K_{{\rm{actuator}}} = K - m{\rm{\omega }}^2 = \left. {{{f_0 } \over {h_0 }}\cos {\rm{\delta }}} \right|_{{\rm{free\,\,space}}} \quad ,$$
 $$C_{{\rm{actuator}}} = C{\rm{\omega }} = \left. {{{f_0 } \over {h_0 }}{\rm{sin\delta }}} \right|_{{\rm{frees\,\,pace}}} \quad .$$
When the instrument and specimen are coupled together through the geometry of the contact, the measured stiffness and damping at a fixed frequency are defined by:
 $$K_{{\rm{instrument + contact}}} = K_{{\rm{equivalent}}} - m{\rm{\omega }}^2 = \left. {{{f_0 } \over {h_0 }}\cos {\rm{\delta }}} \right|_{{\rm{coupled}}} \quad $$
 $$C_{{\rm{instrument + contact}}} = C_{{\rm{equivalent}}} {\rm{\omega }} = \left. {{{f_0 } \over {h_0 }}{\rm{sin\delta }}} \right|_{{\rm{coupled}}} \quad .$$
The frequency-specific stiffness and damping of the contact itself are determined from Eqs. (4) and (5).
The change in displacement with cycle number (100 s/cycle) illustrates the creep rate observed in PC and PMMA during the constant load hold period over which the phase angle measurements were made for all 3 sweeps from 4 to 48 Hz.
The effect of creep on the parameter  $f_0 /h_0 $ in PC and PMMA.
The effect of creep and contributions from the instrument's actuator and load frame stiffness on the frequency-dependent contact stiffness (the in-phase component of the specimen's response to the harmonic excitation) in PC.
The effect of creep and contributions from the instrument's actuator on the frequency-dependent contact damping (the out-of-phase component of the specimen's response to the harmonic excitation) in PC.
a. The effect of insufficient frequency separation
The decrease in phase angle between the lowest frequencies of the 1st and 2nd sweeps, which is shown in Fig. 5, is not the result of novel material behavior, but rather the inability of the experiment to achieve sufficient frequency separation because of the creep behavior documented in Fig. 6. At depths beyond which the skin effect is observed in PC (Fig. 1, h > 1500 nm), we assume the specimen is a bulk homogeneous solid such that at a fixed frequency, the phase angle is presumably independent of the contact dimensions, and the stiffness and damping must, therefore, scale in proportion with the dimensions of the contact in a manner that is consistent with Eqs. (3)–(5). We note, however, that this proportional scaling does not signify the data that are representative of linear viscoelasticity. At 4 and 8 Hz, the concurrent increase in  $\left. {f_o /h_o } \right|_{coupled} $ and stiffness, which are shown in Figs. 7 and 8, respectively, are consistent with the creep behavior shown in Fig. 6. Damping, on the other hand, which is shown in Fig. 9, decreases by as much as 27% between the 1st and 2nd sweeps and, thus, provides experimental evidence indicating the data collected by the PLA at the lower frequencies of the 1st sweep are not reliable. The average damping values suggest that the decreasing trend continues with increasing frequency, but the scatter is too large to draw any meaningful conclusions beyond 8 Hz. The most likely explanation for the error in damping is unreliable phase angle and displacement data obtained from the PLA due to the lack of frequency separation from the creep behavior as shown in Fig. 6. Among the experimental variables that potentially contribute to the lack of frequency separation are the 30-s averaging window, the drive frequency, and the 0.5-s time constant in the PLA. The combination of these variables and the creep behavior creates a complex interaction between the frequency and time domains, which makes it difficult to reliably measure the phase angle of the specimen. This problem is precisely why the frequency sweep was repeated 3 times in PC and PMMA. As the creep rates diminish with time, which is indirectly shown in Fig. 6, the frequency separation improves such that the 2nd and 3rd sweeps yield statistically similar results in the phase angle, which is shown in Fig. 5. The repeatability in phase angle between the 2nd and 3rd sweep is taken to be experimental evidence that directly signifies that sufficient frequency separation has been achieved to within the precision of the measurement. It is important to understand that despite the strong correlation between the phase angles measured in the 2nd and 3rd sweeps, the contact area is not entirely constant, but rather increases slightly with time, as indirectly shown in Figs. 6–8 and the data obtained in the 2nd and 3rd sweeps. Nevertheless, the change in area is sufficiently small that any lack of frequency separation results in a change in the phase angle that is below the precision of the measurement, as illustrated by the scatter bars shown in Fig. 5. For the remaining discussion, references to specific values of the stiffness, damping, and phase angle are taken from data obtained in the 3rd sweep, which are presumably the most reliable based on the sweep-to-sweep repeatability.
b. Relative contributions to the measured phase angle
According to Eq. (5), the coupled stiffness includes at least three contributions: the actuator, specimen, and load frame. Figure 8 shows that the stiffness of the actuator [Eq. (6)] changes significantly with frequency, but its magnitude is never more than 3.1% of the coupled or combined stiffness of the instrument and actuator [Eq. (8)]. The contact stiffness [Eq. (5)] is weakly dependent on frequency and is never more than 0.7% of K lf. These results indicate that the measured stiffness is mainly representative of the specimen, and contributions from the actuator and K lf are negligible. Damping from the actuator [Eq. (7)], on the other hand, which is shown in Fig. 9, increases linearly with frequency and contributes as much as 24–83% of the total measured damping of the actuator and contact [Eq. (9)] at 4 and 48 Hz, respectively. These results indicate that the actuator contributes significantly to the measured damping, particularly as the frequency increases. Collectively, these observations and the relationships expressed by Eqs. (3)–(9) clearly indicate that the measured phase angles in Fig. 5 increase linearly with frequency because the measured damping is progressively dominated by the actuator rather than the specimen. These data emphasize the importance of accurately determining the damping of the actuator, as it accounts for as much as 83% of the total damping at 48 Hz. It is very important to recognize that the relative contributions from the actuator will scale with the dimensions of the contact, placing even more burden on the accuracy of actuator's stiffness and damping as the contact dimensions decrease. For comparative purposes, evaluating Eqs. (1) and (2) at 4 and 48 Hz in PC yields  $\left. {f_0 /h_0 } \right|_{{\rm{coupled}}} $ is 440 and 28 times larger than
 $\left. {f_0 /h_0 } \right|_{{\rm{freespace}}} $, respectively, and the magnitude of K lf is nearly 165 times larger than K contact. At 4 and 48 Hz, the difference between the measured and calculated phase angles are approximately 31 and 144%, respectively. Table II compares these metrics to the values obtained in silica and PMMA.
c. Improved accuracy and precision in the corrected phase angle
After subtracting the instrument's contributions to the measured stiffness and damping through the implementation of Eqs. (4) and (5), the corrected phase angle of PC was determined using Eq. (3) and found to be nearly independent of frequency with a magnitude of approximately 0.27 ± 0.05°, which agrees very well with the nominally expected literature value of 0.3°.Reference Crowet15−Reference Kolman, Ard and Beatty17 In comparison to the standard CSM method (Fig. 1), this result reduces the relative error in the estimated phase angle from 1900% to within 10% or better. In addition, the scatter in the phase angle determined by the modified CSM method is decreased by a factor of 10 or more, thereby dramatically increasing the precision of the measured phase angle. To further examine the possibility of potential skin effects, the phase angle of PC was also measured at a depth of 14 μm. Measurements at this depth yielded statistically similar results, thereby, indicating that the phase angles measured at 2.3 μm are free from the processing skin effect, which is consistent with the phase angle data shown in Fig. 1.
2. Polymethylmethacrylate
In comparison to PC, the measured phase angle, stiffness, and damping in PMMA are less affected by contributions from the instrument because the phase angle of PMMA is approximately 10 times larger and the contact stiffness is nearly 50% higher.Reference Guerdoux, Duckett and Froelich16 Ignoring pile-up, the displacement data shown in Fig. 6 indicate that the contact dimensions in PC and PMMA are similar to within 10%. Based on data from the 3rd sweep, the actuator's stiffness, which is shown in Fig. 10, is never more than 1.8% of the coupled stiffness, and the maximum coupled stiffness is less than 1.1% of K lf. The actuator's damping, which is shown in Fig. 11, contributes to the coupled response in PMMA by as much as 1.5–16.2% over the range of 4–48 Hz. With exception to the contribution from K lf, all of these comparative metrics for PMMA are smaller percentages, some significantly smaller, than those observed in PC. Evaluating Eqs. (1) and (2) at 4 and 48 Hz in PMMA,  $\left. {f_0 /h_0 } \right|_{{\rm{coupled}}} $ is 700 and 48 times larger than
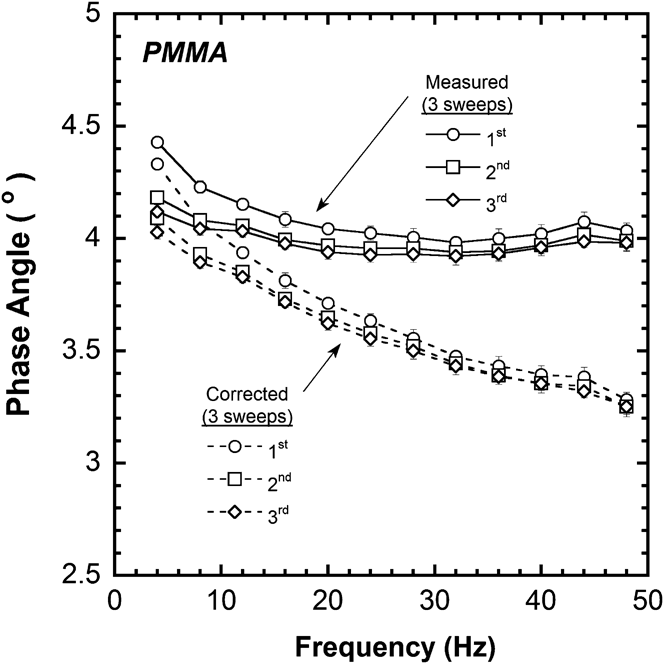
 $\left. {f_0 /h_0 } \right|_{{\rm{freespace}}} $, respectively, and the magnitude of K lf is nearly 96 times larger than K contact. At 4 and 48 Hz, the difference between the measured and corrected phase angles from the 3rd sweep, which are shown in Fig. 12, is approximately 1.5 and 20%, respectively. Table II summarizes these metrics. In comparing the results obtained in PC and PMMA, it is clear that for a similarly sized contact, the measured phase angle, stiffness, and damping in PMMA are less affected by contributions from the instrument due to PMMA's higher phase angle and higher contact stiffness. As such, the corrected phase angles of PMMA are less sensitive to the potential effects of violating the requisite assumptions and the uncertainty in the experimental variables associated with the implementation of Eqs. (3)–(5).
The effect of creep and contributions from the instrument's actuator and load frame stiffness on the frequency-dependent contact stiffness (the in-phase component of the specimen's response to the harmonic excitation) in PMMA.
The effect of creep and contributions from the instrument's actuator on the frequency-dependent contact damping (the out-of-phase component of the specimen's response to the harmonic excitation) in PMMA.
The measured and corrected phase angle of PMMA, showing the effect creep through 3 successive sweeps from 4 to 48 Hz as well as the influence of the instrument's actuator and load frame stiffness.
In contrast to PC, the parameters  $\left. {f_0 /h_0 } \right|_{{\rm{coupled}}} $, stiffness, and damping, which are shown in Figs. 7, 10, and 11, respectively, all increase with each subsequent frequency sweep in PMMA. Given that the documented creep rate at the start of the first sweep in PMMA is over 4 times faster than the rate observed in PC, it is surprising that the anomalous decrease in damping does not occur in PMMA as it does in PC, particularly since the phase angle measurements, which are shown in Fig. 12, indicate that sufficient frequency separation in the PMMA does not occur until approximately half way through the 1st sweep. These results further support the conclusion that sweep-to-sweep comparisons of the parameters
 $\left. {f_0 /h_0 } \right|_{{\rm{coupled}}} $, stiffness, and damping cannot be used to evaluate the reliability of the data obtained from the PLA. Analogous to the PC results, the most reliable metric for assessing frequency separation is the sweep-to-sweep repeatability of the phase angle, which in both PC and PMMA improves with decreasing creep rates. In comparison to PC, Fig. 12 shows that PMMA requires more stabilization time to achieve sufficient frequency separation, which is consistent with the higher creep rates documented in Fig. 6.
The corrected phase angle results from the 2nd and 3rd sweeps correlate well with one another and show that the phase angle of PMMA decreases from approximately 4 to 3.3° (18% change) over the frequency range of 4–48 Hz. These results are consistent with previously published data to within 10% or better.Reference Capodagli and Lakes14,Reference Guerdoux, Duckett and Froelich16 Although not explicitly documented here, the PMMA specimen was found to exhibit statistically similar phase angles at a depth of 12 μm, thereby indicating that the phase angles measured at 2.1 μm are free from the skin effect, which is also consistent with the phase angle data shown in Fig. 1.
IV. CONCLUSIONS
Experimental observations from dynamic nanoindentation experiments conducted at 22 ± 0.1 °C with a Berkovich diamond indenter in four reference materials [fused silica, sapphire, polycarbonate (PC) and polymethyl methacrylate (PMMA)] yield the following conclusions:
(1) At 45 Hz and an approximate indentation depth of 2 μm, experiments performed with the standard CSM technique overestimated the phase angle of PC and PMMA by approximately 1900% and 135%, respectively. This overestimation is the direct result of not completely accounting for the instrument's cumulative contributions to the measured phase angle and the lack of steady-state harmonic motion over the time scale in which the phase angle measurements were made. The overestimation is not the result of a processing skin effect.
(2) Over the frequency range of 4–48 Hz, experiments conducted with a new test method optimized to achieve steady-state harmonic motion equally overestimated the phase angle of fused silica (depth = 2200 nm) and sapphire (depth = 480 nm), both of which have a nominal phase angle of 0°, by 0.6° at 4 Hz and 3° at 48 Hz. The higher than expected values are the result of an additional phase shift from the instrument's electronics or possibly physical damping in the instrument's load frame. Based on these overestimations, a new calibration to the reference waveform of the phase lock amplifier was created. Experiments conducted with the new calibration and the new test method estimated the phase angle of fused silica to be −0.03 ± 0.06° and independent of frequency, which is in good agreement with the nominally expected value of 0°.
(3) Experimental verification of the new calibration to the PLA and the new test method were examined by experiments conducted in PC and PMMA. At an approximate indentation depth of 2 μm and over the frequency range of 4–48 Hz, the estimated phase angles of PC and PMMA were found to be within 10% of previously published results. In addition, the scatter in the measured phase angle was reduced by more than a factor of 10 in comparison to the standard CSM technique.
(4) Time-dependent deformation that allows the contact area to change over the time scale in which the phase angle measurement is made prevents steady-state harmonic motion from being achieved and thus generates unreliable results. The measurements performed in PC and PMMA clearly indicate that for a given set of experimental conditions, the best metric to evaluate the reliability of the phase angle measurement is its stability over time.
(5) To estimate the phase angle of PC and PMMA, the instrument's contribution to the measured phase angle has to be accurately subtracted. In the case of PC, the damping in the actuator accounted for 83% of the total measured damping at 48 Hz. This observation underscores the importance of accurately determining the damping of the actuator, particularly in realizing that the actuator contribution increases as the contact dimensions become smaller.
ACKNOWLEDGMENT
Financial support for this work was provided by the National Science Foundation under NSF Grant No. 1069165.