Implications
Herein, we have characterized the variability of the malic enzyme 1 (ME1) gene in Murciano–Granadina goats. Identification of several polymorphisms has allowed us to perform association analyses with a wide array of milk yield and composition traits. We have not found conclusive evidence that ME1 allelic variation affects these phenotypes, although associations with uncorrected P-values below 0.01 have been observed for conjugated linoleic acids, elaidic and palmitic fatty acid milk contents. The absence of significant associations might be due to experimental or biological factors, and therefore further studies with larger and more diverse resource populations will be needed to investigate the influence of ME1 genotype on ruminant lipogenesis. This information would be valuable in the implementation of marker-assisted selection schemes devoted to improve the nutritional properties of goat milk.
Introduction
Malic enzyme 1 (ME1) catalyzes the oxidative decarboxylation of l-malate to pyruvate and plays a key role in lipogenesis because it is one of the main sources providing the NADPH required for de novo fatty acid (FA) synthesis (Chang and Tong, Reference Chang and Tong2003). However, in ruminants, its contribution to this process is less relevant because NADPH is fundamentally generated through the pentose phosphate and citrate dehydrogenase pathways (Nafikov and Beitz, Reference Nafikov and Beitz2007). Malic enzyme 1 activity has been detected in a wide variety of bovine tissues such as adipose tissue, heart, lungs, spleen, kidney, tongue and muscle (Whanger and Church, Reference Whanger and Church1970). In sheep, Stefos et al. (Reference Stefos, Argyrokastritis, Bizelis and Rogdakis2008) have shown that the ME1 gene yields two transcripts of 2.1 and 3.2 kb that share the same coding sequence (∼1.7 kb) but differ in the length of the 3′UTR. The ovine ME1 gene has a ubiquitous pattern of mRNA expression, being abundantly transcribed in the adipose tissue, udder, ovaries and cerebellum (Stefos et al., Reference Stefos, Argyrokastritis, Bizelis and Rogdakis2008). Interestingly, ME1 mRNA levels in adipose tissue after refeeding are 1.6-fold higher than in adipose tissue after starvation (Stefos et al., Reference Stefos, Argyrokastritis, Bizelis and Rogdakis2008). Moreover, Bernard et al. (Reference Bernard, Rouel, Leroux, Ferlay, Faulconnier, Legrand and Chilliard2005) have shown that, in goats fed a hay-based diet, ME1 activity in the perirenal tissue is significantly higher in the group supplemented with 3.6% lipid of formaldehyde-treated linseed than in the control group. These findings clearly evidence that the expression of ME1 in lipogenic tissues is modulated by nutrition. In this study, we aimed to investigate whether the variability of the coding region of the caprine ME1 gene is associated with milk FA composition in Murciano–Granadina goats.
Material and methods
Animal material and phenotype recording
Four hundred fifty-two Murciano–Granadina goats were used to determine genotype frequencies of the caprine ME1 locus. These goats belonged to two different groups: Group 1 (sampled during 2003 to 2004), with 133 goats distributed in three disconnected herds (Badaoui et al., Reference Badaoui, Serradilla, Tomàs, Urrutia, Ares, Carrizosa, Sànchez, Jordana and Amills2007), and Group 2 (sampled during 2007 to 2008), with a single herd of 319 goats. Association analyses for dairy (milk yield, somatic cell count, %fat, %protein, %lactose and %dry extract) and milk FA composition traits involved 309 (Group 1: 133 and Group 2: 176) and 176 (Group 2) goats, respectively. Methods used for measuring dairy traits in Group 1 are fully reported in Badaoui et al. (Reference Badaoui, Serradilla, Tomàs, Urrutia, Ares, Carrizosa, Sànchez, Jordana and Amills2007). With regard to Group 2, whole milk was collected in the first of the two daily milking sessions with a periodicity of every 2 months. Phenotype recording began 3 months after parturition. A CombiFoss 600 FC instrument constituted by a MilkoScan FT 6000 for the analysis of milk components and a Fossomatic FC for SCCs (Foss Electric Hillerød, Denmark) was used to measure protein, fat, lactose, dry extract contents as well as somatic cell count (SCC).
The following milk FA composition traits were recorded in Group 2: butyric (C4:0), caproic (C6:0), caprylic (C8:0), capric (C10:0), undecanoic (C11:0), lauric (C12:0), tridecanoic (C13:0), myristic (C14:0), myristoleic (C14:1), pentadecanoic (C15:0), pentadecenoic (C15:1), palmitic (C16:0), palmitoleic (C16:1), heptadecanoic (C17:0), heptadecenoic (C17:1), stearic (C18:0), elaidic (C18:1n-9t), vaccenic (C18:1n-11t), oleic (C18:1n-9c), linolelaidic (C18:2n-6t), linoleic (C18:2n-6c), α-linolenic (C18:3n-3a), γ-linolenic (C18:3n-6g), cis-9, trans-11 CLA, trans-10, cis-12 CLA, other CLA, arachidic (C20:0), eicosenoic (C20:1), eicosadienoic (C20:2), henicosanoic (C21:0), saturated FA (SFA), monounsaturated FA (MUFA), polyunsaturated FA (PUFA), conjugated linoleic acids (total CLAs), n-3 (i.e. α-linolenic and others), n-6 (i.e. linoleic and others) and de novo and performed FA (Moate et al., Reference Moate, Chalupa, Boston and Lean2007). Separation and quantification of FA methyl esters were performed with a gas chromatograph Agilent 6890N Network GS System (Agilent, Santa Clara, CA, USA), equipped with a flame ionization detector and fitted with an HP-88 capillary column (100 m, 0.25 mm i.d., 0.2 μm film thickness). Nonanoic acid methyl ester (C9:0 ME, 4 mg/ml) was used as an internal standard. Extraction and direct methylation were performed with a single-step method following the procedures reported by Sukhija and Palmquist (Reference Sukhija and Palmquist1998). Individual FAs were identified by comparing their retention times with those of an authenticated standard FA mix Supelco 37 (Sigma Chemical Co. Ltd, Poole, UK). Identification of the CLA isomers 9cis-11trans, 11cis-13trans, 10trans-12cis and 10cis-12cis CLA was achieved by comparing retention times with those of another authenticated standard mix (Sigma Chemical Co. Ltd, Poole, UK). FA content was expressed as the percentage of total methyl esters.
Sequence analysis and genotyping of the goat ME1 gene
Total RNA was isolated from liver samples of Murciano–Granadina (n = 3) and Malagueña goats (n = 3) by using the RiboPure Kit (Ambion Inc., Austin, TX, USA). The synthesis of complementary DNA was carried out with the ThermoScript RT-PCR kit (Invitrogen S.A., Barcelona, Spain) according to the instructions of the manufacturer. The coding sequence of the caprine ME1 gene was partially amplified (from 133 to 1715 bp, reference sequence: GenBank accession number EU646206) by using two pairs of primers (Supplementary Table 1). PCR included 2.5 μl PCR buffer, 1 μl MgCl2 (50 mM), 0.5 μl dNTP (5 mM), 1.25 μl of each primer (10 μM), 2 μl cDNA and 0.25 μl of Taq DNA polymerase (5 U/μl, Ecogen S.R.L., Barcelona, Spain) in a final volume of 25 μl. The thermal profile consisted of 35 cycles of 94°C for 1 min, annealing temperature (Supplementary Table 1) for 1 min and 72°C for 2 min. Amplified products were sequenced with the BigDye Terminator v3.1 cycle sequencing Kit (Applied Biosystems, Foster City, CA, USA). Sequencing reactions were purified with the Montage SEQ96 cleanup kit (Millipore Corporation, Billerica, MA, USA) and analyzed in an ABI PRISM 3730 capillary electrophoresis device (Applied Biosystems).
Genomic DNA was isolated from blood samples (452 goats) following the protocols described by Caravaca et al. (Reference Caravaca, Carrizosa, Urrutia, Baena, Jordana, Amills, Badaoui, Sànchez, Angiolillo and Serradilla2009). Regions containing polymorphisms were amplified with primers listed in Supplementary Table 1. Amplification reactions included 2.5 μl PCR buffer, 1 μl MgCl2 (50 mM), 0.5 μl dNTP (5 mM), 1.25 μl of each primer (10 μM), 100 ng genomic DNA and 0.25 μl of Taq DNA polymerase (5 U/μl, Ecogen S.R.L., Barcelona, Spain) in a final volume of 25 μl. The thermal profile consisted of 35 cycles of 94°C for 1 min, annealing temperature (Supplementary Table 1) for 1 min and 72°C for 2 min. The PCR products were purified by using the ExoSAP-IT kit (Amersham Biosciences Europe GmbH, Barcelona, Spain). Genotyping was carried out either with the SnaPshot ddNTP Primer Extension kit (Applied Biosystems) or with the Sequenom MassARRAY iPLEX platform at the Spanish National Genotyping Centre (CeGen, Santiago de Compostela, Spain). The extension primers used in the primer-extension genotyping protocols were 5′-TCT TGG CTT GGG AGA-3′ (polymorphism c.483C > T), 5′-TGA ATT CAT CCA AAA AAT-3′ (polymorphism c.667G > A) and 5′-CAG CCT TCA ATG AAC G-3′ (polymorphism c.1200G > A). Hardy–Weinberg equilibrium for the three polymorphisms was tested with the Hardy–Weinberg equilibrium online tool (http://www.oege.org/software/hwe-mr-calc.shtml, Rodríguez et al., Reference Rodríguez, Gaunt and Day2009).
Statistical analysis
Association analyses between ME1 genotypes and traits under study were performed with the SAS software (SAS 9.2 Institute Inc., Cary, NC, USA) using a mixed model for repeated measurements (Littell et al., Reference Littell, Henry and Ammerman1998). The number of goats with registers for milk yield, milk protein, fat, lactose content, dry extract content and SCC logarithmic (logSCC) was 309, while a subset of 176 individuals also had records for milk FA composition. The statistical model was as follows:

where Yijklmn is each one of the analyzed phenotypes and cn and eijklmn are the random animal and residual effects, respectively. The following fixed effects were included in the model: Hi = herd (four levels, not considered in the analysis of FA composition traits because all individuals belonged to the same herd); OLj = ordinal number of lactation; NKk: number of kids born; MEl = ME1 genotype; LACTm = month of lactation. Season of sampling was included as an additional fixed factor in the analysis of milk FA traits because there is a seasonal effect on lipid composition of plant pastures and this might influence milk FA composition (Mel’uchová et al., Reference Mel’uchová, Blaško, Kubinec, Górová, Dubravská, Margetín and Soják2008). Finally, LogSCC was used as a covariate in the analysis of milk FA traits because Jensen (Reference Jensen2002) reported that udder health might have an impact on milk FA composition. The analysis was carried out for each single nucleotide polymorphism (SNP) and trait. To correct for multiple testing, a Benjamini–Hochberg (B-H) approach was used in accordance with Thissen et al. (Reference Thissen, Steinberg and Kuang2002). This statistical procedure controls the false discovery rate by sequentially comparing observed P-values for each of a family of multiple test statistics, in decreasing order of magnitude, with a list of computed critical B-H values. In this context, the null hypothesis is rejected when the observed P-value is smaller than the critical B-H value.
Results and discussion
Approximately 1.4 kb of the caprine ME1 coding region have been sequenced in several individuals (GenBank accession number GQ387511). Structural features of the partial amino acid primary sequence (81.6% of the total protein sequence) are shown in Supplementary Figure 1. Analysis of the goat ME1 amino acid sequence with Scan Prosite evidenced the existence of a motif (FNDDIQGTASVAVAGIL) typical of malic enzymes. Moreover, we used crystal structure data reported by Yang et al. (Reference Yang, Floyd, Loeber and Tong2000) for the human mitochondrial malic enzyme to infer additional structural motifs. This approach allowed us to identify three amino acid residues (E245, D246 and D269) highly conserved in mammals that play a fundamental role in the complexing of Mn2+, a co-factor required for enzyme biological activity, as well as two dinucleotide-binding signature motifs located at positions 158 to 163 (GLGDLG) and 301 to 306 (GAGEAA), respectively (Supplementary Figure 1). According to Yang et al. (Reference Yang, Floyd, Loeber and Tong2000), the active site of the ME1 enzyme is composed by the side chain of many residues (Y102, P104, V106, I156, L157, I169, K173, N408, P409 and S434) that, as expected, are conserved in goats (Supplementary Figure 1). Of these, Y102 and K173 have catalytic activity because they are strictly conserved in malic enzymes and have also been found in the active site of isocitrate dehydrogenase, another type of oxidative dehydrogenase (Yang et al., Reference Yang, Floyd, Loeber and Tong2000). Residues T103, P104, V106, R155, I156, L157 and I169 have been defined by Stefos et al. (Reference Stefos, Argyrokastritis, Bizelis and Rogdakis2008) as substrate-binding sites when analyzing the primary sequence of sheep ME1.
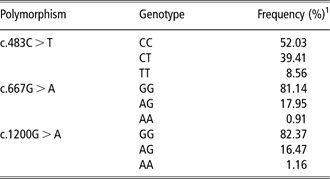
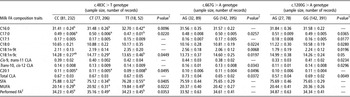
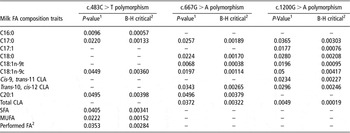
Alignment of goat ME1 sequences corresponding to six goats revealed the existence of four SNPs: c.483C > T SNP at exon 5, c.667G > A SNP at exon 6, c.927C > T SNP at exon 9 and c.1200G > A SNP at exon 11. Polymorphism c.667G > A involved an Aspartate to Asparagine substitution (D223N) that, according to Panther (http://www.pantherdb.org/tools/csnpScoreForm.jsp) and Polyphen (http://genetics.bwh.harvard.edu/pph/) analyses, does not have a functional effect. Three of these polymorphisms were genotyped in a Murciano–Granadina population (c.927C > T was not genotyped due to technical problems). Genotype frequencies of these polymorphisms are shown in Table 1. While genotype frequencies were extremely unbalanced for c.667G > A and c.1200G > A SNP (frequency of the minority homozygous genotype was about 1%), this bias was much less pronounced for the c.483C > T SNP (C: 0.72, T: 0.28). No departure from Hardy –Weinberg equilibrium was observed. We performed an association analysis between ME1 genotypes and dairy and milk FA composition traits. None of the dairy traits showed a significant relationship with ME1 genotype (Supplementary Table 2). In Table 2, we have displayed associations between ME1 genotypes and those milk FA traits that show uncorrected P-values below 0.05, while in Supplementary Tables 3 to 5 we depict the whole raw data. Moreover, in Table 3 we show the comparison between uncorrected P-values shown in Table 2 and their corresponding B-H critical values. This latter comparison evidences that, after correcting for multiple testing, none of the associations that we have found is significant. This might be due to experimental factors, that is, high number of tests performed and limited sample size, particularly for certain genotypic classes, or simply to the absence of a biological effect.
Genotype frequencies of the ME1 locus in Murciano–Granadina goats

1Genotype frequencies were calculated as the ratio between the number of goats with a given genotype and the number of goats successfully genotyped for the corresponding single nucleotide polymorphism.
Most relevant results (uncorrected P-values <0.05) of the association analysis between ME1 genotypes and milk FA traits

FA = fatty acid; CLA = conjugated linoleic acid; SFA = saturated fatty acid; MUFA = monounsaturated fatty acid.
a,bMeans within rows with different superscripts show differences (uncorrected P-value<0.05) between genotypic classes. It should be noticed that these differences became non-significant after correcting for multiple testing.
1Associations with uncorrected P-values>0.05 are indicated with a dash.
2Calculated as indicated by Moate et al. (Reference Moate, Chalupa, Boston and Lean2007).
Comparison between uncorrected P-values and B-H critical values for associations displayed in Table 2

FA = fatty acid; B-H = Benjamini–Hochberg; CLA = conjugated linoleic acid; SFA = saturated fatty acid; MUFA = monounsaturated fatty acid.
1Uncorrected P-value of the model.
2B-H critical value calculated as indicated by Thissen et al. (Reference Thissen, Steinberg and Kuang2002).
In light of this, the existence of ME1 genotype effects on milk composition in goats seems doubtful. As mentioned above, none of the associations stays significant after B-H correction. It may be argued that statistical tendencies are observed for several traits such as C16:0 (c.483C > T, P = 0.0096), C18:1n-9t (c.667G > A, P = 0.0068) and total CLA (c.1200G > A, P = 0.0049). However, none of the associations is consistently observed across genotypes. Moreover, none of the analyzed SNP is a good candidate to involve a functional change, at least at a structural level. Finally, there is consistent evidence that in ruminants ME1 has a limited role in the generation of reductor power for lipogenesis. This contrasts strongly with pigs, where ME1 is deeply involved in lipid synthesis and significant associations between ME1 genotype and backfat thickness have been observed (Vidal et al., Reference Vidal, Varona, Oliver, Noguera, Sànchez and Amills2006). The seemingly ancillary role of ME1 in ruminant lipogenesis is difficult to reconcile with several observations showing that this gene is highly expressed in ovine lipogenic tissues (Stefos et al., Reference Stefos, Argyrokastritis, Bizelis and Rogdakis2008), such as fat and mammary gland, and that its expression/activity levels are modified in response to dietary lipid supplementation (Bernard et al., Reference Bernard, Rouel, Leroux, Ferlay, Faulconnier, Legrand and Chilliard2005; Stefos et al., Reference Stefos, Argyrokastritis, Bizelis and Rogdakis2008). More studies will be needed to define precisely the involvement of this enzyme in the synthesis of lipids in ruminants as well as to identify additional polymorphisms in the caprine ME1 gene with detectable effects on milk composition. This latter information would be particularly useful in the implementation of marker-assisted selection schemes devoted to improve the nutritional quality of goat milk.
Acknowledgments
This research was funded by projects AGL2007-66161-C02-01 and AGL2007-66161-C02-02. AZ received fellowships of the Spanish Agency of International Cooperation and Development and of the Centre for Agrigenomics Research. Part of the typing tasks were performed at the Centro Nacional de Genotipado (Santiago de Compostela, Spain).