

INTRODUCTION
Early Holocene cold events (e.g., the 8.2 ka event) have long intrigued scientists because they represent significant exceptions to the fairly stable Holocene climate (Alley et al., Reference Alley, Mayewski, Sowers, Stuiver, Taylor and Clark1997; Alley and Ágústsdóttir, Reference Alley and Ágústsdóttir2005). Several studies have analyzed late Holocene cooling events, because historical evidence clearly demonstrates their considerable influence on human societies despite their relatively small-scale variation. For example, during the Little Ice Age, the most recent of these events, various regions suffered climate extremes and crop failures under only 1–2°C of cooling (e.g., Fagan, Reference Fagan2000). Another well-known event at ~4200 cal yr BP has been suggested to have initiated the collapse of ancient civilizations (Cullen et al., Reference Cullen, Hemming, Hemming, Brown, Guilderson and Sirocko2000; Liu and Feng, Reference Liu and Feng2012; Dixit et al., Reference Dixit, Hodell and Petrie2014).
The exact mechanism of Holocene cooling remains unclarified. It has been suggested that meltwater inputs reduced the sea surface density over the North Atlantic and hindered deep water formation (e.g., Clark et al., Reference Clark, Marshall, Clarke, Hostetler, Licciardi and Teller2001), and early Holocene cold relapses were presumably triggered by meltwater pulses from proglacial lakes (Barber et al., Reference Barber, Dyke, Hillaire-Marcel, Jennings, Andrews, Kerwin, Bilodeau, McNeely, Southon and Morehead1999; Teller et al., Reference Teller, Leverington and Mann2002). There are concerns that the present human-induced warming and accelerating melting of the Greenland Ice Sheet could create a similar cooling state in the Northern Hemisphere (NH) (Rahmstorf et al., Reference Rahmstorf, Feulner, Mann, Robinson, Rutherford and Schaffernicht2015; Srokosz and Bryden, Reference Srokosz and Bryden2015). However, the late Holocene cooling events seem to have been driven by somewhat different mechanisms. An increase in North Atlantic Arctic drift ice, possibly arising from decreased solar forcing, has been suggested as a possible trigger (e.g., Bond et al., Reference Bond, Kromer, Beer, Muscheler, Evans, Showers, Hoffmann, Lotti-Bond, Hajdas and Bonani2001). The subsequent dilution of surface waters may have led to a weakening of the Atlantic meridional overturning circulation and cooling of the NH.
Chinese oxygen-18 (δ18O) cave speleothem records suggest that the Holocene Asian monsoon was linked to the North Atlantic climate (Wang et al., Reference Wang, Cheng, Edwards, He, Kong, An, Wu, Kelly, Dykoski and Li2005; Hu et al., Reference Hu, Henderson, Huang, Xie, Sun and Johnson2008). However, it is unlikely that the entire East Asian region had a strong climate linkage with the North Atlantic. According to recent paleoclimate studies (Park et al., Reference Park, Shin and Byrne2016, Reference Park, Han, Jin, Bahk and Yi2017), there was a substantial difference between late Holocene hydroclimate variation in inland East Asia and coastal East Asia (i.e., eastern China, Japan, Korea, and so forth), where the latter was influenced more by variation in tropical Pacific sea surface temperatures (SSTs) than North Atlantic climate change. Therefore, it is not appropriate to use δ18O cave speleothem records from inland China when discussing climate change in coastal East Asia. However, the lack of high-resolution records from coastal East Asia limits our ability to determine whether abrupt cold events existed in this region and, if so, their mechanisms. Moreover, the high number of large metropolitan areas on the coast of East Asia that are highly vulnerable to climate change (McGranahan et al., Reference McGranahan, Balk and Anderson2007) emphasizes the need for detailed paleoclimate information.
Here, we present a multiproxy record using pollen, magnetic susceptibility (MS), carbon isotopic composition (δ13C), carbon/nitrogen ratio (C/N), and particle size of mid- to late Holocene environmental changes based on a sediment core from the Pomaeho lagoon on the east coast of Korea. Recently, diatom records have been produced from the same site to explore changes in relative sea level and local precipitation (Katsuki et al., Reference Katsuki, Nakanishi, Lim and Nahm2017). In this study, we investigate abrupt cooling events during the mid- to late Holocene and their possible impacts on ancient human societies. Several studies of coastal East Asia have reported on a 4.2 ka climate deterioration and associated cultural response (Yasuda et al., Reference Yasuda, Fujiki, Nasu, Kato, Morita, Mori, Kanehara, Toyama, Yano and Okuno2004; Kawahata et al., Reference Kawahata, Yamamoto, Ohkushi, Yokoyama, Kimoto, Ohshima and Matsuzaki2009; Liu and Feng, Reference Liu and Feng2012; Innes et al., Reference Innes, Zong, Wang and Chen2014). We present new proxy data with a better temporal resolution that enabled the clear identification of this event. This study aims to reconstruct vegetation and climate change in Korea during the mid- to late Holocene, identify abrupt cooling events (e.g., the 4.2 ka event) and examine the causative mechanisms, and explore the influences of such events on human societies.
STUDY AREA
Lake Pomaeho (37°56.98′N, 128°46.12′E) is located in Yangyang County, Gangwon Province, on the central east coast of the Korean Peninsula (Fig. 1). It is one of several coastal lagoons located on the east coast and is fed by two small rivers. However, the lake was reclaimed in the 1920s and has been mostly converted into rice paddies, and the surface area has decreased by half. It has a shoreline circumference of 2.16 km, a catchment area of 8.77 km2, and an average annual depth of 1–2 m (Yoon et al., Reference Yoon, Hwang, Park, Kim and Moon2008b). The lagoon and sea are separated by a ~300 m wide sandbar. There is a small channel that seasonally connects the lagoon with the sea.
(color online) (a) Location of the coring site, Pomaeho lagoon, Korea. The map was modified from the UNAVCO Jules Verne Voyager (UNAVCO Inc.; jules.unavco.org) based on Generic Mapping Tools (GMT-5; gmt.soest.hawaii.edu). (b) Archaeological sites from which the radiocarbon dates used in this study were reported (1, Sacheon-ri; 2, Cheoltong-ri; 3, Munam-ri; 4, Joyang-dong; 5, Gapyeong-ri; 6, Songjeon-ri; 7, Osan-ri; 8, Jigyeong-ri; 9, Bangnae-ri; 10, Chodang-dong; 11, Gyo-dong). (c) Coring location. The image was generated using Google Earth (www.google.co.kr/intl/ko/earth/).

The study area lies on the western edge of the East Sea (Sea of Japan), a semienclosed marginal sea. Today, the main oceanic water flow into the East Sea is the Tsushima Warm Current, a branch of the Kuroshio Current that originates in subtropical North Pacific waters. However, the study area is also affected by the cold Liman Current that flows from the northeast. On the landward side, Lake Pomaeho sits on the edge of the Yeongdong region of Korea, a thin coastal plain that is bordered by the East Sea to the east and the Taebaek Mountains to the west.
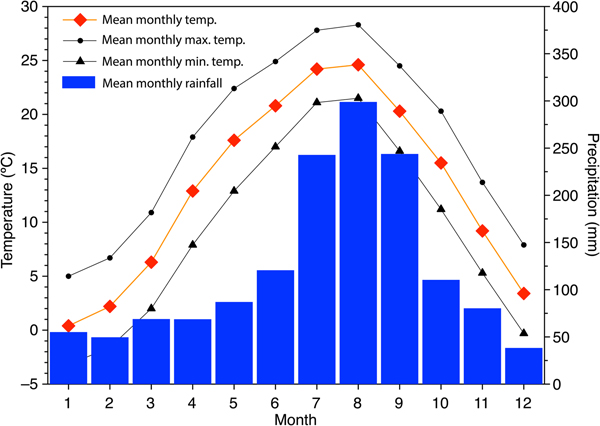
Korea has four distinct seasons, with a large difference between the coldest and warmest months. It lies in the East Asian monsoon (EAM) belt, and the EAM is the dominant factor influencing the climate in this region. Although the Korean Peninsula generally has a continental climate with hot summers and dry winters, the study area is relatively cool in summer and warm in winter because of the oceanic influence. The Taebaek Mountains, increasing to an altitude of more than 1500 m, block the northwest monsoon and create foehn winds that maintain a relatively high winter temperature in the study area. The cold season has an average temperature of ~6°C between December and March, whereas the warm season has an average temperature of ~22°C between June and September. The average precipitation in the area is approximately 1460 mm, with the heaviest rainfall occurring during August (Fig. 2). During the summer rainy season (June–September), precipitation averages ~900 mm, accounting for ~60% of annual precipitation in the area (Korea Meteorological Administration, 2018).
(Color online) Climate data for the study area (Gangneung weather station; 37°45.09′N, 128°53.46′E; 26 m altitude).

The potential vegetation in the study area is categorized as cool temperate forest and mainly consists of Quercus mongolica, Q. serrata, Abies holophylla, and Carpinus laxiflora (Yim, Reference Yim1977). However, human disturbance has led to the dominance of Pinus densiflora in uncultivated areas. In the neighboring mountainous Odaesan National Park, Q. serrata, P. densiflora, Lindera obtusiloba, and Rhus trichocarpa are common species below 700 m. Between 700 and 900 m, C. laxiflora, Acer mono, Fraxinus rhynchophylla, F. mandshurica, Prunus sargentii, and Euonymus oxyphyllus are important species. Finally, the high altitudinal zone (>1000 m) is commonly occupied by cold-resistant trees such as P. koraiensis, Q. mongolica, Acer pseudosieboldianum, Tilia amurensis, A. holophylla, C. cordata, Betula costata, and Kalopanax pictus (Yu et al., Reference Yu, Lee and Kwon2003).
MATERIALS AND METHODS
For this study, a 12-m-long sediment core in 1-m sections was taken from the north side of Lake Pomaeho in the center of a farm access road using a hydraulic coring machine. The core was taken to the cold room at the physical geography laboratory at the Department of Geography, Seoul National University, for storage. It was divided into two halves, with one half archived and the other cut into 1-cm slices for analysis. The top 4.8 m of sediment was not considered for investigation because it mostly consisted of clastic material and sand used to build the access road where the core was drilled. The bottom 7.2 m of sediment analyzed in this study consisted of dark, organic mud interspersed with indistinct gray layers.
Radiocarbon chronology was established by accelerator mass spectrometry dating of nine bulk sediment samples, one piece of woody plant material, and four shell fragments at Beta Analytic and the Korea Institute of Geoscience and Mineral Resources (Table 1). We calibrated the bulk sediment and shell radiocarbon dates using the Marine13 data set and the plant date using the IntCal13 data set (Reimer et al., Reference Reimer, Bard, Bayliss, Beck, Blackwell, Bronk Ramsey, Buck, Cheng, Edwards and Friedrich2013), and developed a Bayesian age-depth model using Bacon v. 2.2 software (Blaauw and Christen, Reference Blaauw and Christen2011).
Radiocarbon dates for Pomaeho sediments. Calibration was carried out with Bacon 2.2 software (Blaauw and Christen, Reference Blaauw and Christen2011).

The organic content was determined at 4-cm intervals by oven combustion of samples at 550°C for 1 h. The MS of the sediment samples was measured at 1-cm intervals using an MS2 magnetic susceptibility system (Bartington Instruments, Witney, UK) while in the original coring tubes. Grain size (ϕ) was measured at 4-cm intervals using a laser diffraction particle size analyzer (LS230; Beckman Coulter). For the latter analysis, a 200-mg sample was treated with 20% hydrogen peroxide in a hot water bath at 60°C for 1 day to remove organic matter.
A total of 116 samples were taken for pollen analysis at intervals of 3–10 cm. Pollen was extracted using standard palynological procedures (Faegri and Iversen, Reference Faegri and Iversen1989). The samples were successively treated with HCl, KOH, HF, and acetolysis solution and sieved through 180 and 10-μm mesh filters to remove large organic debris and fine fractions after KOH treatment. The smallest pollen found in Korea is usually Castanea, which has a short-axis length of 10–16 μm, whereas the largest is Abies with a long-axis length of 110–150 μm (Chang, Reference Chang1986). Therefore, there was little chance of losing pollen grains during the sieving process. Pollen counts were performed under a Leica microscope with a 40× objective at a total magnification of 400×. A minimum of 300 pollen grains were counted on each slide; however, eight samples (516 cm, 572 cm, 628 cm, 636 cm, 668 cm, 698 cm, 838 cm, and 1170 cm) lacked sufficient pollen concentrations to permit counting to 300. In these samples, a minimum of 100 pollen grains was counted.
A pollen diagram was produced using Tilia software (Grimm, Reference Grimm1987). Pollen concentrations were calculated based on the ratios of Lycopodium spores added to the preparations (Stockmarr, Reference Stockmarr1971). The total sum of nonaquatic pollen and spores was used as the basis to calculate the percentages shown in the pollen diagram. Stratigraphically constrained cluster analyses were conducted based on the percentages of nonaquatic taxa using CONISS, and two stratigraphic zones were delineated. In addition, the arboreal pollen/total pollen (AP/T) and Quercus/Pinus ratios were calculated to simplify the interpretation of the pollen records.
We took additional samples at the same depths used for the pollen analysis for the isotopic and elemental analyses. These samples were treated with 5% HCl to remove carbonates before the analysis. Total organic carbon and total nitrogen were measured using a Flash EA 2000 element analyzer (Thermo Scientific) to calculate the C/N ratio. The carbon isotope ratio in the organic sediment was determined using a GV IsoPrime mass spectrometer (GV Instruments) at the Korea Basic Science Institute. Replicate analyses of the samples gave a precision of less than ± 0.2‰.
To assess the influence of climatic changes on population and settlements, we collated 61 radiocarbon dates obtained from 11 archaeological sites located within a 100 km radius of Pomaeho lagoon and along the eastern coast of the Korean Peninsula (Fig. 1b). Radiocarbon dates were available for pit houses, underground pits, outdoor hearths, and layers. We only considered the dates from pit houses based on the assumption that residentially sedentary settlements would leave remains of permanent dwelling features, such as pit houses. Radiocarbon dates associated with large standard errors (>100 yr) were excluded from the analysis. To facilitate the comparison, the dates were assembled to produce a summed probability distribution (SPD) for the period of 7000–2600 cal yr BP. The SPD graph was generated using OxCal v. 4.3.2, and the radiocarbon dates were calibrated using the IntCal13 calibration curve (Reimer et al., Reference Reimer, Bard, Bayliss, Beck, Blackwell, Bronk Ramsey, Buck, Cheng, Edwards and Friedrich2013; Bronk Ramsey, Reference Bronk Ramsey2017).
RESULTS AND DISCUSSION
Chronology and stratigraphy
In total, 14 radiocarbon dates were obtained from the Pomaeho sediment core (Table 1, Fig. 3a). However, four dates were rejected by Bacon v. 2.2 as outliers. Two shell dates at depths of 831 cm and 871 cm were too young given their locations, possibly because of deep burrowing by the gastropods (Lacuna sp.) whose shells were analyzed. Similar calibration dates from terrestrial and marine materials at 1184 cm indicated that the marine dates were calibrated well, even without local marine reservoir correction (Table 1). Local correction values have not yet been clearly determined for the East Sea (Nakanishi et al., Reference Nakanishi, Hong, Sung, Nakashima, Nahm, Lim and Katsuki2017), but they appeared to be close to zero in this study.
(Color online) (a) Pomaeho sediment core age depth profile. The age probability distributions are plotted in light red for the shell samples, light blue for the bulk sediment samples, and light green for the wood sample. Note that the wood and bulk sediment dates from 1184 cm depth overlap completely. The best age model (red dotted line) with a 95% confidence interval (gray dotted line) was established based on Bayesian principles using Bacon v. 2.2 (Blaauw and Christen, Reference Blaauw and Christen2011). (b) Stratigraphy of the core. Pomaeho sediment grain size (c), sedimentation rates (d), magnetic susceptibility (MS) (e), and C/N ratio (f).

As mentioned earlier, the upper section of the Pomaeho sediment core consisted of materials used as fill to reclaim the lagoon. Therefore, only the lower section of the core (1200–480 cm depth) was analyzed in this study. In general, its visual lithology did not show marked changes in color or texture (Fig. 3b). However, between a depth of 1200 cm and 1100 cm, it was characterized by alternating dark and light bands (1–3 cm thick). In general, the light bands consisted mainly of sands or coarse silts with relatively high MS values, whereas the dark bands consisted of relatively fine silts (Fig. 3c and e). The light bands indicate that coarse marine sediments were repeatedly deposited at the site. The Holocene sea-level high stand reportedly formed since ~7000 cal yr BP along Japanese coasts (Tanigawa et al., Reference Tanigawa, Hyodo and Sato2013; Chiba et al., Reference Chiba, Sugihara, Matsushima, Arai and Endo2016) and along the east coast of China (Zong, Reference Zong2004; Li et al., Reference Li, Li, Liu, Qiao, Ma, Xu and Yang2014). Thus, stabilization of sea level probably led to wave-induced retreat of a sandbar from 6600 cal yr BP to 5300 cal yr BP in the study area. Such a landward retreat is supported by a gradual increase in sediment particle size (i.e., a decrease in ϕ values) (Fig. 3c).
The sediments between 1000 cm and 900 cm, interspersed with a few thin light layers, contained relatively more organic matter than the lower and upper sections. Relatively deep lacustrine conditions seem to have occurred because of the elongation of a sandbar during the corresponding period (4000–2600 cal yr BP), as indicated by increasing ϕ values and thin layers (Fig. 3b and c). The latter, reflecting weak bioturbation, may have been formed by terrestrial flooding events, rather than marine transgressions, in summer given the minimal change in MS values.
Homogenous dark gray silts interspersed with intact shells from 900 cm to 480 cm imply that the lake became shallower with more oxic bottom water conditions. In addition, a rapid increase in sedimentation rates and mean grain size from 900 cm indicates that the study area has been disturbed by human activity since 2600 cal yr BP (Fig. 3d). Shallow lake conditions and human-induced eutrophication may have led to an increased algal density as reflected by a rapid decline in the C/N ratio (Fig. 3f). Marine algae generally have C/N ratios <10 (Meyers, Reference Meyers1994), whereas terrestrial C3 vegetation usually has C/N ratios >12 (Prahl et al., Reference Prahl, Bennett and Carpenter1980).
However, in general, human disturbances do not seem to have been substantial in the study area given the low sedimentation rates after 2000 cal yr BP and a steady decline in erosion-indicating MS values, despite human activity. By contrast, other studies from neighboring lagoons have suggested that agricultural disturbances intensified after ~2000 cal yr BP in the central area of the east coast (Fujiki and Yasuda, Reference Fujiki and Yasuda2004; Park and Shin, Reference Park and Shin2012; Park et al., Reference Park, Yu, Lim and Shin2012). This unexpected discrepancy may have been because of the relatively small amount of arable land surrounding the Pomaeho lagoon.
Vegetation and climate change since ~7000 cal yr BP
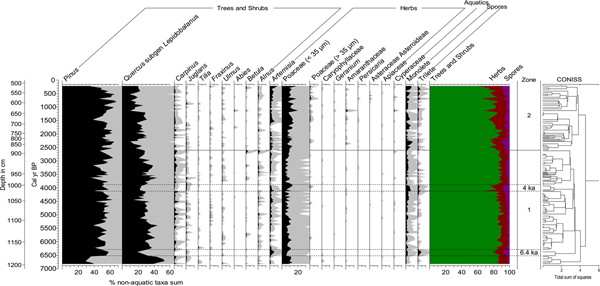
For convenience, the pollen diagrams were divided into two zones based on the clustering results (Fig. 4). The first zone is characterized by consistently high percentages of Pinus and Quercus, which indicate that dense temperate forests were maintained by relatively mild and wet conditions from 7000 to 2600 cal yr BP. Although total arboreal pollen percentages do not vary substantially throughout zone 1, a gradual increase in the frequency of Pinus and the opposite trend in Quercus reflect an orbitally driven insolation change (i.e., decreasing NH insolation) from the mid-Holocene. The weakening of the East Asian summer monsoon (EASM) may have caused pines, which tolerate site dryness better than oaks, to occupy a favorable position in competition. In addition, there were several minor but noticeable changes in pollen assemblage data at 6400 cal yr BP and 4000 cal yr BP, reflecting drying and/or cooling of the study area. These discrepancies deserve careful attention, because similar climate deteriorations at the same time periods have been demonstrated frequently using various records (Mayewski et al., Reference Mayewski, Rohling, Stager, Karlén, Maasch, Meeker, Meyerson, Gasse, van Kreveld and Holmgren2004; Wanner et al., Reference Wanner, Solomina, Grosjean, Ritz and Jetel2011), and a more detailed discussion is provided in the next section.
(color online) Selected pollen taxa from Pomaeho sediments. All percentages are based on the total nonaquatic taxa sum.

An overall decline in arboreal taxa and an increase in herbaceous plant frequencies in zone 2 indicate that human disturbance of vegetation began around 2600 cal yr BP in the study area. However, as noted earlier, the anthropogenic impact on the surrounding vegetation was nearly negligible given the relatively minor changes in pollen assemblages. For example, Pinus and fern spores indicative of disturbance do not increase substantially. Although a slight increase in agricultural indicators such as Poaceae, Artemisia, and Amaranthaceae somewhat reflects the presence of small-scale cultivation around the site, such minor disturbances have not been reported in investigations of late Holocene environmental changes on the east coast (e.g., Fujiki and Yasuda, Reference Fujiki and Yasuda2004; Yoon et al., Reference Yoon, Moon and Hwang2008a).
Abrupt climate events and their underlying causes
Many paleoclimatologists have long been interested in the abrupt short-term cold events that interrupted the stable and warm Holocene on a multicentennial scale. In the Pomaeho proxy records, such events were evident around 6400 cal yr BP and 4000 cal yr BP (Figs. 4 and 5). The distinct decline in Quercus and Carpinus implies that climatic climax trees in the study area suffered severely from rapid climate deterioration. Their flowering and, hence, pollen production were probably depressed by cool temperatures or dryness (Faegri and Iversen, Reference Faegri and Iversen1989). Abrupt climate shifts might also have increased tree susceptibility to infectious disease (e.g., Parker et al., Reference Parker, Goudie, Anderson, Robinson and Bonsall2002). This forest disturbance is also indicated by a marked decrease in organic content, pollen concentrations, AP/T ratios, and Quercus/Pinus ratios and an increase in δ13C values (Fig. 5). The latter is likely associated with an increase in the relative percentage of upland C4 Poaceae, as shown in the pollen records. Plants that use the C4 pathway of photosynthesis generally produce organic matter with much higher δ13C values than C3 plants, which strongly discriminate against 13C (Bender, Reference Bender1971; Farquhar et al., Reference Farquhar, Ehleringer and Hubick1989).
(Color online) Pomaeho multiproxy data over the investigated period. The pollen concentration and Quercus/Pinus ratio are plotted on log scales. Drying/cooling events are indicated by light blue boxes, and the presence of human disturbance is indicated by a brown box. AP/T, arboreal/total pollen ratios; VPDB, Vienna Pee Dee belemnite.

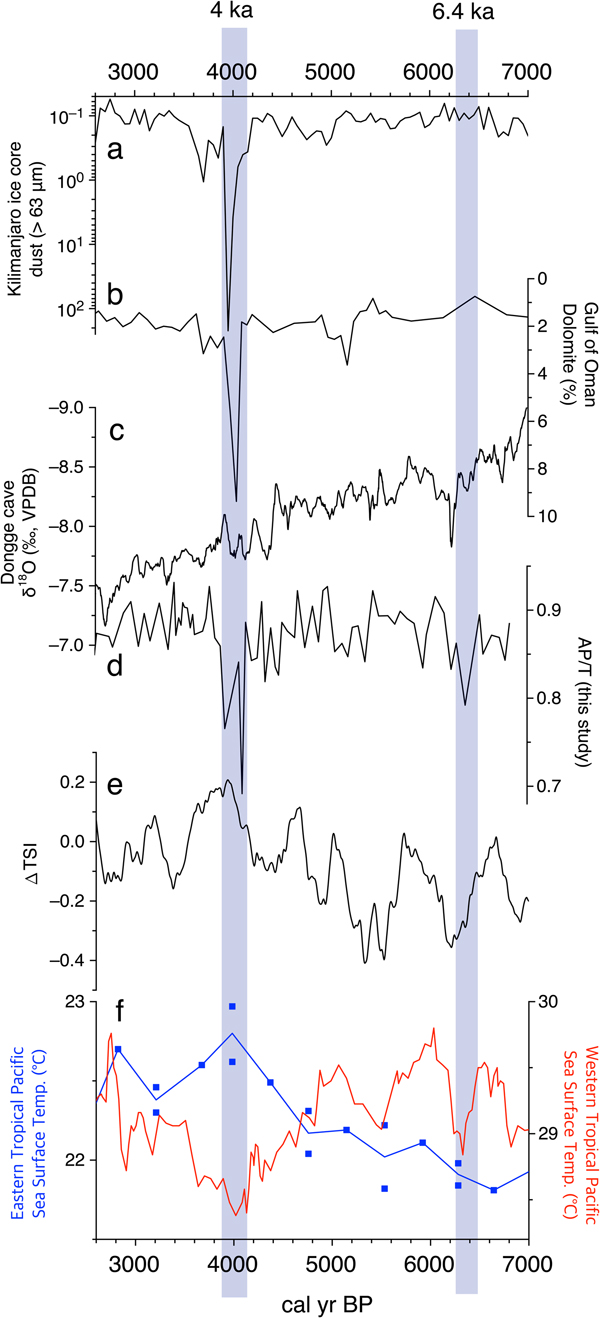
The EASM is believed to have weakened during these cold events because of a cooling of the North Atlantic region and a southward migration of the Intertropical Convergence Zone (ITCZ) (Wang et al., Reference Wang, Cheng, Edwards, He, Kong, An, Wu, Kelly, Dykoski and Li2005). However, the mechanisms behind these abrupt climate events in the study area were complex, and the variation in tropical Pacific SSTs, another significant control, should be examined carefully to determine Holocene climate changes in East Asia, in particular coastal East Asia. From this perspective, the 6400 cal yr BP and 4000 cal yr BP events, driven by seemingly different mechanisms, should be discussed separately. The former event is believed to have been predominantly attributable to weak solar activity (Fig. 6e), although its mechanisms are not thoroughly understood (Wanner et al., Reference Wanner, Solomina, Grosjean, Ritz and Jetel2011, Reference Wanner, Mercolli, Grosjean and Ritz2015). According to speleothem δ18O records from several Chinese caves, strong dryness occurred around 6400 cal yr BP in East Asia (Wang et al., Reference Wang, Cheng, Edwards, He, Kong, An, Wu, Kelly, Dykoski and Li2005; Hu et al., Reference Hu, Henderson, Huang, Xie, Sun and Johnson2008) (Fig. 6c). As the decline in solar output led to the southward movement of the ITCZ and East Asian rain belts, summer precipitation presumably decreased in the study area.
(Color online) Comparison of dust records from a Mt. Kilimanjaro ice core (Thompson et al., Reference Thompson, Mosley-Thompson, Davis, Henderson, Brecher, Zagorodnov, Mashiotta, Lin, Mikhalenko and Hardy2002) (a), aerial dolomite records from the Gulf of Oman (Cullen et al., Reference Cullen, Hemming, Hemming, Brown, Guilderson and Sirocko2000) (b), Dongge Cave stalagmite δ18O data (Wang et al., Reference Wang, Cheng, Edwards, He, Kong, An, Wu, Kelly, Dykoski and Li2005) (c), arboreal/total pollen ratios (AP/T) in this study (d), total solar irradiance (TSI) (Steinhilber et al., Reference Steinhilber, Beer and Fröhlich2009) (e), and reconstructed tropical Pacific sea surface temperatures (Stott et al., Reference Stott, Cannariato, Thunell, Haug, Koutavas and Lund2004; Koutavas et al., Reference Koutavas, Olive and Lynch-Stieglitz2006) (f). Drying/cooling events are indicated by light blue boxes. VPDB, Vienna Pee Dee belemnite.

The later drying at 4000 cal yr BP (i.e., the 4.2 ka event) is notable because it has been suggested as one of the main culprits behind the cultural collapse of ancient civilizations such as the Old Kingdom in Egypt (Stanley et al., Reference Stanley, Krom, Cliff and Woodward2003), the Akkadian Empire in Mesopotamia (Cullen et al., Reference Cullen, Hemming, Hemming, Brown, Guilderson and Sirocko2000), Chinese Neolithic cultures (Liu and Feng, Reference Liu and Feng2012), and the Indus civilization (Dixit et al., Reference Dixit, Hodell and Petrie2014). However, only a few high-resolution records have clearly shown the 4000 cal yr BP event (e.g., Cullen et al., Reference Cullen, Hemming, Hemming, Brown, Guilderson and Sirocko2000; Thompson et al., Reference Thompson, Mosley-Thompson, Davis, Henderson, Brecher, Zagorodnov, Mashiotta, Lin, Mikhalenko and Hardy2002; MacDonald et al., Reference MacDonald, Moser, Bloom, Potito, Porinchu, Holmquist, Hughes and Kremenetski2016), despite the great interest in this abrupt cooling event among paleoclimatologists and archaeologists. The AP/T decline at 4000 cal yr BP observed in our pollen records was indicative of significant drying and corresponded well with increased dust deposition in the Gulf of Oman (Cullen et al., Reference Cullen, Hemming, Hemming, Brown, Guilderson and Sirocko2000) and on Mt. Kilimanjaro (Thompson et al., Reference Thompson, Mosley-Thompson, Davis, Henderson, Brecher, Zagorodnov, Mashiotta, Lin, Mikhalenko and Hardy2002), reflecting a robust climate teleconnection between these regions (Fig. 6a and b).
Given the increase in solar output around 4000 cal yr BP (Fig. 6e), the drying in the study area did not likely arise from solar variation, but rather from variability in tropical Pacific SSTs. According to SST reconstructions, the eastern tropical Pacific was relatively warm at ~4000 cal yr BP (Koutavas et al., Reference Koutavas, Olive and Lynch-Stieglitz2006), whereas the western tropical Pacific was relatively cool (Stott et al., Reference Stott, Cannariato, Thunell, Haug, Koutavas and Lund2004) (Fig. 6f). Such conditions presumably led to strong El Niño–like conditions. Recent paleoclimate studies have suggested that more (less) frequent El Niño events generally tended to result in less (more) typhoon-related precipitation over coastal East Asia during the late Holocene (Park et al., Reference Park, Shin and Byrne2016, Reference Park, Han, Jin, Bahk and Yi2017). Therefore, the short-term forest decline at 4000 cal yr BP in the study area was most likely caused by the predominance of El Niño–like conditions.
By contrast, Chinese speleothem δ18O records do not show any marked dryness at 4000 cal yr BP (Wang et al., Reference Wang, Cheng, Edwards, He, Kong, An, Wu, Kelly, Dykoski and Li2005; Hu et al., Reference Hu, Henderson, Huang, Xie, Sun and Johnson2008) (Fig. 6c). This inconsistency may be the result of different drivers of late Holocene climate variation between inland China and coastal East Asia. The latter was significantly influenced by oceanic–atmospheric circulation changes in the western Pacific (Lim and Fujiki, Reference Lim and Fujiki2011; Park, Reference Park2017; Park et al., Reference Park2017), whereas the former was influenced by changes in the North Atlantic (Wang et al., Reference Wang, Cheng, Edwards, He, Kong, An, Wu, Kelly, Dykoski and Li2005). The increase in El Niño–Southern Oscillation (ENSO) activity from ~5000 cal yr BP (Moy et al., Reference Moy, Seltzer, Rodbell and Anderson2002; Conroy et al., Reference Conroy, Overpeck, Cole, Shanahan and Steinitz-Kannan2008), possibly attributable to the orbital decline in NH insolation during the late Holocene (Donders et al., Reference Donders, Wagner-Cremer and Visscher2008), may explain the presence of different climatic mechanisms between the two regions.
Cultural response to abrupt cooling events in Korea
The SPD of radiocarbon dates indicates that human occupation in the study area was far from continuous during the period 7000–2600 cal yr BP (Fig. 7d). The distribution of the assembled dates was punctuated by several hiatuses, suggestive of population decreases and/or relocations. The radiocarbon dates from the pit houses tend to cluster at a few temporal points, most conspicuously between 5600 and 4450 cal yr BP. By contrast, three time points are notable with a paucity or lack of corresponding dates, which roughly corresponded to 6400 cal yr BP, 4400 cal yr BP, and 4000 cal yr BP.
(Color online) Comparison of the arboreal/total pollen ratios (AP/T) in this study (a), Quercus/Pinus ratio percentages in this study (b), reconstructed tropical Pacific sea surface temperatures (c), and summed probability distribution of radiocarbon dates (d). Drying/cooling events are indicated by light blue boxes.

In total, 14 radiocarbon dates predating 6400 cal yr BP exclusively came from two settlements: Osan-ri and Munam-ri (Fig. 1b). These sites are located 50 km and 20 km north of Pomaeho lagoon, respectively, and signal the beginning of Holocene settlements in the region (Ko, Reference Ko2012). Osan-ri has 17 pit houses, 13 of which predate 6400 cal yr BP (Ko and Hong, Reference Ko and Hong2007). Munam-ri has 12 pit houses, four of which predate 6400 cal yr BP (Kunikida and Yoshida, Reference Kunikida and Yoshida2007; National Research Institute of Cultural Heritage, 2014). Human occupation in the region was not continuous after these sites were abandoned (Fig. 7d), and there was a long hiatus of approximately 800 yr in the assembled radiocarbon dates. There is currently no archaeological evidence for the presence of sedentary settlements during this time span. The truncated development of the earliest settlements temporally corresponds to the aforementioned cooling/drying episode.
New villages started to emerge after 5600 cal yr BP, as indicated by the heavy concentration of radiocarbon dates. In total, seven settlements could be assigned to the period 5600–4450 cal yr BP based on 37 radiocarbon dates: Cheoltong-ri, Munam-ri, Gapyeong-ri, Songjeon-ri, Osan-ri, Jigyeong-ri, and Chodang-dong (Fig. 1b). These sites consist of 2 to 10 pit houses and, except the sites of Osan-ri and Munam-ri, they newly appeared during this period. There is no material evidence suggestive of human presence at these locations before 5600 cal yr BP. The region witnessed the burgeoning of new settlements; however, most disappeared by 4450 cal yr BP and completely by 4000 cal yr BP.
The cessation of occupation at these settlements was possibly driven by ENSO-related drying that reduced the dominance of oak trees in the study area (Fig. 7). The marked reduction in AP/T values at 4000 cal yr BP possibly indicated that this dryness maximum in the study area was triggered by strong El Niño–like conditions. A sediment study from eastern China recently suggested that an abrupt 4.4 ka climate change caused a significant shift in ancient societies—for example, Dawenkou culture to Longshan culture (Wang et al., Reference Wang, Sun, Chen, Xu, Wang and Wang2016). It has also been suggested that human societies in Japan and China were substantially influenced by the 4 ka cooling event (Zhang et al., Reference Zhang, Zhu, Liu and Jiang2005; Kawahata et al., Reference Kawahata, Yamamoto, Ohkushi, Yokoyama, Kimoto, Ohshima and Matsuzaki2009; Liu and Feng, Reference Liu and Feng2012).
The new settlements (i.e., Sacheon-ri, Joyang-dong, Bangnae-ri, and Gyo-dong) that emerged after the drying event of 4000 cal yr BP differed substantially from the previous settlements in that they were agrarian, and the residents practiced cereal cultivation, particularly rice (Kim and Park, Reference Kim and Park2011). The subsistence economy before 4000 cal yr BP was based on hunting, gathering, and fishing, as well as small-scale cultivation of millet. Acorns (Quercus) and anadromous fish such as salmon (Oncorhynchus) are considered to have been the staple foods of prehistoric populations on the eastern coast of the Korean Peninsula before 4000 cal yr BP (Song, Reference Song2006; Kim and Park, Reference Kim and Park2011). Because the productivity of these wild resources is highly susceptible to climatic and other ecological factors, the cooling and drying trends in 6400 cal yr BP and 4000 cal yr BP likely influenced the lifestyles of these people, leading to population decreases or relocation. The cessation in settlement history appears to be closely related with the climatic events. The climatic deterioration around 4000 cal yr BP was the most detrimental of the events and led to a regional depopulation and immigration of the agricultural population.
The current examination provides new data for evaluating the previously proposed explanations of the so-called Neolithic–Bronze Age transition, or the transition from a foraging to an agrarian subsistence economy. This transition started in the northern part of the Korean Peninsula around 4000 cal yr BP and was completed for the entire peninsula by 3300 cal yr BP (Korean Archaeological Society, 2012). This was a large-scale cultural change that involved the advent of new pottery styles, burials, and subsistence-settlement patterns (Nelson, Reference Nelson1993; Choe and Bale, Reference Choe and Bale2002; Crawford and Lee, Reference Crawford and Lee2003; Ahn, Reference Ahn2010; Kim and Bae, Reference Kim and Bae2010). Researchers agree that an influx of farmers was behind this process, while few of them consider climatic factors in any detail (Kim, Reference Kim2002; Ahn, Reference Ahn2010; Korean Archaeological Society, 2012). The current study shows that there was a climatic change to a cooler and drier condition prior to this transition. Throughout the Korean Peninsula, the population density around 4000 cal yr BP decreased, or people relocated to coasts and islands (Kim et al., Reference Kim, Shin, Kim, Lim, Jo, Ryu, Won, Oh and Noh2015). The exploitation of maritime and littoral resources, which were less vulnerable to seasonal fluctuations, intensified (Norton, Reference Norton2000, Reference Norton2007). The depopulation inland presumably facilitated the immigration of a new population, causing a drastic transition from the Neolithic Age to the Bronze Age.
CONCLUSIONS
The multiproxy records from this study indicate that climate deteriorations around 6400 cal yr BP and 4000 cal yr BP led to changes in vegetation assemblages on the east coast of Korea. The 6400 cal yr BP shift was likely caused by low sunspot activity, whereas the 4000 cal yr BP shift was caused by strong El Niño–like conditions (i.e., relatively high SSTs in the eastern tropical Pacific and low SSTs in the western tropical Pacific). The difference in the underlying mechanisms behind the two cooling events probably arose from the strengthening of ENSO activity after ~5000 cal yr BP. These short-term climate changes had strong influences on both vegetation and ancient societies. There was a marked reduction in local settlements around 6400 cal yr BP, 4400 cal yr BP, and 4000 cal yr BP, when the climate presumably became drier and/or cooler, reflecting population decreases or relocation in the study area driven by the climate events. Highly populated regions such as coastal East Asia are particularly susceptible to potential climate events in the future. Therefore, more efforts are required to produce paleoenvironmental data from this region to enable the prediction and mitigation of negative consequences of future climate change.
ACKNOWLEDGMENTS
This work was supported by the Ministry of Education of the Republic of Korea and the National Research Foundation of Korea (NRF-2018R1D1A1A09083072). We thank the editor and anonymous reviewers for their useful comments and suggestions for improving the manuscript. MC and MK contributed equally to this work.