




No CrossRef data available.
Article contents
Bayesian age-stage modelling of Plasmodium falciparum sequestered parasite loads in severe malaria patients
Published online by Cambridge University Press: 23 August 2004
Abstract
A discrete-time age-stage model is proposed for estimating the number of sequestered parasites in severe malaria patients. A Bayesian Markov chain Monte Carlo (MCMC) approach is used to model the dynamics of Plasmodium falciparum parasitaemia in 107 paediatric patients in a randomized controlled trial of quinine and artemether in Kenya, in whom 4-hourly peripheral parasitaemia determinations were made. The MCMC approach allows the model to be fitted simultaneously to the entire dataset, providing point and interval estimates for both population and individual patient parameters. Analysis of a simulated dataset indicated that the models gave good estimates of the distribution of parasites between different stages on enrolment, for patients with a wide range of initial states. The analysis of the Kenyan patients suggested that there is considerable variation between patients within the same centre, in both the proportion of sequestered parasites and the intrinsic rate of increase of the parasite population in the absence of treatment. The resulting models should prove a useful tool for cross-validating biochemical approaches for estimating the sequestered load.
Keywords
Information
- Type
- Research Article
- Information
- Copyright
- © 2004 Cambridge University Press
INTRODUCTION
The pathology of Plasmodium falciparum malaria is associated with the adherence of late-stage trophozoites and schizonts to endothelia (e.g. Warrell et al. 1990; White & Ho, 1992) and with the release of toxins when schizonts rupture. However, diagnosis of malaria continues to rely mainly on microscopy of peripheral blood smears and there are no methods that can be routinely applied in a clinical setting for estimating the numbers of sequestered parasites, or of rupturing schizonts in a living host.
One approach for estimating the sequestered load is to fit a model to time-series of peripheral parasitaemia assessments. The theoretical dynamics of peripheral parasite densities in untreated individuals are well known (e.g. White, Chapman & Watt, 1992; Fig. 1a). However, data to fit such models are available only from (i) serendipitous clinical trials where a treatment failed (e.g. the 4 patients on ciprofloxacin studied by White et al. (1992); (ii) studies of asymptomatic individuals: these include experimental infections in the pre-clinical growth phase (e.g. Fairley, 1947; Cheng et al. 1997); (iii) semi-immune individuals where treatment is not indicated; (iv) or historical data from neurosyphilis patients (e.g. Collins & Jeffery, 1999).

Fig. 1. Asexual cycle of Plasmodium falciparum and structure of the model. (A) Asexual cycle showing notation used for parasite densities Nk,a,t is the expected density of parasites at stage a at time t in patient k. Note that the dotted line delimiting peripheral and sequestered parasites intentionally cuts the boxes with index 7, since sequestration is assumed to occur while parasites are in this stage. (B) Model for change in numbers of parasites over one 4-h interval. The open boxes give the expected numbers of parasites at time t+1. The term adjacent to the arrows is the multiplying factor that determines how these expected numbers are related to each other.
Severe malaria patients, with closely monitored parasitaemia are the richest source of longitudinal parasitological data with which to estimate sequestered loads. Moreover, the estimation of the sequestered load and the degree of parasite synchronization in such patients could provide important markers of severity since disease severity is thought to be related more to the sequestered than circulating parasite load (White & Ho, 1992; Gravenor, van Hensbroek & Kwiatkowski, 1998; Gravenor et al. 2002). Indeed, Gravenor et al. (1998, 2002) fitted statistical models by maximum likelihood to sequential determinations of parasite densities in a trial of quinine and artemether in The Gambia and found a relationship between the estimated number of sequestered parasites at the start of treatment and the severity of the disease. The models were also consistent with the in vitro findings that quinine is relatively effective in clearing young ring stages and trophozoites, while artemether is also highly active against schizonts (ter Kuile et al. 1993).
We have now implemented an alternative discrete-time approach based on 4-h stages. We have fitted this to 4 hourly peripheral parasitaemia determinations from 107 severe malaria patients treated with either quinine or artemether in a randomized controlled trial in Kilifi, Kenya (Murphy et al. 1996). We use a Bayesian Markov Chain Monte Carlo (MCMC) approach to fit the model, which makes it feasible to estimate some parameters at the level of the individual patient, but within the same fitting process to make population level estimates of other parameters. The uncertainties in the population model are thus taken into account in the estimates of the individual-level parameters. By assuming constant sojourn times in each parasite stage, rather than modelling the flow-rates as proportional to the number of parasites in the stage, the model attains greater realism and generally gives more plausible estimates of total parasite loads than does that of Gravenor et al. (2002). It allows both for stage specificity of drug action and for time delays before drugs become active.
MATERIALS AND METHODS
Patients
The statistical models have been fitted to sequential parasite density data from the trial of Murphy et al. (1996). This was a randomized controlled trial of artemether and quinine for the treatment of cerebral malaria carried out in Kilifi, Kenya. Children admitted to the hospital with coma and P. falciparum parasitaemia were treated with either intramuscular artemether (3·2 mg/kg loading dose followed by 1·6 mg/kg daily) or intravenous quinine (20 mg/kg loading dose followed by 10 mg/kg every 8 h). In total, 160 children satisfied the admission criteria of the trial. Parasite densities in this trial were assessed every 4 h until clearance. The present analyses considered the data from a total of 107 such patients, from whom at least 8 such 4 hourly parasite density determinations were available (Table 1). Of these patients, 53 were treated with quinine and 54 with artemether.
Table 1. Measured and estimated characteristics of patients (Figures in square brackets are the standard deviations.)

Model of parasite dynamics
We divide the 48-h cycle of blood-stage P. falciparum malaria into 4-hourly intervals indexed by a=1 … 12 and denote as Nk,a,t the expected number of parasites in patient k, at the ath stage, at 4-hourly time-point t. We denote the probability of a parasite in patient k, stage a surviving from t to t+1 as Sk,a,t. It follows that:

and

where Rk is the intrinsic rate of increase per asexual cycle. Using these recursive relationships the expected numbers of parasites in each stage at each time-point can be determined, conditional on estimates of Sk,i,t, Rk, and the number of parasites at each stage at baseline, Nk,a,0. It follows that the parasites at each 4-hourly stage, at each time-point, are treated as the survivors and progeny of a cohort of parasites in a given stage at baseline (Fig. 1).
Specification of intrinsic multiplication rate and stage-specific baseline densities
Since severe malaria is indicative of a failure to control parasites, at the start of treatment we expect the parasite population to be growing. If the parasites were completely unsynchronized, and clearance of infected erythrocytes negligible, this would mean that the numbers of parasites at the different stages would on average (considering the whole population of patients, and remembering that we divide the erythrocytic cycle into twelve 4-hourly intervals) be in the ratio:

(For details of the derivation of this formula see the Appendix.)
To model deviations from these relative proportions, the stage distributions of the parasites within each patient at baseline were modelled using a circular function, fk(a), based on the von Mises distribution (Evans, Hastings & Peacock, 2000), comprising an unsynchronized (stage-independent) component (βk), and a synchronized component, where:

ϕ=2πa/12, θk specifies the phase for patient k, and κ determines the width of the peaks. To obtain a proper distribution for the proportions of parasites in each stage, we can divide the product Nk,a,0 fk(a) by the sum over all stages. To convert these proportions to absolute densities we multiply by the total parasite load at baseline,

which is therefore a further parameter of the model i.e.:

Thus, 4 patient-specific parameters, Tk, βk, θk, and Rk are used for each patient (in addition to κ, which is assigned at the level of the patient population) to specify the distribution of the parasites between stages at the start of treatment (see Table 2).

Pharmacodynamics
To model drug-induced parasite death we assume a separate function measuring the stage-specific effect on survival of each of the two drugs (d=1, 2), basing this on published estimates of the relative inhibition of [3H] hypoxanthine incorporation, determined in vitro (ter Kuile et al. 1993) (see Fig. 2A). For each drug we estimate one parameter, Md, corresponding to the maximal inhibition, so that for the most susceptible stage of parasite, in the presence of maximally effective drug concentrations:

Denoting the relative inhibition by drug d of parasites of stage a as ρd,a (where ρd,a varies between 0 and 1), the survival of parasites at other stages in the cycle is:

To allow for the initial delay before drug effects are seen, we assume the same kinetics as those of the inhibition of [3H] hypoxanthine incorporation determined in vitro (ter Kuile et al. 1993), and specify a quantity ωt corresponding to the proportion, at time t, of the maximal inhibitory effect of the drug (see Fig. 2B). Thus, in general, parasite survival is given by:


Fig. 2. Stage- and time-dependence of drug effects. (A) Relative inhibition by stage of parasite. (B) Proportion of maximal effect of drug, by observation time. Pharmacokinetics and pharmacodynamics inferred from the results of ter Kuile et al. (1993). The parameters used in the model correspond to 4-h stage- or time-periods.
Fitting the model to peripheral parasite densities
It follows that, in the reference model the expected number of parasites at stage a, patient k and time-point t, Nk,a,t, is a function of quantities ρd,a and ωt taken from ter Kuile et al. (1993) and the parameters Tk, βk, θk, Md, Rk, and κ to be estimated.
Following White et al. (1992) we assume that parasites are sequestered for rather less than half of the duration of the 48-h cycle and that those in the first six 4-h stages, and half those in the 24 to 28-h stage are in the peripheral circulation. The expected number of parasites observed in 1 μl of peripheral blood at any time-point t, Pk,t is therefore given by:

We specify prior distributions for each of the parameters as indicated in Table 2.
To achieve approximate homogeneity of variances, we used a square-root transformation of both the observed and predicted densities (Xk,t and Pk,t respectively) and estimate the model using WinBugs v1.4 (Spiegelhalter et al. 2000), assuming normal errors. To provide estimates of the fit of the model, separately for the two drugs, the error variance, σd2, was allowed to differ between quinine-treated patients (d=1) and those treated with artemether (d=2), i.e.

The program uses the Metropolis-Hastings algorithm to obtain posterior distributions for the parameters. Convergence was monitored using the program CODA (Best, Cowles & Vines, 1996) using Heidelberger and Welch tests (Heidelberger & Welch, 1983).
The models were also evaluated in terms of whether the estimated overall parasite density was plausible. We consider a density of approximately 2×10⁶ parasites per μl to represent an approximate upper limit consistent with the patient still being alive, and therefore reject any models that give estimates outside this range for many of the patients.
Simulations
In addition to the analysis of the patients from the study of Murphy et al. (1996), a simulated dataset was analysed to evaluate the performance of the model when Nk,a,0 is known. This dataset, like that of Murphy et al. (1996), comprised 54 series simulated by assuming the pharmacodynamics to follow those of quinine, and 53 assuming the pharmacodynamics of artemether. A subset for each drug, covering the full range of Rk from 1 to 16 were simulated assuming the parasites to be completely unsynchronized (i.e. following equation (1.3)). Other simulated patients had highly synchronized parasite populations, or densities randomly assigned to the 12 stage categories. The parasitological monitoring of the simulated dataset was assumed to be equivalent to that of Murphy et al. (1996).
RESULTS
The patients included in the analysis for the two drugs had similar parasite densities at baseline, and similar follow-up periods (Table 1). However, the requirement that at least 8 slides could be analysed introduced a small bias due to exclusion of relatively low density artemether patients whose parasitaemia had cleared very quickly.
We initially attempted to simultaneously estimate Tk, βk, θk, Md, Rk, and κ for all 107 patients. All the parameters proved to be identifiable except for κ. When this parameter was given a non-informative prior, the estimate tended towards very high values, corresponding to the limiting case of highly synchronized parasite populations. Such models gave implausibly high total parasite load (Tk) estimates for many of the patients and formal convergence criteria could not be satisfied because of numerical overflows during the fitting process. Models with moderately high values of κ, fitted better than those with lower values, and so the remaining parameters were assigned conditional on a moderately high value of κ=10·0.
This model gave an excellent fit to the data for most of the 107 patients, despite widely differing observed clearance rates of peripheral parasites (Table 1, Fig. 3). The distributions of the estimates of the intrinsic rate of increase, Rk, were similar for the two drugs (Fig. 4D), in both cases with Rk values covering the whole range allowed by the prior distribution. While there was thus considerable variation between values of Rk for different patients, many of the individual values were estimated relatively precisely (see the confidence intervals given on Fig. 3).

Fig. 3. Parasite density profiles (left column) and baseline distributions of parasite stages (right hand column) for selected patients. The left hand column shows both the observed (filled circles) and fitted (open squares) peripheral parasite densities. The right hand column gives the baseline distribution of parasite stages. The vertical arrow beneath the latter indicates the assumed mid-point of sequestration.

Fig. 4. Estimates of most frequent parasite stage at baseline.
We use the coefficient of variation of the densities of parasites in each of the 12 stage categories as a measure of the degree of synchronization. This was calculated as the standard deviation of the estimated density across the 12 classes, divided by the arithmetic mean density, and varied from 0·14 to 2·10. The stage distributions of the parasites within each patient at baseline were modelled as a mixture of two components: a highly synchronized component (corresponding to the peaks in the right hand panels of Fig. 3) and an unsynchronized component, corresponding to the relatively flat bases of the stage distributions. In patients with relatively unsynchronized parasites with a low coefficient of variation, most of the parasite density is contributed by the base (e.g. Fig. 3F) while in patients estimated to have highly synchronized parasites most of the density is contributed by the peak (Fig. 3A and D). There was considerable variation in the coefficient of variation, corresponding to variation between patients in the relative contributions of the two components of the density distribution (Fig. 5C).

Fig. 5. Distributions of baseline characteristics estimated from the model. (A) Total parasite load. (B) Proportion of parasites sequestered. (C) Degree of synchronization. (D) Intrinsic rate of increase.
Where the intrinsic rate of increase, Rk, is estimated to be much greater than 1, corresponding to an initially rapidly growing parasite population, there is a clear trend for the estimates of the ring-stage parasite densities to be higher than those for the schizonts (e.g. Fig. 3C). Conversely, where Rk is close to 1, the estimated number of parasites in the base component of the distribution is similar for all the 4-h stage classes.
In patients with very rapid initial decreases in density, most of the parasites were estimated to be in the ring or trophozoite stages at baseline (Fig. 3A and E). Contrasting with this, initial increases in parasite densities observed for many of the patients could be explained by high initial sequestered loads (Fig. 3B and C). In most cases the maximum in the distribution of parasite stages at baseline was in the schizont stages, with relatively few patients estimated to have predominantly trophozoites (Fig. 4).
Almost all estimates of the total parasite density were within a reasonable range (Table 1, Fig. 5A). The exceptions were 4 patients estimated to harbour more than 2×10⁶ parasites per μl at baseline. The highest density was estimated to be for Patient 7 (Fig. 3D), where the model estimates of total parasite load exceeded 4×10⁶ parasites per μl.
The fit of the model, as measured by the residual variance, σe,d2, was similar, but somewhat better (i.e. low σe,d2) for artemether patients than for those on quinine (Table 2). Since drug allocation was randomized, we expect the parasitological status at baseline for the two groups to be comparable, and indeed, the estimates of baseline total parasite load were similar for the two drugs (Fig. 5A, Table 1). However, the estimated sequestered loads were slightly higher for patients on artemether than for quinine (Fig. 5B, Table 1), and the artemether-treated patients included more in which the parasites were estimated to be highly synchronized (high coefficient of variation) (Fig. 5C). This may reflect the small selection bias resulting from the requirement that at least 8 slides were included per patient.
With simulated datasets where the parasites were unsynchronized the model gave estimates of Nk,a,0 and of Rk very close to the true values (Fig. 6A). When the simulated parasite population was highly synchronized the performance in terms of estimation of Rk was more variable (Fig. 6B, C, and D). However, the estimated values of Nk,a,0 were reasonable approximations to the true baseline status, even when the true distribution of Nk,a,0 between stages was an arbitrary multimodal function (Fig. 6E).

Fig. 6. Estimated baseline status for examples of simulated patients. (A) Asynchronous parasite population. (B) Highly synchronous parasites (predominantly ring-stage). (C) Highly synchronous parasites (predominantly trophozoites). (D) Highly synchronous parasites (predominantly schizonts). (E) Randomly distributed initial parasite population. True (filled squares) and fitted (open circles) parasite densities. The vertical arrow indicates the assumed mid-point of sequestration. Details of the simulated datasets and the estimates of Rk are given in Table 3.

To evaluate the extent of collinearity in the estimation of the 4 patient-specific parameters we computed the Pearson correlation coefficients between the values of ln(Tk), ln(βk), Rk, and θk. The absolute value of none of these correlations exceeded a value of 0·3, indicating an acceptably low level of association.
DISCUSSION
The statistical estimation of the in vivo distribution of P. falciparum parasites between different stages of the asexual cycle represents a major challenge. A priori we have little information about the distribution of parasites between stages at the start of treatment, and a flexible family of curves is thus needed to describe the initial state. A consequence is that realistic models need many parameters, some of them like σd2 and Md determined at the level of the patient population, while others, such as Rk and those describing the baseline distribution of parasites between stages, vary between individuals.
It is often difficult to find maximum likelihood solutions for highly parameterized non-linear models, because of the difficulty of finding the maximum in a high dimension parameter space. One approach, used by Gravenor et al. (1998) for modelling parasite dynamics, is to fit the model separately to the data for each patient, however chance relationships within the data mean that such models do not converge for all the patients. Moreover, population-level parameters must be determined in a distinct step.
In contrast, the Bayesian MCMC approach we use can readily estimate both individual- and population-level parameters as part of the same estimation procedure. It also allows individual-level parameters to be formulated as random effects so that shrinkage estimators are obtained. In other words, when little information on the parameter value can be gleaned from the data for a patient, the estimate is pulled towards the population average. Thus, for instance, the specification of the overall baseline parasite loads, Tk, as drawn from a log-normal distribution. Similarly, when the data provide substantial information about Rk, our procedure gives a precise estimate of this quantity, when they do not, the posterior distribution of Rk is similar to the prior (a uniform distribution between 1 and 16).
The simulation study confirmed that our models do indeed provide reasonable estimates of the patient's status on enrolment, over a wide range of possible initial states. A key quantity that we estimated is R, the intrinsic rate of multiplication. This factor has been estimated at 12–15 per cycle in naive hosts during the initial (pre-symptomatic) phase of infection (Fairley, 1947; Cheng et al. 1997; Gravenor, McLean & Kwiatkowski, 1995) implying that almost all trophozoites complete schizogony, and most merozoites invade. In contrast White et al. (1992) estimated R in ineffectively-treated patients to be 3–10 per cycle, and inferred from the shape of the parasitaemia curves that these lower values for R resulted from reduced merogony or invasion inefficiency, not from clearance of peripheral parasites. Our models suggest that the population of patients included individuals with R values from across the whole range that we allowed. This supports the idea that severe malaria cases are not necessarily characterized by a high intrinsic rate of increase, and that we should look elsewhere for the factors determining severity of P. falciparum episodes.
This flexibility represents one substantive advantage over statistical approaches used previously to address this problem. The use of fixed durations of the stages, rather than constant flow-rates represents a further advance over the work of Gravenor et al. (1998, 2002). The Gravenor et al. (1998) model was formulated by classifying parasites into the two compartments (peripheral and sequestered), and describing the flow rates between the categories with differential equations, corresponding to treating the life-cycle as a Markov process. Its assumption of constant transition rates between the compartments is not equivalent to the usual biologist's model of a constant cycle length (Saul, 1998; Gravenor et al. 2002). To address these problems, Gravenor et al. (2002) more recently proposed a generalized version of the model that reduces variation in cycle length by increasing the number of compartments, and provides population-level estimates for some parameters via a second fitting procedure. Maximization of the likelihood for such models can, however, still not always be achieved, and the best fitting parameters imply implausibly high parasite loads for many patients.
If the number of parameters for each patient matches the number of categories the problem is unidentifiable (Gravenor et al. 2002), since the model must also include other parameters to allow for pharmacodynamics and parasite multiplication. However, many possible solutions can be rejected as biologically implausible. In the course of developing the present models we were forced, in particular, to reject solutions with very high values of κ because they gave total parasite loads for most of the patients in excess of the normal range of erythrocyte counts. Judgement of what are plausible total parasite loads thus introduces constraints that make it possible to solve the problem, but only at the cost of introducing an element of subjectivity into the results.
We also consider it reasonable to require that the parasite density should not vary erratically from one stage to the next (as in the simulated dataset shown in Fig. 6E). This allowed us to exclude solutions with multiple peaks in the distributions of parasite densities across the 12 stage categories, and thus to use only 3 parameters to describe these distributions (together with a further individual-level parameter for the total parasite load). The data still determine the extent of synchronization of the parasites (within the constraint of a fixed value of κ), selecting between extreme possibilities of highly synchronized parasite populations, uniform distributions corresponding to continuous output of merozoites from the liver, or mixtures of these extremes.
Since the trial was randomized, both total parasite load at baseline, and the proportion sequestered should be similar in patients treated with both drugs. We intended to use comparability of the estimated distribution of stages at baseline as a criterion to evaluate the model. However, for the parameterization that we have reported, while the total load was estimated to be similar the estimated proportion of parasites sequestered was higher in the artemether group. The requirement that each patient should have contributed a total of 8 slides to be included in the analyses may have unintentionally introduced a bias. This requirement meant that only those patients with relatively slow clearance could be included, and difference between the drugs in stage-specificity of their effects means that these form a different subset of the patients at baseline.
The strengths of our model are thus the congruence between the assumptions of the age-stage model and the biology of the parasite, and the fact that it usually provides believable estimates of the total parasite load. However, even with the age-stage model, the sensitivity of the estimates of R and of the estimated stage distributions to small changes in parameterization, caution against uncritical acceptance of the estimates of sequestered loads.
Our primary objective was to develop a model that can be used to cross-validate estimates of the total parasite load made using biochemical assays. For this objective our age-stage model should be adequate, since it seems likely that it gives reasonable estimates of the relative, even if not absolute, numbers of sequestered parasites in each patient, and in particular, that it provides an indication of which patients have a high proportion of sequestered parasites. The results suggest that there is considerable variation between patients in the degree of synchronization, and thus such models should be valuable for studying clinical or patho-physiological outcomes in relation to sequestered load. The model is not useful as a guide for the physician since the whole time-course of parasitaemia measurements must be accrued before the status at baseline can be assessed. The development of biochemical tools to measure the sequestered parasite load thus remains a priority.
This work forms a part of Swiss National Science Foundation project 31-59380.99 (Dynamics of malaria parasites in areas of high transmission). The authors are grateful to two reviewers whose comments enabled us to substantially improve the manuscript.
APPENDIX: EXPECTED NUMBERS OF PARASITES AT BASELINE
We assume exponential growth in the parasite population, with the survival rate of each age class being constant. Let the total number of stage classes be A, the parasite survival during stage class a prior to drug-treatment in host k be Sk,a,0, and the number of newly infected erythrocytes arising from one rupturing schizont be rk, so that the net reproductive number, per cycle (of duration A time intervals) is:

For the moment we consider the descendants of a primary population of new rings which arose from merozoites emerging from the liver at rates x1,t0, x1,t0+1 …, x1,t0+A−1 for A time intervals (i.e. exactly 1 cycle) starting at time t0. We assume these parasites to be sampled at a random time-point, t[ratio ]A[les ]t−t0<2A. We can use Table A1 (akin to a Lexis diagram) to illustrate the number of parasites in each age class at each time, using the example of A=4.

The objective is to determine the expected ratio, ψa,t=E[xa+1,t/xa,t] for all a and t.
First, consider the case where the input rate during the first A intervals is a constant, i.e. x1,t0=x1,t0+1 …=x1,t0+A−1. For each value of a, (a[les ]A) there are A−1 values of t for which xa+1,t=Sk,a,0xa,t and one value of t: A[les ]t−t0<2A for which xa+1,t=rkSk,a,0xa,t. The expectation of the ratio over all t: A[les ]t−t0<2A is therefore a weighted mean of these values i.e.:

and the parasites sampled at any time-point among the A age groups, a=1 … A are expected to be in the ratio:

In the conditions applying to our cases on enrolment, we assign A=12, and assume Sk,a,0=1 for all a and hence Rk=rk. We define Nk,1,0 to be the density of parasites in the first category, and then:

We now generalize to t−t0[ges ]2A by noting that the effect of a further cycle of exponential growth is to multiply all the numbers in Table A1 by a factor of Rk. This multiplication by a constant has no effect on the ratio xa+1,t/xa,t hence, by induction, we can state that given a constant input rate over one cycle, equation (2.4) applies for any number of completed cycles, i.e. for all t[ratio ]t−t0[ges ]A.
Equation (2.2) does not hold for the first cycle after emergence from the liver, hence if the input process continues beyond the first A time-units, parasites undergoing this initial cycle will distort the age distribution of the parasites away from that defined by (2.4). However, as the parasite population expands, newly emerged parasites represent a rapidly decreasing proportion of the total. Mixing of parasites which have undergone different numbers of cycles does not lead to violation of equation (2.4), so the fact that there are different cohorts of parasites contributing to each age group does not invalidate this equation.
In practice we anticipate that the rate of output of merozoites from the liver is not constant, and that small variations in cycle length will occur. Any random variation such that, x1,t=εtx1,t0 will result in multiplication of the density of all descendent parasites by the factor εt. Thus random variation over time in the input from the liver at time t will result in proportionate random variation in xa,t+δt around the ratios expected from (2.4), for all δt satisfying δt=Ac+a−1, where c is an integral number of completed cycles.
References
REFERENCES
BEST, N.,
COWLES, M. K. &
VINES, K. (
1996).
CODA: Convergence Diagnosis and Output Analysis Software for Gibbs Sampling Output. [0.30].
Cambridge,
MRC Biostatistics Unit.
CHENG, Q.,
LAWRENCE, G.,
REED, C.,
STOWERS, A.,
RANFORD-CARTWRIGHT, L.,
CREASEY, A.,
CARTER, R. &
SAUL, A. (
1997).
Measurement of Plasmodium falciparum growth rates in vivo: a test of malaria vaccines.
American Journal of Tropical Medicine and Hygiene
57,
495–500.CrossRefGoogle Scholar
COLLINS, W. E. &
JEFFERY, G. M. (
1999).
A retrospective examination of sporozoite- and trophozoite-induced infections with Plasmodium falciparum in patients previously infected with heterologous species of Plasmodium: effect on development of parasitologic and clinical immunity.
American Journal of Tropical Medicine and Hygiene
61,
36–43.CrossRefGoogle Scholar
EVANS, M.,
HASTINGS, N. &
PEACOCK, B. (
2000).
“von Mises Distribution.” Ch. 41 in Statistical Distributions, 3rd Edn. pp.
189–191.
Wiley,
New York.
FAIRLEY, N. H. (
1947).
Blood examination and prognosis in acute falciparum malaria.
Transactions of the Royal Society of Tropical Medicine and Hygiene
40,
33–48.Google Scholar
GRAVENOR, M. B.,
MCLEAN, A. R. &
KWIATKOWSKI, D. (
1995).
The regulation of malaria parasitaemia: parameter estimates for a population model.
Parasitology
110,
115–122.CrossRefGoogle Scholar
GRAVENOR, M. B.,
LLOYD, A. L.,
KREMSNER, P. G.,
MISSINOU, M. A.,
ENGLISH, M.,
MARSH, K. &
KWIATKOWSKI, D. (
2002).
A model for estimating total parasite load in falciparum malaria patients.
Journal of Theoretical Biology
217,
137–148.CrossRefGoogle Scholar
GRAVENOR, M. B.,
VAN HENSBROEK, M. B. &
KWIATKOWSKI, D. (
1998).
Estimating sequestered parasite population dynamics in cerebral malaria.
Proceedings of the National Academy of Sciences, USA
95,
7620–7624.CrossRefGoogle Scholar
HEIDELBERGER, P. &
WELCH, P. (
1983).
Simulation run length control in the presence of an initial transient.
Operations Research
31,
1109–1144.CrossRefGoogle Scholar
MURPHY, S.,
ENGLISH, M.,
WARUIRU, C.,
MWANGI, I.,
AMUKOYE, E.,
CRAWLEY NEWTON, C.,
WINSTANLEY, P.,
PESHU, N. &
MARSH, K. (
1996).
An open randomized trial of artemether versus quinine in the treatment of cerebral malaria in African children.
Transactions of the Royal Society of Tropical Medicine and Hygiene
90,
298–301.CrossRefGoogle Scholar
SAUL, A. (
1998).
Models for the in-host dynamics of malaria revisited: errors in some basic models lead to large over-estimates of growth rates.
Parasitology
117,
405–407.CrossRefGoogle Scholar
SPIEGELHALTER, D. J.,
THOMAS, A.,
BEST, N. &
LUNN, D. (
2003).
WinBUGS. [1.4]. 2003.
Cambridge.
TER KUILE, F.,
WHITE, N. J.,
HOLLOWAY, P.,
PASVOL, G. &
KRISHNA, S. (
1993).
Plasmodium falciparum: in vitro studies of the pharmacodynamic properties of drugs used for the treatment of severe malaria.
Experimental Parasitology
76,
85–95.Google Scholar
WARRELL, D. A.,
MOLYNEUX, M. E. &
BEALES, P. F. (eds) (
1990).
Severe and complicated malaria.
Transactions of the Royal Society of Tropical Medicine and Hygiene
84 (Suppl. 2),
1–65.Google Scholar
WHITE, N. J.,
CHAPMAN, D. &
WATT, G. (
1992).
The effects of multiplication and synchronicity on the vascular distribution of parasites in falciparum malaria.
Transactions of the Royal Society of Tropical Medicine and Hygiene
86,
590–597.CrossRefGoogle Scholar
WHITE, N. J. &
HO, M. (
1992).
The pathophysiology of malaria.
Advances in Parasitology
31,
83–173.CrossRefGoogle Scholar

Fig. 1. Asexual cycle of Plasmodium falciparum and structure of the model. (A) Asexual cycle showing notation used for parasite densities Nk,a,t is the expected density of parasites at stage a at time t in patient k. Note that the dotted line delimiting peripheral and sequestered parasites intentionally cuts the boxes with index 7, since sequestration is assumed to occur while parasites are in this stage. (B) Model for change in numbers of parasites over one 4-h interval. The open boxes give the expected numbers of parasites at time t+1. The term adjacent to the arrows is the multiplying factor that determines how these expected numbers are related to each other.

Table 1. Measured and estimated characteristics of patients
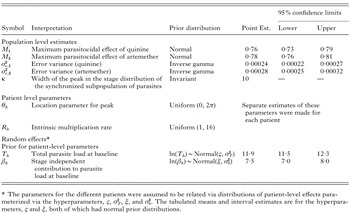
Table 2. Prior and posterior distributions of parameters

Fig. 2. Stage- and time-dependence of drug effects. (A) Relative inhibition by stage of parasite. (B) Proportion of maximal effect of drug, by observation time. Pharmacokinetics and pharmacodynamics inferred from the results of ter Kuile et al. (1993). The parameters used in the model correspond to 4-h stage- or time-periods.
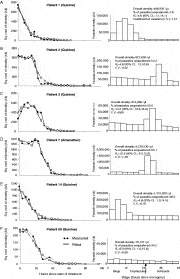
Fig. 3. Parasite density profiles (left column) and baseline distributions of parasite stages (right hand column) for selected patients. The left hand column shows both the observed (filled circles) and fitted (open squares) peripheral parasite densities. The right hand column gives the baseline distribution of parasite stages. The vertical arrow beneath the latter indicates the assumed mid-point of sequestration.

Fig. 4. Estimates of most frequent parasite stage at baseline.

Fig. 5. Distributions of baseline characteristics estimated from the model. (A) Total parasite load. (B) Proportion of parasites sequestered. (C) Degree of synchronization. (D) Intrinsic rate of increase.
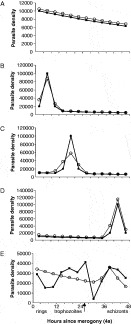
Fig. 6. Estimated baseline status for examples of simulated patients. (A) Asynchronous parasite population. (B) Highly synchronous parasites (predominantly ring-stage). (C) Highly synchronous parasites (predominantly trophozoites). (D) Highly synchronous parasites (predominantly schizonts). (E) Randomly distributed initial parasite population. True (filled squares) and fitted (open circles) parasite densities. The vertical arrow indicates the assumed mid-point of sequestration. Details of the simulated datasets and the estimates of Rk are given in Table 3.

Table 3. Simulated datasets shown in Fig. 6 and corresponding estimates of Rk
 You have
Access
- 15
- Cited by