I. INTRODUCTION
In the 1970s, Davidovits Reference Davidovits1,Reference Davidovits2 reported on geopolymers as semicrystalline three-dimensional aluminosilicate materials, which can be formed from aluminosilicate sources (metakaolin, fly ash, or slag) mixed with an aqueous solution containing reactive ingredients (potassium hydroxide, phosphoric acid, or sodium silicate). Reference Davidovits1,Reference Lecomte, Liégeois, Rulmont, Cloots and Maseri3 Today, GFs have been widely investigated because of their unique combination of low thermal conductivity associated with good mechanical properties and excellent high temperature stability, Reference Lecomte, Liégeois, Rulmont, Cloots and Maseri3–Reference Hemra and Aungkavattana7 environmentally friendly nature, simple fabrication, and the fact that they do not require high temperature sintering. Reference Al-Majidi, Lampropoulos, Cundy and Meikle8 They have been used as membrane and membrane supports, Reference Ge, Yuan, Wang, He and Cui9,Reference Bai and Colombo10 adsorbents and filters, Reference Minelli, Medri, Papa, Miccio, Landi and Doghieri11–Reference López, Sugita, Tagaya and Kobayashi14 catalysts, Reference Sharma, Medpelli, Chen and Seo15,Reference Zhang, Liu, Xu and Wang16 and building materials. Reference Palmero, Formia, Antonaci, Brini and Tulliani4,Reference Zhang, Provis, Reid and Wang17,Reference Papa, Medri, Kpogbemabou, Morinière, Laumonier, Vaccari and Rossignol18 Generally, aluminum Reference Hlaváček, Šmilauer, Škvára, Kopecký and Šulc6,Reference Ducman and Korat19,Reference Masi, Rickard, Vickers, Bignozzi and Van Riessen20 and silicon Reference Papa, Medri, Kpogbemabou, Morinière, Laumonier, Vaccari and Rossignol18,Reference Henon, Alzina, Absi, Smith and Rossignol21–Reference Prud’Homme, Michaud, Joussein, Clacens, Arii-Clacens, Sobrados, Peyratout, Smith, Sanz and Rossignol24 powders have been used as pore foaming agent for the fabrication of foamed geopolymers, but the redox reactions are intense (making it difficult to control the generated cell size and total porosity) due to the high alkalinity of the system, Reference Davidovits1 and the cells formed by this foaming route are typically closed, thereby limiting the use of the porous components in applications where fluid transport is necessary. Reference Bai, Franchin, Elsayed, Conte and Colombo25 GFs are a very attractive material also for a range of thermo-acoustic insulating and fire-proofing applications, as their maximum application temperature is in the range ∼800–1000 °C [depending on the amount of crystalline phases present, which depends on the heat treatment as well as the composition (mainly the type of cation)], which is much better than that of traditional insulating materials (polyurethane foam: ∼120 °C; polystyrene foam: ∼100 °C; melamine foam: ∼150 °C; foam glass: ∼420 °C; glass wool: ∼750 °C; perlite: ∼750 °C). Reference Davidovits1,Reference Bai and Colombo10,Reference Papadopoulos26–Reference Rahier, Wastiels, Biesemans, Willlem, Van Assche and Van Mele28
Recently, much research has focused on developing geopolymers with an interconnected cellular network. Geopolymers with unidirectional channels were produced by a freeze-casting technique without additional dispersants and binders. Reference Papa, Medri, Benito, Vaccari, Bugani, Jaroszewicz, Swieszkowski and Landi29 Open cellular GFs were fabricated using a saponification/peroxide/gelcasting combined method. Reference Bai, Franchin, Elsayed, Conte and Colombo25,Reference Cilla, Morelli and Colombo30 Geopolymer with a total porosity as high as ∼71 vol% and different pore geometries were obtained from the infiltration of 3D printed sacrificial templates. Reference Franchin and Colombo31 Highly porous geopolymer with high interconnectivity and relatively narrow pore size distribution was synthesized through templating and surface interactions. Reference Glad and Kriven32 The above mentioned methods, however, are time consuming and do not seem suitable for mass production. A simple pore-forming agent in combination with surfactant and specific catalytic acid additive combined route was introduced to prepare hybrid foams with interconnected porosity and low density. Reference Bai and Colombo10,Reference Verdolotti, Liguori, Capasso, Errico, Caputo, Lavorgna and Iannace22 Hydrogen peroxide (H2O2), as chemical blowing agent for the fabrication of GFs, is currently attracting great interest for the production of high porosity components. Reference Palmero, Formia, Antonaci, Brini and Tulliani4,Reference Novais, Buruberri, Ascensão, Seabra and Labrincha5,Reference Bai and Colombo10,Reference Ducman and Korat19,Reference Masi, Rickard, Vickers, Bignozzi and Van Riessen20,Reference Bai, Franchin, Elsayed, Conte and Colombo25,Reference Cilla, Morelli and Colombo30,Reference Franchin and Colombo31 In particular, components possessing high strength and porosity, low thermal conductivity, with complex-shape, are produced by environmental friendly process, but more investigations are still required to improve the fabrication procedure.
The present study aimed at assessing the effect of a foaming agent (H2O2), in combination with a surfactant (Tween 80), on the porosity, cellular morphology, thermal conductivity, and mechanical properties of GFs. The removal of copper ion and ammonium from solutions was also investigated; different GFs were tested and compared to geopolymer powders obtained by crushing a foam. As a proof of concept, additive manufacturing (AM) with a geopolymeric slurry of similar composition is also presented, as an alternative way to produce highly porous components with open, interconnected pores and well controlled, non stochastic pore morphology.
II. EXPERIMENTAL PROCEDURE
Geopolymer samples were prepared by using commercially available metakaolin (Argical 1200s, AGS Mineraux, Clerac, France) and reactive ingredients as raw materials. These latter ones were obtained from a solution of 11 M KOH (prepared by dissolving potassium hydroxide pellets, from Sigma–Aldrich, Steinheim, Germany, in distilled water) and liquid potassium silicate (KSIL 0465, Crosfield Italia, Montorio, Italy). A 3 wt% hydrogen peroxide solution (diluted from 30 wt% H2O2, from Sigma–Aldrich) was selected as chemical foaming agent. Reference Bai and Colombo10,Reference Bai, Franchin, Elsayed, Conte and Colombo25,Reference Feng, Zhang, Gong, Li, Cao and Cheng33 Tween 80 (polyethylene glycol sorbitan monooleate, VWR BDH Prolabo, Briare, France) was added as surfactant. Based on these raw materials, the slurry with 36.5 wt% MK content resulted in the following theoretical oxide molar ratios: SiO2/Al2O3 = 3.53, K2O/SiO2 = 0.29 and H2O/K2O = 15.1, (excluding the content of water in the H2O2 solution). Reference Bai and Colombo10,Reference Bai, Franchin, Elsayed, Conte and Colombo25
Homogeneous geopolymer slurries (GPs) were prepared by mechanical mixing metakaolin (MK) and the reactive alkali solution for about 30 min at 600 rpm at room temperature. Afterward, wet foams were obtained by successively adding the surfactant (1000 rpm for 10 min) and H2O2 (600 rpm for 5 min) into the pastes. The weight fraction of Tween 80 in GPs was defined as X × 100%, and the weight fraction of H2O2 in GPs as Y × 100%. Immediately after mixing, the wet foams were poured into plastic molds, sealed, and cured in a laboratory oven in two steps: (i) overnight at 40 °C, to prevent cracking due to an abrupt loss of water and promote the geopolymerization reaction; (ii) at 75 °C for 24 h in an oven, to consolidate the structure. Reference Bai and Colombo10,Reference Bai, Franchin, Elsayed, Conte and Colombo25 The size of the produced samples was ∼13 × ∼50 × ∼50 mm3.
The thermal conductivity (TC) was tested on selected samples using a hot-disc thermal analyzer (DRE-III, Xiangtan, China) at room temperature, adopting the transient plane source technique. Samples were polished and tested shortly after drying, to ensure a limited moisture content for the all the samples, as humidity in specimens can have a great influence on TC values. Reference Ramamurthy and Narayanan34–Reference Zhang, Provis, Reid and Wang37
Prior to the characterization of porosity, phase composition, cellular morphology, and mechanical properties, the samples were cut into a parallelepiped with ∼14 × ∼14 × ∼11 mm3 dimension, and the GFs were then dried at 40 °C in an electric oven for one week. X-ray diffraction (XRD) patterns were investigated on ground samples using a Bruker AXS-D8 Advance XRD instrument (Bruker Corporation, Karlsruhe, Germany; Cu Kα radiation, 40 kV, 40 mA) with 0.05° step width and 5–55° scanning range. Semi-automatic phase identification was performed via the Match! software package (Crystal Impact GbR, Bonn, Germany) supported by PDF-2 Powder Diffraction File from ICDD (International Center for Diffraction Data, Newtown Square, Pennsylvania). Morphological observation of cut surfaces was conducted using an AxioCam ERc 5s optical microscope (Carl Zeiss, Goettingen, Germany) and a FEI Quanta 200 Scanning Electron Microscope (SEM; Thermo Fisher Scientific, Eindhoven, The Netherlands). Average pore size (D circle) and pore size distribution were estimated by randomly measuring at least 200 pores from the SEM images using a Nano Measurer 1.2 image analysis software (Fudan University, Shanghai, China). Reference Bai and Colombo10,Reference Nie, Xue, Ge, Ma and Zhang38 The actual cell size (D sphere) was obtained using the stereological equation: D sphere = D circle/0.785 according to ASTM D3576-98. Reference Bai, Franchin, Elsayed, Conte and Colombo25,Reference Zhang, Rodrigue and Ait-Kadi39
Tests on the compressive properties were carried out via Instron 1121 universal material testing machine (Instron, Canton, Massachusetts) at a cross-head speed of 1 mm/min, and each data point represented the mean value of at least five individual tests. All samples were tested based on axial direction (parallel to the foaming directions), except for one case (sample SH4) on radial direction (perpendicular to the foaming direction).
The bulk density (ρb) of the GFs was obtained by the ratio of weight over the geometrical volume (as measured with a digital caliper). Reference Bai and Colombo10,Reference Zhang, Rodrigue and Ait-Kadi39 The true density (ρt) was measured with an Accupyc1330 true density analyzer (Micromeritics, Norcross, Georgia). The total porosity (TP) was calculated according to the equation: TP = 100%(1 − ρb/ρt), Reference Bai, Franchin, Elsayed, Conte and Colombo25,Reference Papa, Medri, Benito, Vaccari, Bugani, Jaroszewicz, Swieszkowski and Landi29 while the corresponding open porosity (OP) was then determined based upon the Archimedes’ principle using distilled water as the liquid medium.
The geopolymeric slurry formulation was partially modified to make it suitable for direct ink writing (DIW), in particular for achieving a suitable pseudo-plastic rheological behavior. A lower amount of alkaline solution was used to decrease the reactivity of the slurry and extend its workability window; the oxide molar ratios thus changed to: SiO2/Al2O3 = 3.43, K2O/SiO2 = 0.27 and H2O/K2O = 15.1. 3.1 wt% of PEG (poly(ethylene glycol), BioUltra 1000, supplied by Sigma–Aldrich) was added to optimize the rheological properties of the slurry. The alkaline solution and PEG were stirred at 600 rpm for about 10 min; MK was then added and stirred at 600 rpm for 30 min. After mixing, the ink was transferred into a plastic syringe and kept at 40 °C for about 20 min; then, it was mounted on a DIW system (Delta Wasp 2040 Turbo, Wasproject, Massa Lombarda, Ravenna, Italy) and extruded through an Archimedes’ screw pressurized with compressed air.
The ink was extruded at room temperature and atmospheric conditions through the tip of a tapered capillary nozzle with a diameter of 840 µm (Nordson Italia S.p.a., Segrate, Italy) at a feed rate of about 10 mm/s. 3D periodic lattices were assembled by patterning an array of parallel filaments in the x–y plane such that their orientation was orthogonal to the layers immediately above and below a given layer. Solidification via geopolymerization occured at room temperature.
Stock solutions used for adsorption tests were prepared by dissolving copper sulfate pentahydrate (Hetalab Chemical Corp., Morris Plains, New Jersey) and ammonium dihydrogen phosphate (Carlo Erba s.p.a., Milan, Italy) respectively in distilled water. The current World Health Organization (WHO, 2008) guideline value for copper concentrations in drinking water is set at 2 ppm. There is no guideline value for ammonia at this time from WHO, instead, WHO does recognize odor and taste effects at 1.5 ppm and 35 ppm, respectively. In this work, both copper (as Cu2+) and ammonium (as NH4 +) concentrations in the stock solution were 3 ppm (mg/L), which simulate real wastewater. Batch experiments were performed to test the adsorption properties for specific contaminants (copper and ammonium ions) in water of GFs, and compare them to the performance of geopolymer powder obtained from the crushing of foams, sieved through a 125 μm screen.
A fixed amount of geopolymer was brought in contact with a specific amount of test solution with magnetic stirring, and the concentration of the contaminant was monitored as a function of time to characterize removal efficiency (R) and adsorption capacity (q) of the adsorbent, which were calculated according to the following formulas:
 $$R\;(\% ) = {{{C_0} - {C_t}} \over {{C_0}}}$$
 $$q\;(\% ) = {{\left( {{C_0} - {C_t}} \right) \times V} \over M}\quad ,$$
where C 0 is the starting concentration of the test solution and C t is the concentration at time t. V is the volume of solution (L) and M the weight of adsorbent (g).
Quantitative analysis of copper and ammonium ions was performed with an UV–visible spectrophotometer (FP12, Macherey Nagel, Dueren, Germany). Reference Jung, Fazio, Van Dooren, Delcroix, Faggio, Blust and De Boeck40–Reference Hagenkamp-korth, Haeussermann and Hartung42 The presence of copper ions was determined by spectrophotometric quantification of a chromogenic blu complex with cuprizone in weakly basic conditions. The presence of ammonium ions was detected by observing the products of the chromogenic reaction with sodium hypochlorite and sodium salycilate in presence of sodium nitroprusside as catalyst.
III. RESULTS AND DISCUSSION
A. Effect of the surfactant content
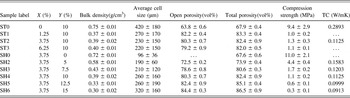
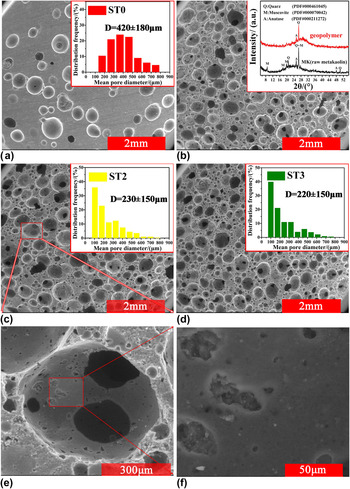
Since the strength and the amount of porosity and connectivity are important parameters for the performance of GFs and are strictly linked in a complex way to the cell architecture (cell size and size distribution), Reference Bai and Colombo10,Reference Papa, Medri, Benito, Vaccari, Bugani, Jaroszewicz, Swieszkowski and Landi29 a preliminary investigation was conducted to quantify the above-mentioned features. Table I reports the values for the relative density, average cell size, amount of open and total porosity, as well as compressive strength, of the foam samples. Figures 1(a)–1(d) show the morphological features and the pore size distribution of the cellular solids produced using different amounts of surfactant.
Values of the relative density, average cell size, porosity, compression strength and thermal conductivity (TC) of samples produced with different amounts of surfactant (X%) and H2O2 (Y%).

Morphology of GFs produced with various amounts of surfactant (X%): (a) without Tween 80; (b) X = 1.25; (c) X = 3.75; (d) X = 6.25. The insets are the cell size distributions (a, c, and d), the XRD patterns (b). (e)–(f) are a magnified view of a cell and of the cell wall.

The SEM micrographs of the cut surface [Figs. 1(b)–1(d)] show the typical porous morphology of foams produced from direct foaming. Reference Bai and Colombo10,Reference Verdolotti, Liguori, Capasso, Errico, Caputo, Lavorgna and Iannace22 A cellular structure, comprised of a large amount of spheroidal cells, having a size distribution ranging from ∼100 μm to ∼600 μm and surrounded by relatively thick struts, was observed for all samples. For comparison purposes, a sample (ST0) was fabricated without the surfactant (Tween 80). For this sample, the typical cellular microstructure produced by the decomposition reaction of hydrogen peroxide can be observed, based on mainly closed, large cells unevenly distributed in the cross-section. Its strength, total porosity and cell size and size distribution values are in accordance with previous reports. Reference Bai and Colombo10,Reference Cilla, Morelli and Colombo30
As it can be observed in Figs. 1(b)–1(d), and confirmed by the values reported in Table I, different contents of Tween 80 led to samples possessing similar pore characteristics, porosity, and strength. When the surfactant content increased from 1.25 to 6.25 wt%, the total porosity and average pore size values decreased. The most likely interpretation of these trends is that the viscosity of the slurry increases and the foamability decreases with increasing amount of surfactant. Reference Bai and Colombo10,Reference Yin, Peng, Dhara, Yang and Su43,Reference yan Yin, gui Zhou, Shan Yu, lei Wang, Zhao, Luo and Yang44
However, due to the different curing temperature (from room temperature Reference Bai and Colombo10 to 40 °C), the ratio of open porosity to total porosity increased due to the more effective decomposition of the H2O2 blowing agent. This would likely result in an increased permeability of the samples, and this property is currently under investigation. The cell size distribution increased due to the higher curing temperature, which increased the pore collapse and coalescence. Reference Bai and Colombo10 Moreover, most of spheroidal cells surrounded by relatively thick struts showed the presence of interconnecting pores created by gas release at high pressure. Reference Ducman and Korat19 Higher magnification images in Figs. 1(e)–1(f) show cell windows and smaller pores in the cell wall (<100 µm), which were also observed in previous works Reference Bai and Colombo10,Reference Ducman and Korat19,Reference Liu, Shao, Wang, Qin, Huang, Song, Lin, Yuan and Wang45 and would also increase the permeability of the component.
The inset in Fig. 1(b) reports the phase composition of only one of the produced samples (ST1), and others are not presented here for brevity as they had the same XRD patterns. A typical diffuse halo centered at 27–29° 2θ, Reference Lecomte, Liégeois, Rulmont, Cloots and Maseri3,Reference Bai and Colombo10,Reference López, Sugita, Tagaya and Kobayashi14,Reference Bai, Franchin, Elsayed, Conte and Colombo25 typical of an amorphous phase can be observed, and some peaks attributable to quartz, anatase, and muscovite impurities in the metakaolin Reference Bai and Colombo10,Reference López, Sugita, Tagaya and Kobayashi14 were present. After the geopolymer solidification, the center of the scattering diffraction of the broad hump shifted from ∼22 to ∼28° 2θ, confirming the occurrence of the geopolymerization reaction.
B. Effect of the hydrogen peroxide content
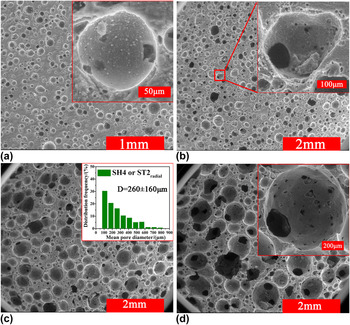
SEM analysis (Fig. 2) was performed on the cut surfaces to investigate the morphology of GFs produced using different H2O2 contents [SH(0–6)] and fixed content of Tween 80 (X = 3.75). From the SEM micrographs, the significant morphology differences for each foam tested can be observed, and it is also evident that the amount of cell windows increased with increasing amount of foaming agent, leading to larger amounts of open porosity (see also Table I). Reference Bai and Colombo10,Reference Ducman and Korat19,Reference Liu, Shao, Wang, Qin, Huang, Song, Lin, Yuan and Wang45 Radial (perpendicular to the foaming direction) cross-section of samples (X = 3.75, Y = 10) were also observed [we report, as an example, only the results for sample SH4, see Fig. 2(c)].
SEM images of GFs produced using different amounts of hydrogen peroxide with fixed surfactant (Tween 80) content: (a) Y = 0.0; (b) Y = 5; (c) Y = 10; radial direction (d) Y = 13; The insets of (a, b, and d) are the magnified view of a cell and surrounding struts and the inset of (c) is the cell size distribution for sample SH4 (radial direction).

The results [Figs. 1(c), 2(c) and Table I] indicate that similar values for the average cell size, morphology, and mechanical properties were achieved for the sample produced 3.75 wt% of surfactant and 10 wt% of H2O2 and measured along the axial (sample ST2) and radial (sample SH4) direction, respectively, suggesting that the porosity in the foams was homogeneously distributed throughout the volume. Sample ST0 (without surfactant) and SH0 (without H2O2) were produced to highlight the synergistic effect of two different additives: foaming agent and surfactant. Sample ST0 and SH0 possessed similar total porosity (67.9 vol% and 67.6 vol%) and strength (9.4 and 11 MPa), but significantly different average cell size (∼420 and ∼96 μm). The relatively high amount of open porosity (∼63.8 vol%) for Sample ST0, whose cells SEM investigations show do not possess a large amount of interconnecting cell windows, can be explained by the presence of intrinsic meso/macro-pores in the geopolymer matrix. Reference Bai and Colombo10,Reference Bai, Franchin, Elsayed, Conte and Colombo25,Reference Cilla, Morelli and Colombo30,Reference Lloyd, Provis, Smeaton and van Deventer46
The synergistic effect of Tween 80 and H2O2 led to the generation of a well interconnected, homogeneous cell structure and low relative density. As the mass fraction of hydrogen peroxide increased from 5 to 15 wt% with same amount of surfactant, the relative density and compressive strength sharply dropped from ∼0.58 to ∼0.30 g/cm3 and from ∼4.4 to ∼0.3 MPa, respectively. The corresponding axial average cell size and total porosity increased from ∼190 to ∼320 μm and from ∼73.9 to ∼86.5 vol%, respectively. Additionally, with the increase of H2O2 amount, the thermal conductivity coefficient dropped from 0.1583 to 0.0913 W/mK due to the increasing amount of total porosity present in the aluminosilicate materials. Reference Feng, Zhang, Gong, Li, Cao and Cheng33 The thermal conductivity of our samples was a little higher than that reported for fly ash-based GFs (0.0744 W/mK), Reference Feng, Zhang, Gong, Li, Cao and Cheng33 but smaller than that of metakaolin-based GFs (0.220 W/mK) and lightweight aggregate foamed geopolymer concretes (0.47 W/mK). Reference Prud’homme, Michaud, Joussein, Peyratout, Smith, Arrii-Clacens, Clacens and Rossignol23,Reference Yong, Liu, Alengaram, Jumaat and Mo36 The data also indicate that the GFs are superior in thermal conductivity coefficient compared to the conventional building materials, such as blocks (0.60 W/mK) and bricks (0.90 W/mK). Reference Yong, Liu, Alengaram, Jumaat and Mo36 The results prove that the foams produced in this work have the potential for being used as fireproof insulation materials, although further work is needed to further decrease the thermal conductivity of the samples to values more in line with insulation materials currently in use, e.g., polyurethane foams, which have a TC about 3–4 times lower (but of course are limited in the temperature of use and are non resistant to fire).
As proposed by Rice, Reference Rice47,Reference Rice48 the strength of a cellular component is related to its total porosity by the following equation:
 $$\sigma = {\sigma _0}\exp ( - bp)\quad ,$$
where σ is the strength at relative total porosity p, σ0 is the strength of the dense solid (p = 0), and b is an empirical constant.
Based on the results (samples SH2–3, ST2, SH5–6) of the compressive strength and total porosity data, values of σ0 = 1,384,847 MPa and b = 17.1, with a correlation factor R 2 = 0.96 were obtained fitting the experimental data with Eq. (3). The reasonably good fitting demonstrate that the compressive strength can be well approximated by Eq. (3) i.e., the dependence of the compressive strength on total porosity can be described by the minimum solid area (MSA) model when the total porosity ranges between ∼74 and ∼87 vol%.
C. Copper and ammonium ion removal test
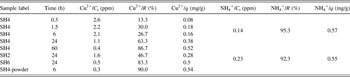
The amounts of copper and ammonium removed by different samples as a function of time are reported in Table II. As expected, the amount of Cu2+ adsorbed was found to be dependent on contact time. Reference Ge, Cui, Kong, Li, He and Zhou49 Furthermore, the copper removal efficiency increased with the geopolymer porosity, as the active contact sites increased with porosity. Reference Novais, Buruberri, Seabra and Labrincha12 This result indicates that the highest adsorption values are achieved by GFs with the highest amount of porosity, and for the longest contact time. Additionally, the SH4 foamed sample was ground into powder to compare the effect of sample morphology (i.e., powder versus foamed monolith). The data show that the foamed geopolymer sample (SH4) achieved a high removal efficiency (86.7%), similar to that of sieved geopolymer powders produced by crushing a foam (90.0%). This result is particularly significant because it indicates that a monolithic porous filter could be used instead of a packed (or fluidized) bed or honeycombs, with advantages in terms of lower pressure drop, higher mixing (high convection inside the cells, with enhanced mass and heat transfer) and optimizable contact time. Moreover, such component would be easier to retrieve and regenerate, as it does not require filtering as in the case of powders mixed with the liquid. Reference Twigg and Richardson50,Reference Lucci, Della Torre, Montenegro and Dimopoulos Eggenschwiler51
Removal efficiency and adsorption capacity of copper and ammonium ions for different samples as a function of contact time.

The maximum copper (0.54 mg/g) and ammonium (0.57 mg/g) uptake listed here are significantly smaller than those reported for metakaolin-based geopolymer powders (21.07 mg/g for ammonium). Reference Luukkonen, Sarkkinen, Kemppainen, Rämö and Lassi13 The reason can be due to the fact that the initial content of Cu2+ and NH4 + is low (3 ppm), but the data show in any case that most of the ions are removed from the solutions. The above-mentioned results (Table II), therefore, indicate the potential that these foams have as adsorbent materials for copper and ammonium removal with high uptake efficiency. Further research will be conducted to investigate the removal efficiency of GFs of different compositions, and a further increase in their uptake capacity could be achieved by for instance increasing the initial concentration of contaminant, controlling the pH and temperature, decreasing the adsorbent dose, and change the Si/Al ratios to tailor the microstructure of the geopolymer at the nano-scale. Reference Ge, Yuan, Wang, He and Cui9,Reference Novais, Buruberri, Seabra and Labrincha12–Reference López, Sugita, Tagaya and Kobayashi14,Reference Ge, Cui, Kong, Li, He and Zhou49,Reference Al-Zboon, Al-smadi and Al-Khawaldh52
Considering the ease of shaping that geopolymer slurries have, we can thus propose the use of these eco-friendly adsorbing materials as monolithic filters, components for packed beds or self-supported inorganic membranes. They are, in fact, easier to collect and recycle in comparison with powdered adsorbents, Reference Novais, Buruberri, Seabra and Labrincha12 and cheaper and more durable in comparison with traditional inorganic membranes. Reference Ge, Yuan, Wang, He and Cui9
D. DIW
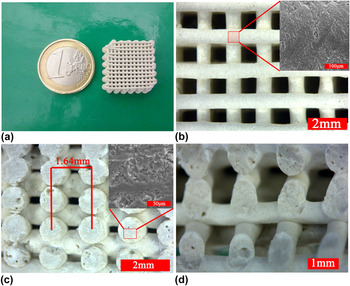
Figure 3 shows an example of a geopolymeric lattice fabricated by DIW. The filaments retained a circular section and showed limited sagging as most of the side pores remained open. This indicates that the rheological properties of the modified slurry were well suitable. The pores visible in the struts were probably due to water and PEG elimination or to the presence of air entrapped during the filling of the syringe.
Optical and SEM images of a geopolymeric lattice fabricated by direct ink writing: (a) overview; (b) top view; (c) side view; (d) fracture surface view. The insets of (b and c) are the magnified views observed by SEM.

The lattices were comprised of 12 orthogonal layers of 0.8 mm wide parallel struts. The spanning distance between the struts (i.e., the distance between the center of two consecutive struts) was set at 1.6 mm [about 1.64 mm, see Fig. 3(c)]. Not including the edges, printed samples had a size of 20 × 20 × 7.2 mm3; the layer height was set at 600 µm to provide a small overlap and therefore better adhesion between the layers. The designed porosity was 59.2 vol%, and the measured total porosity was 59.7 ± 2.7 vol%, indicating a very good morphological agreement between designed and fabricate component.
These results indicate that it will be possible to fabricate porous geopolymer components with controlled, non stochastic pore morphology by using AM technologies.
IV. CONCLUSIONS
High strength and high porosity GFs with tailored macroporous structure were fabricated by direct foaming and gelcasting using H2O2 as foaming agent plus Tween 80 as surfactant. The synergistic effect of hydrogen peroxide and Tween 80 led to high interconnected porosity, good mechanical properties, low density and low thermal conductivity. Different porosity (∼74 to ∼87 vol%), average pore size (∼190 to ∼320 μm), thermal conductivity (0.09–0.16 W/m·K) and compressive strength (0.3–4.4 MPa) were obtained by adding different amounts of H2O2 and surfactant. The relationship between the porosity and strength could be explained by the MSA model.
High removal efficiency for copper ions (∼87%) and ammonium ions (∼95%) for a system simulating real drinking wastewater [with low concentration (3 ppm) of pollutants] was achieved employing monolithic foamed components. Porous geopolymer scaffolds using DIW were also fabricated.
The results obtained for the foamed geopolymers (morphology, mechanical properties, adsorption efficiency and capacity, and thermal conductivity) demonstrate that they could be used as promising substitutes for highly porous materials in applications such as thermal insulation and wastewater treatment.
ACKNOWLEDGMENTS
Chengying Bai gratefully acknowledges the financial support of the China Scholarship Council (CSC) (No. 201407565009).