1. Introduction
Tonal noise generated by airfoils at low to moderate Reynolds number was recognized in the early stages of the development of aeroacoustics. It bears significance for a large number of applications, e.g. small-scale wind turbines, fans and – especially in recent years – unmanned aerial vehicles (Arcondoulis et al. Reference Arcondoulis, Doolan, Zander and Brooks2010). Compared to broadband noise, tonal components are particularly displeasing and unwanted. An improved understanding of the noise generation mechanism can lead to effective control strategies for noise elimination or abatement.
In an early study on the tonal noise produced by airfoils, Paterson et al. (Reference Paterson, Vogt, Fink and Munch1973) observed the particular nature of the spectrum of acoustic pressure: multiple tones
 $n=1,2,\ldots$
at frequencies
 $f_{n}$
proportional to a power of the free-stream velocity
 $u_{\infty }^{0.85}$
. The dominant tone
 $f_{n_{max}}$
(also denoted as the primary tone (Arcondoulis et al.
Reference Arcondoulis, Doolan, Zander and Brooks2010)) followed this variation over a finite range of Reynolds numbers before a transition (or jump) to a different frequency (different index
 $n$
) was observed. This particular structure of the spectrum with a primary tone
 $f_{n_{max}}$
and multiple side tones
 $f_{n}$
(also denoted secondary tones) is called a ladder-type structure, where the primary tone
 $f_{n_{max}}$
constitutes the rungs of the ladder.
The ladder structure has been explained by the superposition of tones at frequencies
 $f_{n}$
and broadband energy content in the acoustic spectrum centred at frequency
 $f_{s}$
(Arbey & Bataille Reference Arbey and Bataille1983; Chong & Joseph Reference Chong and Joseph2012). As a consequence of this superposition, a dominant (primary) tone
 $f_{n_{max}}$
can be identified. On average, the main tone frequency thus follows the development of the broadband centre frequency
 $f_{s}$
, which is described in the work of Paterson et al. (Reference Paterson, Vogt, Fink and Munch1973) to have a dependence on velocity with
 $u_{\infty }^{1.5}$
. With the airfoil chord
 $c$
, kinematic viscosity
 ${\it\nu}$
and proportionality constant
 $k$
, the expression
 $$\begin{eqnarray}f_{s}^{\star }=\frac{f_{s}c}{u_{\infty }}=k\sqrt{\frac{cu_{\infty }}{{\it\nu}}}=k\sqrt{\mathit{Re }_{c}}\end{eqnarray}$$
describes this semi-empirical rule. Based on the data of Paterson et al. (Reference Paterson, Vogt, Fink and Munch1973),
 $k=0.011$
. The dependence on the square root of the Reynolds number
 $\mathit{Re}_{c}$
is reminiscent of the variation of the laminar boundary layer thickness (e.g. Blasius profile on a flat plate; Schlichting & Gersten Reference Schlichting and Gersten2000).
Since the observation of Paterson et al. (Reference Paterson, Vogt, Fink and Munch1973), the topic has received much attention. Recent studies indicate the sustained interest and ongoing debate (Plogmann, Herrig & Würz Reference Plogmann, Herrig and Würz2013; Fosas de Pando, Schmid & Sipp Reference Fosas de Pando, Schmid and Sipp2014; Golubev et al. Reference Golubev, Nguyen, Mankbadi, Roger and Visbal2014; Pröbsting, Serpieri & Scarano Reference Pröbsting, Serpieri and Scarano2014) to comprehensively explain the occurrence of multiple discrete tones through the concept of a feedback loop as a frequency selection mechanism. The latter was proposed by Tam (Reference Tam1974), followed by Fink (Reference Fink1975) and Wright (Reference Wright1976). Later, Arbey & Bataille (Reference Arbey and Bataille1983) explained the phenomenon by the scattering of convected surface pressure perturbations, induced by instability waves amplified in the boundary layer, at the trailing edge. The mechanism of surface pressure perturbations passing the trailing edge and thereby generating acoustic waves had been previously reported by Amiet (Reference Amiet1976) among others.
The importance of the flow field topology for the amplification of instability waves has been recognized in the works of Arbey & Bataille (Reference Arbey and Bataille1983), followed by Lowson, Fiddes & Nash (Reference Lowson, Fiddes and Nash1994), Nash & Lowson (Reference Nash and Lowson1995), Nash (Reference Nash1996), Lowson, McAlpine & Nash (Reference Lowson, McAlpine and Nash1998) and Nash, Lowson & McAlpine (Reference Nash, Lowson and McAlpine1999), who investigated the phenomenon on a NACA 0012 airfoil. They concluded that a separation bubble sufficiently close to the trailing edge is a necessary condition for tonal noise generation. The existence of this flow topology has since been observed in more recent experimental studies with particle image velocimetry (PIV) (Pröbsting et al. Reference Pröbsting, Serpieri and Scarano2014) and numerical simulations (Desquesnes, Terracol, & Sagaut Reference Desquesnes, Terracol and Sagaut2007).
In the case of coherent and periodic disturbances in the boundary layer, introduced by laminar boundary layer instability (Tollmien–Schlichting) waves, a set of frequencies is selected by introduction of acoustic disturbances into the upstream boundary layer through a receptivity mechanism (acoustic feedback). With the distance between the maximum velocity point and the trailing edge denoted by
 $L_{f}$
and the speed of sound
 $c_{0}$
, the phase relation
 $$\begin{eqnarray}f_{n}^{+}=\frac{L_{f}f_{n}}{u_{\infty }}=\left(n+\frac{1}{2}\right)\frac{1}{u_{\infty }/u_{c}+u_{\infty }/(c_{0}-u_{\infty })}\end{eqnarray}$$
describes the selection of these discrete frequencies
 $f_{n}$
. Equation (1.2) can be obtained from the formulation of Arbey & Bataille (Reference Arbey and Bataille1983) by multiplication with the normalized convective velocity
 $u_{c}/u_{\infty }$
.
For an airfoil at zero incidence, Arbey & Bataille (Reference Arbey and Bataille1983) found good agreement for their experimental data with equation (1.2) when considering the distance between the maximum velocity point and the trailing edge for the definition of the feedback loop length
 $L_{f}$
. The feedback loop concept was further refined by implementing considerations based on linear stability theory by Kingan & Pearse (Reference Kingan and Pearse2009). It was also pointed out that the point of inception for the boundary layer instability is a more appropriate choice (Chong & Joseph Reference Chong and Joseph2012).
The difference in frequency between two such tones,
 ${\rm\Delta}f=f_{n+1}-f_{n}$
, results in a relation for the frequency spacing:
 $$\begin{eqnarray}{\rm\Delta}f^{+}=\frac{L_{f}{\rm\Delta}f}{u_{\infty }}=\frac{1}{u_{\infty }/u_{c}+u_{\infty }/(c_{0}-u_{\infty })}.\end{eqnarray}$$
Note that, for very small values of the Mach number (
 $\mathit{Ma}_{0}=u_{\infty }/c_{0}$
),
 $u_{\infty }/(c_{0}-u_{\infty })\ll 1$
, which is thus negligible compared to the ratio
 $u_{\infty }/u_{c}$
.
An empirical relation for
 ${\rm\Delta}f$
has been proposed by Arbey & Bataille (Reference Arbey and Bataille1983) for a NACA 0012 airfoil profile, where
 $K=0.37\,(\pm \,0.02)$
:
 $$\begin{eqnarray}{\rm\Delta}f^{+}=\frac{L_{f}{\rm\Delta}f}{u_{\infty }}\approx K\,\mathit{Ma}_{0}^{-0.15}.\end{eqnarray}$$
Substitution of this expression (1.4) for
 ${\rm\Delta}f^{+}$
into (1.2) provides also an empirical estimation for
 $f_{n}^{+}$
.
Recent studies gathered further evidence of the upstream effect of acoustic scattering (e.g. Takagi & Konishi Reference Takagi and Konishi2010; Arcondoulis et al.
Reference Arcondoulis, Doolan, Zander and Brooks2013; Chong & Joseph Reference Chong and Joseph2013; Pröbsting & Yarusevych Reference Pröbsting and Yarusevych2015). Takagi & Konishi (Reference Takagi and Konishi2010) demonstrated the effect of tonal noise emission on vortex shedding from the laminar separation bubble by installing a splitter plate. The absence of such stimulation resulted in a broadening of the energy content in unsteady surface pressure spectra. Further evidence for the presence of an acoustic feedback loop was presented in the recent studies of Schumacher, Doolan & Kelso (Reference Schumacher, Doolan and Kelso2014a
,Reference Schumacher, Doolan and Kelso
b
), who investigated an airfoil profile with an embedded cavity, where instability waves at tonal frequency were detected only downstream of the cavity. The frequency spacing
 ${\rm\Delta}f$
was found to be inversely proportional to the distance
 $L_{f}$
between the cavity and the trailing edge, as described by the model (1.3) and empirical relation (1.4) for the feedback loop. By modification of
 $L_{f}$
, the study thus provided strong support for the feedback hypothesis. While the effects of acoustic stimulation on upstream events have been demonstrated experimentally in the above studies, an open point of discussion is whether the existence of a feedback loop is a necessary condition for the occurrence of tonal noise. For instance, Nash et al. (Reference Nash, Lowson and McAlpine1999) proposed that large-scale hydrodynamic fluctuations could provide an alternative explanation for low-frequency variations of the vortex shedding and thus also provide an alternative explanation for the presence of multiple tones, not depending on an acoustic feedback loop.
The above-noted principal features have been acknowledged and described in a large number of studies. However, differences in the details of the ladder structure observed in different studies on the NACA 0012 airfoil profile have also been pointed out (Tam & Ju Reference Tam and Ju2012; Pröbsting et al.
Reference Pröbsting, Serpieri and Scarano2014). For instance, differences have been shown in the factor
 $k$
in (1.1), and also in the range of Reynolds numbers associated with a primary tone
 $f_{n_{max}}$
without undergoing transition to a different tone (different
 $n$
). Further discussion has focused on the question whether pressure-side events, suction-side events or their interaction are responsible for noise generation (Desquesnes et al.
Reference Desquesnes, Terracol and Sagaut2007; Pröbsting et al.
Reference Pröbsting, Serpieri and Scarano2014).
Various researchers (e.g. Paterson et al.
Reference Paterson, Vogt, Fink and Munch1973; Inasawa, Kamijo & Asai Reference Inasawa, Kamijo and Asai2010; Plogmann et al.
Reference Plogmann, Herrig and Würz2013; Pröbsting et al.
Reference Pröbsting, Serpieri and Scarano2014) have applied tripping devices, inducing bypass transition for the investigation of the phenomenon. For instance, Paterson et al. (Reference Paterson, Vogt, Fink and Munch1973) reported that tripping of the suction-side boundary layer had no effect, while application on the pressure side induced a reduction or elimination of the tonal noise. They concluded that tonal noise emission was associated with flow instabilities on the pressure side of the airfoil. In contrast, a study of Jones & Sandberg (Reference Jones and Sandberg2011) concludes that flow events on the suction side dominate noise emission. Based on flow visualization and acoustic measurements for an airfoil at
 $2^{\circ }$
, Inasawa et al. (Reference Inasawa, Kamijo and Asai2010) suggested that suction-side events are most important for the feedback loop at Reynolds numbers up to
 $2.1\times 10^{5}$
. The above observations suggest the existence of different regimes of tonal noise generation, which are dominated by either pressure-side events, suction-side events or their interaction. No previous study has focused on the conditions determining the dominant regime and the importance of possible interaction between events on the two sides. For further understanding and to clarify the differences in previous observations, it is therefore important to identify and categorize the regimes of tonal noise generation, which may bear significance for the underlying mechanism.
In most studies, especially with numerical simulations, the investigations are limited to a restricted range of flow conditions. This does not allow for a discussion about the influence of Reynolds number and angle of attack, although both parameters have a strong influence on the location and extent of separated flow regions and therefore also on the amplification mechanism of instability waves (Boutilier & Yarusevych Reference Boutilier and Yarusevych2012). To improve understanding of the differences in the observation of tonal noise emission due to laminar boundary layer instabilities at low to moderate Reynolds numbers, a survey of the acoustic and flow field characteristics over an extended range of flow conditions is thus required.
Most works focused on the NACA 0012 airfoil, on which most data were available. A review on the topic of laminar boundary layer instability noise, mostly focused on the NACA 0012, has been presented by Arcondoulis et al. (Reference Arcondoulis, Doolan, Zander and Brooks2010). A number of factors still hamper an unambiguous comparison in the low to moderate Reynolds number regime. In particular, the use of wind tunnels with open test sections makes the effective angle of incidence largely uncertain and a small blockage ratio is required to limit this effect. Experiments conducted in closed test sections experience resonance modes associated with the dimensions of the test section. This is problematic since the selection of tones through the feedback loop is influenced and tends to lock onto the tunnel resonance frequencies. The results of these facility-dependent effects are discrete tones, whose frequencies are independent of the reference velocity (Nash et al. Reference Nash, Lowson and McAlpine1999; Atobe, Tuinstra & Takagi Reference Atobe, Tuinstra and Takagi2009). Recent research efforts also focus on the effect of other installation effects, e.g. free-stream turbulence (Golubev et al. Reference Golubev, Nguyen, Mankbadi, Roger and Visbal2014).
Related to the present work, the study of Pröbsting et al. (Reference Pröbsting, Serpieri and Scarano2014) focused on a NACA 0012 profile at
 ${\it\alpha}=2^{\circ }$
, using high-speed PIV together with acoustic measurements, and related the periodic amplitude modulation of instability waves and resulting roll-up vortices to multiple tones in the acoustic spectrum through non-stationary spectral analysis. In particular, it was pointed out that a secondary feedback loop (Desquesnes et al.
Reference Desquesnes, Terracol and Sagaut2007) is not a necessary condition for such a periodic amplitude modulation. Nevertheless, these findings raised the question under what conditions events on the two sides of the airfoil and their interaction are relevant for overall noise emission. Furthermore, a detailed analysis of the acoustic emission requires measurements in an anechoic facility and a larger parameter space.
The present study is thus set to identify the regimes of tonal noise generation in the low to moderate Reynolds number regime (between
 $\mathit{Re}_{c}=0.3\times 10^{5}$
and
 $2.3\times 10^{5}$
), in particular for the NACA 0012 profile. The parametric study includes Reynolds number and incidence effects, and identifies the relative contribution of the flow events on the pressure side and suction side, and their contribution to overall noise generation. Extensive acoustic measurements were performed in an anechoic wind tunnel facility for geometric angles of attack between
 $0^{\circ }$
and
 $8^{\circ }$
. In conjunction with analysis of the flow field through PIV experiments, this investigation complements the picture of noise generation on isolated airfoils. Moreover, the results presented here help to interpret results from past research and provide a database for selecting flow conditions for future experiments and simulations. Preliminary results were presented at the 2014 International Congress on Sound and Vibration (Pröbsting & Scarano Reference Pröbsting and Scarano2014).
2. Experimental set-up
The airfoil model was produced from acrylic glass to perform simultaneous PIV measurements on both sides. The chord was
 $c=100~\text{mm}$
and the span
 $L=400~\text{mm}$
. Acoustic measurements were carried out in the Anechoic Wind Tunnel facility (AWT) at the University of Notre Dame, while PIV flow measurements were conducted in the Vertical-Tunnel facility (VT) at Delft University of Technology.
2.1. Acoustic measurements
The AWT is an open jet wind tunnel facility (area of exit nozzle
 $0.61\times 0.61~\text{m}^{2}$
). The walls of the room containing the test section are covered with anechoic foam wedges, rated to absorb 99 % of the acoustic power above
 $100~\text{Hz}$
. The inlet turbulence intensity has been measured and was found to be approximately 0.04 % (Mueller et al.
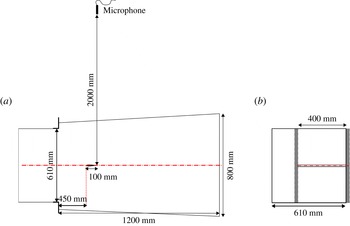
Reference Mueller, Scharpf, Batill, Strebinger, Sullivan and Subramanian1992). The model was mounted vertically between side plates with its quarter-chord point located
 $475~\text{mm}$
downstream of the exit nozzle figure 1. The quarter-chord point also constitutes the axis of rotation.
An ACO Pacific 7016 microphone with pre-amplifier was located in the mid-span plane at a distance of
 $2~\text{m}$
perpendicular to the chord at the streamwise position of the trailing edge with the airfoil at zero incidence. The analogue signal was amplified, high-pass-filtered (cut-off frequency
 $30~\text{Hz}$
) and sampled at a frequency of
 $40~\text{kHz}$
. A B&K 4228 piston phone was used for calibration at a single frequency. Measurements were performed over a range of angles of attack (
 ${\it\alpha}_{geo}=0{-}8^{\circ }\pm 0.15^{\circ }$
) and velocities between
 $u_{\infty }=5$
and
 $35~\text{m}~\text{s}^{-1}$
, resulting in chord-based Reynolds numbers between about
 $\mathit{Re}_{c}=0.3\times 10^{5}$
and
 $2.3\times 10^{5}$
and Mach numbers between
 $\mathit{Ma}_{0}=0.015$
and
 $0.1$
. The increments in free-stream velocity between the measurements were approximately
 $0.35~\text{m}~\text{s}^{-1}$
. At each measurement point (combination of angle of attack and velocity), data were acquired over a measurement period of
 $30~\text{s}$
. Between two measurement points a period of
 $15~\text{s}$
was allowed for adaptation of the airflow. Additionally, measurements without the model installed were taken to determine the background noise at all flow velocities.
Spectral analysis was conducted based on the modified periodogram method (Welch Reference Welch1967) with segments of
 $16\,384$
samples, windowed using a Hamming window, and an overlap of 50 %. The procedure results in spectra with a frequency resolution of
 ${\it\delta}_{f}=2.44~\text{Hz}$
and the average is evaluated over
 $145$
segments. The auto-spectral density of acoustic pressure is denoted by
 ${\it\Phi}_{aa}(f)$
and the corresponding narrowband sound pressure spectra by
 ${\it\delta}_{f}{\it\Phi}_{aa}(f)$
. If not stated otherwise, background noise spectra are subtracted.
Schematic of acoustic measurements set-up. Side view (a) and back view (b). Some elements are not drawn to scale.

Laminar to turbulent transition of the boundary layer is forced in some cases by means of randomly distributed three-dimensional (3D) roughness elements (carborundum, nominal grain size
 $0.58~\text{mm}$
) on a
 $10~\text{mm}$
wide strip attached to the airfoil at chord position
 $x/c=0.25$
. Measurements were performed with roughness elements on the pressure side only (denoted p.s. tripped), suction side only (s.s. tripped), both sides (both tripped) and with a smooth surface (smooth).
2.2. Flow field measurements
Planar, two-component PIV measurements were performed in the VT, a low-speed, open jet facility (test section diameter
 $0.6~\text{m}$
). Results are presented here for four geometric angles of attack (
 ${\it\alpha}_{geo}=0^{\circ }$
,
 $1^{\circ }$
,
 $2^{\circ }$
and
 $4^{\circ }$
) and the free-stream velocity
 $u_{\infty }$
varying between
 $20$
and
 $32~\text{m}~\text{s}^{-1}$
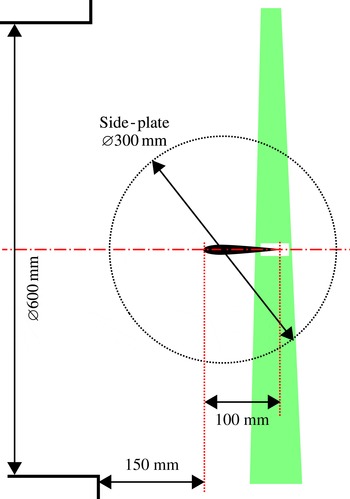
. The flow was restricted by side plates installed at both sides of the airfoil.
The measurement system consisted of a Litron Nd:YLF laser (dual cavity) and a Photron Fastcam SA 1.1 (
 $20~{\rm\mu}\text{m}$
pixel pitch,
 $5.4~\text{kHz}$
at
 $1024~\text{pixel}\times 1024~\text{pixel}$
) equipped with a Nikon Micro-Nikkor
 $200~\text{mm}$
objective. The light sheet was positioned in the mid-span plane, illuminating the field of view from one side of the airfoil. The field of view entailed an area of
 $32~\text{mm}\times 16~\text{mm}$
around the trailing edge and a sequence of
 $6970$
images were obtained with a digital imaging resolution of
 $32~\text{pixel}~\text{mm}^{-1}$
at an acquisition frequency of
 $6~\text{kHz}$
. The free-stream displacement of the tracer particles was approximately
 $15~\text{pixel}$
. A final interrogation window size of
 $16~\text{pixel}\times 16~\text{pixel}$
results in a window size of
 $0.5~\text{mm}\times 0.5~\text{mm}$
and an overlap of 75 % between neighbouring windows yields a vector spacing of
 $0.125~\text{mm}$
. Further details of the experiment can be found in Pröbsting et al. (Reference Pröbsting, Serpieri and Scarano2014). Figure 2 shows a schematic of the experimental set-up.
The coordinate system is chosen such that the
 $x$
coordinate indicates the free-stream flow direction, the
 $y$
coordinate indicates the transverse flow direction and the
 $z$
coordinate indicates the spanwise (PIV out-of-plane) direction. The origin remains fixed to the trailing edge of the airfoil.
Schematic of PIV experimental set-up.

2.3. Effective angle of attack
A lift-generating airfoil placed in an open jet induces a deflection of the open jet boundaries, which is not representative of an infinite domain or free flight conditions. The conditions to neglect this boundary interference involve a small blockage ratio (Brooks, Marcolini & Pope Reference Brooks, Marcolini and Pope1986). An effective angle of attack can be defined by matching the lift coefficients found for experimental conditions in the wind tunnel to their infinite-domain equivalents: the angle for which in free flight conditions the same lift coefficient is obtained as in the experiment for a given geometric angle of attack
 ${\it\alpha}_{geo}$
(also denoted
 ${\it\alpha}$
here) is said to be the effective angle of attack
 ${\it\alpha}_{eff}$
. Based on lifting surface theory, Brooks et al. (Reference Brooks, Marcolini and Pope1986) proposed a semi-empirical relationship between the effective and geometric angles of attack as a function of the ratio of airfoil chord
 $c$
and width of the open jet
 $H$
, with
 ${\it\sigma}=({\rm\pi}^{2}/48)(c/H)^{2}$
:
 $$\begin{eqnarray}{\it\alpha}_{eff}=\frac{{\it\alpha}_{geo}}{(1+2{\it\sigma})^{2}+\sqrt{12{\it\sigma}}}.\end{eqnarray}$$
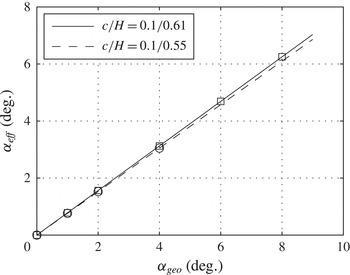
For the case of a NACA 0012, the same authors have shown that this relationship leads to acceptable results. Figure 3 shows the effective angle of attack for the
 $100~\text{mm}$
chord NACA 0012 in the two open jet wind tunnels employed in the present study. For the round test section in the PIV experiments, the linear dimension has been computed from the area over the central
 $400~\text{mm}$
covered by the span of the airfoil. The relatively large ratio
 $H/c\approx 6$
in the present experiments results in a moderate correction (
 ${\it\alpha}_{eff}/{\it\alpha}_{geo}\approx 0.78$
) when compared to many previous studies (Nash et al.
Reference Nash, Lowson and McAlpine1999; Arcondoulis, Doolan & Zander Reference Arcondoulis, Doolan and Zander2009; Chong & Joseph Reference Chong and Joseph2012).
Estimated effective angle of attack based on (2.1) for AWT (solid line) and VT (dashed). The symbols indicate the discrete values of the angle of attack in the experiments.

It should be noted that the same lift coefficient can be the result of a set of different pressure distributions over the airfoil’s surface. For cases where tonal noise emission is related to the transition process through a separation region, the details of the pressure distributions are important. Moreau & Henner (Reference Moreau and Henner2003) numerically investigated this influence for a number of profiles and commented that the pressure distribution in the case of the NACA 0012 matched that of the infinite domain at the effective angle of attack comparatively closely. This was not the case for other airfoil profiles. The above correction (2.1) has been applied before, for instance in the studies of Arcondoulis et al. (Reference Arcondoulis, Doolan and Zander2009) and Chong & Joseph (Reference Chong and Joseph2012), but not in earlier ones, for instance Paterson et al. (Reference Paterson, Vogt, Fink and Munch1973).
3. Results and discussion
3.1. Noise generated by smooth airfoil
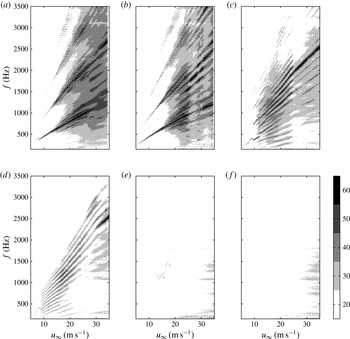
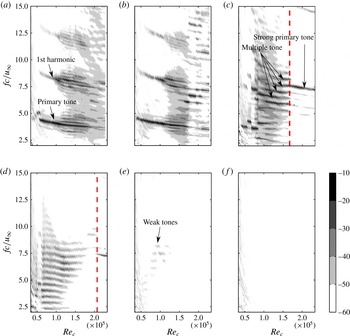
Figure 4 shows contour plots of the narrowband sound pressure level (SPL) as functions of free-stream velocity and angle of attack. Both parameters have a substantial influence on noise emission.
At
 ${\it\alpha}=0^{\circ }$
(figure 4
a) a strong primary tone at frequency
 $f_{n_{max}}$
with upper harmonics is present, similar to the results of the simulation results by Tam & Ju (Reference Tam and Ju2012). With increasing free-stream velocity (about
 $u_{\infty }>15~\text{m}~\text{s}^{-1}$
) side tones appear at a frequency spacing
 ${\rm\Delta}f$
above and below the primary tone frequency, but one order lower than the latter. In contrast to the higher-Reynolds-number results of Arbey & Bataille (Reference Arbey and Bataille1983), a clear ladder structure including transitions of the primary tone is not observed at
 ${\it\alpha}=0^{\circ }$
. The reader should note that the condition of geometric angle of attack
 ${\it\alpha}=0^{\circ }$
is sensitive to asymmetry in the experimental set-up and finite accuracy of
 $\pm 0.15^{\circ }$
.
At
 ${\it\alpha}=1^{\circ }$
(figure 4
b) the spectrum is still similar to the one at
 ${\it\alpha}=0^{\circ }$
for
 $u_{\infty }<15~\text{m}~\text{s}^{-1}$
(
 $\mathit{Re}_{c}<1\times 10^{5}$
). For
 $u_{\infty }>20~\text{m}~\text{s}^{-1}$
, side tones become comparatively more pronounced and transition of the maximum intensity from one tone to another (different
 $n$
) is observed.
Narrowband SPL (in
 $\text{dB}$
, reference
 $20~{\rm\mu}\text{Pa}$
) as a function of free-stream velocity and frequency for varying angles of attack (smooth airfoil): (a)
 ${\it\alpha}=0^{\circ }$
; (b)
 $1^{\circ }$
; (c)
 $2^{\circ }$
; (d)
 $4^{\circ }$
; (e)
 $6^{\circ }$
; and (f)
 $8^{\circ }$
.

At
 ${\it\alpha}=2^{\circ }$
(figure 4
c), the side tone structure is particularly pronounced between 10 and
 $24~\text{m}~\text{s}^{-1}$
(
 $\mathit{Re}_{c}=0.7\times 10^{5}$
to
 $1.6\times 10^{5}$
). Here, side tones are of similar intensity when compared to the primary tone. Their intensity is highest for the frequency band between the fundamental frequency and first harmonic of the primary tone at
 ${\it\alpha}=0^{\circ }$
(figure 4
a). Such pronounced side tone structure has been associated with periodic amplitude modulation with a frequency equal to the frequency spacing
 ${\rm\Delta}f$
(Desquesnes et al.
Reference Desquesnes, Terracol and Sagaut2007; Pröbsting et al.
Reference Pröbsting, Serpieri and Scarano2014). The spectrum changes markedly with further increase in Reynolds number (
 $u_{\infty }>24~\text{m}~\text{s}^{-1}$
,
 $\mathit{Re}_{c}>1.6\times 10^{5}$
): a strong primary tone with weaker side tones replaces the pronounced side tone structure. The frequency of the primary tone is then close to that of the first harmonic of the primary tone at zero incidence (figure 4
a). Side tones at frequency lower than that of the primary tone are stronger than those at higher frequencies. Compared to lower velocity (
 $u_{\infty }<24~\text{m}~\text{s}^{-1}$
), the rate of increase of the tonal frequency
 $f_{n}$
with free-stream velocity is smaller.
A similar division of the velocity domain is observed at higher angle of attack (
 ${\it\alpha}=4^{\circ }$
, figure 4
d). Here, the marked change occurs at higher velocity (
 $u_{\infty }=30~\text{m}~\text{s}^{-1}$
) and, as for
 ${\it\alpha}=2^{\circ }$
, the rate of increase of
 $f_{n}$
changes when compared to
 $u_{\infty }<30~\text{m}~\text{s}^{-1}$
.
At
 ${\it\alpha}=6^{\circ }$
(figure 4
e), only weak traces of the tone pattern remain, approximately
 $30~\text{dB}$
below the maximum intensity at
 ${\it\alpha}=2^{\circ }$
, over a restricted range
 $10~\text{m}~\text{s}^{-1}<u_{\infty }<20~\text{m}~\text{s}^{-1}$
. A primary tone at higher Reynolds numbers is not observed here. However, tones are likely to occur at higher Reynolds numbers at
 ${\it\alpha}_{eff}=4.7^{\circ }$
, as data available in the literature suggest (Paterson et al.
Reference Paterson, Vogt, Fink and Munch1973; Lowson et al.
Reference Lowson, Fiddes and Nash1994; Plogmann et al.
Reference Plogmann, Herrig and Würz2013). In combination with these previous studies, the observations here suggest that, for an intermediate range of Reynolds numbers, no tones are generated, while this may well be the case above and below this range. Measurements at
 ${\it\alpha}=8^{\circ }$
(figure 4
f) show no indications of tones.
Figure 5 introduces a non-dimensional representation of the acoustic spectra (figure 4) as a function of Reynolds number
 $\mathit{Re}_{c}$
and dimensionless frequency
 $fc/u_{\infty }$
. The measured far-field auto-spectral density of the acoustic pressure
 ${\it\Phi}_{aa}$
is normalized and scaled by means of the free-stream dynamic pressure (
 ${\it\rho}/2u_{\infty }^{2}$
), frequency (
 $u_{\infty }/c$
), a term accounting for the airfoil span
 $L$
, and the distance between the trailing edge and the microphone
 $r$
(
 $cL/r^{2}$
). Additionally, a factor
 $1/\mathit{Ma}_{0}^{2}$
accounts for the radiation efficiency of a compact dipole. The vertical lines drawn in the figures for the cases of
 ${\it\alpha}=2^{\circ }$
(figure 5
c) and
 $4^{\circ }$
(figure 5
d) indicate the transition between the two regimes discussed above.
In conclusion, tones are present in spectra for angles of attack
 ${\it\alpha}\leqslant 6^{\circ }$
. Striking changes within the spectra, occurring over narrow ranges of Reynolds numbers at
 ${\it\alpha}=2^{\circ }$
and
 $4^{\circ }$
, suggest that fundamental differences exist in the noise generation at the respective flow conditions. Additionally, weak tones are observed at
 $6^{\circ }$
and have not been reported in experiments at such large incidence and low Reynolds number.
3.2. Noise generated under forced transition
A tripping device on the airfoil promotes transition to turbulence and leads to a turbulent boundary layer reaching the trailing edge. Noise emitted due to a turbulent boundary layer is of broadband nature and tones are suppressed. Forcing transition on either of the two sides is an expedient to reveal the contribution of events on the other side, respectively, to overall noise generation. Provided that events on the two sides of the smooth airfoil are sufficiently uncorrelated, superposition of the individually tripped cases is expected to compare well to the smooth airfoil. Otherwise, interaction or coupling between events on the two sides of the smooth airfoil substantially influences noise emission. For instance, Paterson et al. (Reference Paterson, Vogt, Fink and Munch1973) and Nash et al. (Reference Nash, Lowson and McAlpine1999) followed a similar procedure and came to the conclusion that pressure-side events are responsible for tonal noise generation. In contrast, Inasawa et al. (Reference Inasawa, Kamijo and Asai2010) emphasized the importance of suction-side events for a NACA 0012 at
 ${\it\alpha}=2^{\circ }$
and
 $\mathit{Re}_{c}<1.6\times 10^{5}$
.
Non-dimensional auto-spectral density of acoustic pressure
 $10\times \log _{10}[4r^{2}{\it\Phi}_{aa}/(c^{2}S{\it\rho}^{2}u_{\infty }^{3}\mathit{Ma}_{0}^{2})]$
as a function of
 $\mathit{Re}_{c}$
and
 $fc/u_{\infty }$
(smooth airfoil). Dashed line indicates transition of tonal noise regimes: (a)
 ${\it\alpha}=0^{\circ }$
; (b)
 $1^{\circ }$
; (c)
 $2^{\circ }$
; (d)
 $4^{\circ }$
; (e)
 $6^{\circ }$
; and (f)
 $8^{\circ }$
.

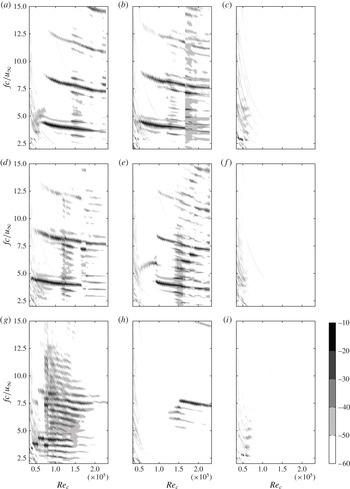
Non-dimensional auto-spectral density of acoustic pressure
 $10\times \log _{10}[4r^{2}{\it\Phi}_{aa}/(c^{2}S{\it\rho}^{2}u_{\infty }^{3}\mathit{Ma}_{0}^{2})]$
as a function of
 $\mathit{Re}_{c}$
and
 $fc/u_{\infty }$
for geometric angles of attack
 ${\it\alpha}=0^{\circ }$
,
 $1^{\circ }$
and
 $2^{\circ }$
with the pressure side tripped (a,d,g), the suction side tripped (b,e,h) and both sides tripped (c,f,i).

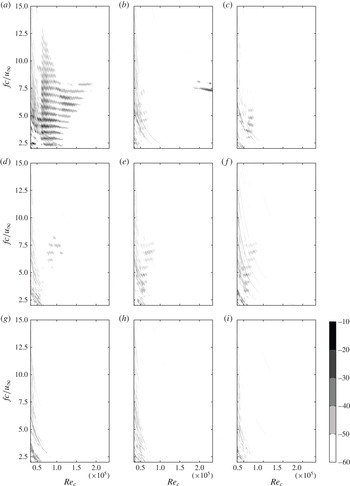
Non-dimensional auto-spectral density of acoustic pressure
 $10\times \log _{10}[4r^{2}{\it\Phi}_{aa}/(c^{2}S{\it\rho}^{2}u_{\infty }^{3}\mathit{Ma}_{0}^{2})]$
as a function of
 $\mathit{Re}_{c}$
and
 $fc/u_{\infty }$
for geometric angles of attack
 ${\it\alpha}=4^{\circ }$
,
 $6^{\circ }$
and
 $8^{\circ }$
with the pressure side tripped (a,d,g), the suction side tripped (b,e,h) and both sides tripped (c,f,i).

Figures 6 and 7 show the auto-spectral density of acoustic pressure for angles of attack
 ${\it\alpha}=0^{\circ }$
to
 $8^{\circ }$
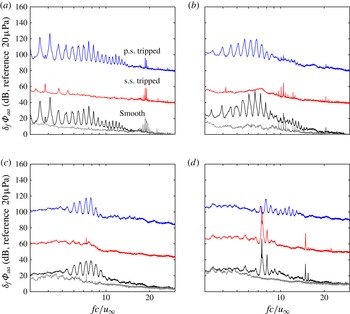
with the pressure side tripped (a,d,g), the suction side tripped (b,e,h) and both sides tripped (c,f,i). These spectra can be compared to those for the smooth airfoil in figure 4. In addition, figures 8 and 9 show a comparison of the narrowband SPL of the smooth and single-sided tripped cases for selected Reynolds numbers at
 ${\it\alpha}=2^{\circ }$
and
 $4^{\circ }$
, respectively.
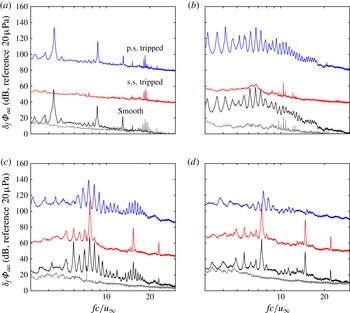
Narrowband SPL
 ${\it\delta}_{f}{\it\Phi}_{aa}$
(
 $\text{dB}$
, reference
 $20~{\rm\mu}\text{Pa}$
),
 ${\it\alpha}=2^{\circ }$
. Spectra with the suction and pressure side tripped are offset by
 $40~\text{dB}$
and
 $80~\text{dB}$
, respectively: (a)
 $\mathit{Re}_{c}=0.6\times 10^{5}$
; (b)
 $1.1\times 10^{5}$
; (c)
 $1.6\times 10^{5}$
; and (d)
 $2.1\times 10^{5}$
.

With both sides tripped (figures 6
c,f,i and 7
c,f,i), no tones are observed for
 $\mathit{Re}_{c}>0.7\times 10^{5}$
, confirming the effectiveness of the applied tripping device over this range. The tripping device on the suction side is not consistently effective for
 $\mathit{Re}_{c}<0.7\times 10^{5}$
, probably due to early separation.
At
 ${\it\alpha}=0^{\circ }$
, the spectra for the two tripped cases (figure 6
a,b) are similar, yet not identical, as expected for a symmetric airfoil profile. The onset of tones, primary tone frequency and the frequency spacing of side tones show good agreement. The differences are due to asymmetry in the experimental conditions or finite accuracy in adjusting the angle of attack (
 $\pm 0.15^{\circ }$
). Side tones are better defined and the broadband noise level is lower compared to the smooth configuration (figure 5
a), which is probably related to interaction or coupling of the events on the two sides of the smooth airfoil.
At
 $1^{\circ }$
, with the pressure side tripped (figure 6
d), the onset of the primary tone is found at a distinctly lower Reynolds number (
 $\mathit{Re}_{c}<0.5\times 10^{5}$
) when compared to the smooth airfoil case (figure 5
b) and that with the suction side tripped (figure 6
e). In the latter case, this onset is delayed to
 $\mathit{Re}_{c}\approx 1\times 10^{5}$
.
At higher angle of attack (
 ${\it\alpha}=2^{\circ }$
, figure 6
g,h), the difference between the two tripped cases becomes more apparent. With forced transition on the pressure side (figure 6
g), multiple closely spaced tones are present. This pattern is almost identical to that found for the smooth airfoil at low Reynolds number (figure 5
c, to the left of dashed line). The strong primary tone observed for the smooth airfoil at high Reynolds number (figure 5
c, to the right of dashed line) appears when transition is forced on the suction side (figure 6
h).
Narrowband SPL
 ${\it\delta}_{f}{\it\Phi}_{aa}$
(
 $\text{dB}$
, reference
 $20~{\rm\mu}\text{Pa}$
),
 ${\it\alpha}=4^{\circ }$
. Spectra with the suction and pressure side tripped are offset by
 $40~\text{dB}$
and
 $80~\text{dB}$
, respectively: (a)
 $\mathit{Re}_{c}=0.6\times 10^{5}$
; (b)
 $1.1\times 10^{5}$
; (c)
 $1.6\times 10^{5}$
; and (d)
 $2.1\times 10^{5}$
.

Figure 8 illustrates this transition from suction- to pressure-side-dominated tonal noise emission. Figure 8(a,b) shows suction-side-dominated cases, and the tonal frequencies agree closely for the pressure-side-tripped and smooth airfoils. Figure 8(d) shows a pressure-side-dominated case, and close agreement of the tonal frequencies is found for the suction-side-tripped and smooth airfoils. A special case is found at intermediate Reynolds number in figure 8(c), where the overall spectral shape with a multitude of tones suggests a suction-side-dominated case, but close inspection reveals that the primary and secondary tone frequencies are determined by pressure-side events. This small shift in frequency might be evidence of acoustic interaction through a secondary feedback loop (Desquesnes et al. Reference Desquesnes, Terracol and Sagaut2007).
Similarly, the spectra for the tripped cases at
 ${\it\alpha}=4^{\circ }$
(figure 7
a,b) combine to that for the smooth airfoil (figure 5
d). Figure 9 shows the spectra for several Reynolds numbers and, in contrast to
 ${\it\alpha}=2^{\circ }$
, transition to a pressure-side-dominated case is only observed at the highest Reynolds number.
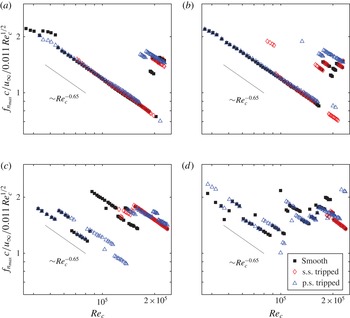
Non-dimensional primary tone frequency against Reynolds number for geometric angles of attack
 ${\it\alpha}=0^{\circ }$
(a),
 $1^{\circ }$
(b),
 $2^{\circ }$
(c) and
 $4^{\circ }$
(d).

The division in pressure- and suction-side-dominated regimes continues with higher angle of attack (
 $6^{\circ }$
, figure 7
d,e). With the pressure side tripped, tones for the range of Reynolds numbers investigated here are almost identical to those found for the smooth airfoil (figure 5
e). Extrapolating the trends observed for
 $2^{\circ }$
and
 $4^{\circ }$
with tripped suction side (figures 6
h and 7
b), the onset of a strong primary tone is expected at higher Reynolds number, which is corroborated by previous studies under such conditions (Paterson et al.
Reference Paterson, Vogt, Fink and Munch1973; Nash et al.
Reference Nash, Lowson and McAlpine1999; Plogmann et al.
Reference Plogmann, Herrig and Würz2013). As for the smooth airfoil, no tones are present for the tripped cases at
 ${\it\alpha}=8^{\circ }$
(figure 7
g,h).
3.3. Regimes of tonal noise generation
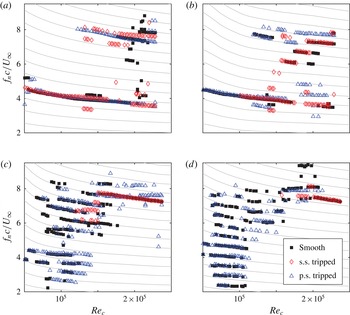
As discussed before (figure 4), the acoustic spectrum is dominated by a primary tone over significant ranges of Reynolds numbers and angles of attack. Figure 10 depicts this primary tone frequency
 $f_{n_{max}}$
, which is identified by the maximum auto-spectral density
 ${\it\Phi}_{aa}$
at least
 $15~\text{dB}$
above the background noise level. The frequency
 $f_{n_{max}}$
is normalized by the expression for
 $f_{s}$
given in (1.1), i.e. by the average development of the primary tone frequency proposed by Paterson et al. (Reference Paterson, Vogt, Fink and Munch1973). In this representation, unity indicates the mean trend of the primary tone frequency, scaling with
 $u_{\infty }^{1.5}$
. The slope corresponding to the frequency scaling of individual tonal components with
 $u_{\infty }^{m}$
and
 $m=0.85$
(
 ${\sim}\mathit{Re}_{c}^{-0.65}$
) is indicated by the solid line. Exponents in the range
 $0.8<m<0.85$
have been reported previously (Paterson et al.
Reference Paterson, Vogt, Fink and Munch1973; Arbey & Bataille Reference Arbey and Bataille1983; Arcondoulis et al.
Reference Arcondoulis, Doolan and Zander2009; Chong & Joseph Reference Chong and Joseph2012).
At zero incidence (
 ${\it\alpha}=0^{\circ }$
, figure 10
a) and low Reynolds number (
 $\mathit{Re}_{c}<10^{5}$
), the primary tone frequency follows the variation with
 $\mathit{Re}_{c}^{-0.65}$
. For the airfoil with the suction side tripped, this scaling can also be found at higher angle of attack (figure 10
b–d) and at high Reynolds number. In contrast, the airfoil with the pressure side tripped shows a significantly different scaling behaviour with increasing angle of attack, approaching
 $u_{\infty }^{1}$
(
 ${\sim}\mathit{Re}_{c}^{-0.5}$
) at
 ${\it\alpha}=4^{\circ }$
(figure 10
d). For the smooth airfoil, the frequency scaling adapts to that of the pressure- and suction-side tripped cases at low and high Reynolds numbers, respectively.
For the smooth airfoil and at all angles of incidence (figure 10
a–d), at least one transition can be identified that can be interpreted as a rung of a ladder structure. At
 ${\it\alpha}=0^{\circ }$
this transition at
 $\mathit{Re}_{c}=2\times 10^{5}$
corresponds almost to a doubling in frequency (transition to upper harmonic). The airfoil at larger angle of attack (
 ${\it\alpha}=2^{\circ }$
, figure 10
c) shows multiple transitions. The most pronounced ladder-like variation is found at
 ${\it\alpha}=4^{\circ }$
(figure 10
d), where the trend of the primary tone frequency follows that (
 $u_{\infty }^{1.5}$
) observed by Paterson et al. (Reference Paterson, Vogt, Fink and Munch1973) comparatively closely, and as a result multiple transitions are present. Data in previous reports suggest that the ladder structure is primarily associated with higher Reynolds number (Paterson et al.
Reference Paterson, Vogt, Fink and Munch1973; Arbey & Bataille Reference Arbey and Bataille1983; Chong & Joseph Reference Chong and Joseph2012) and thus pressure-side-dominated cases. However, other studies claim that no such ladder structure exists even at high Reynolds number (Nash et al.
Reference Nash, Lowson and McAlpine1999). In any case, a fine ladder structure is not evident for low Reynolds number at low angle of attack, as figure 10 shows.
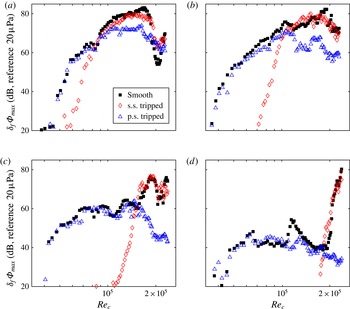
Narrowband SPL of primary tone (at frequency
 $f_{n_{max}}$
, figure 10) against velocity for geometric angles of attack
 ${\it\alpha}=0^{\circ }$
(a),
 $1^{\circ }$
(b),
 $2^{\circ }$
(c) and
 $4^{\circ }$
(d).

Figure 11 shows the auto-spectral density
 ${\it\Phi}_{max}$
corresponding to the primary tone frequencies (figure 10). Good agreement of
 ${\it\Phi}_{max}$
at low Reynolds number for the smooth and suction-side tripped airfoil give further evidence that suction-side events dominate tonal noise emission at low Reynolds number. At
 ${\it\alpha}=1^{\circ }$
(figure 11
b), this transition is found at about
 $\mathit{Re}_{c}\approx 10^{5}$
and shifts towards higher Reynolds number with increasing angle of attack. For instance, at
 ${\it\alpha}=2^{\circ }$
(figure 11
c) and
 ${\it\alpha}=4^{\circ }$
(figure 11
d), the transition is found at about
 $\mathit{Re}_{c}=1.5\times 10^{5}$
and
 $\mathit{Re}_{c}=1.8\times 10^{5}$
, respectively. In agreement with this value for
 ${\it\alpha}=2^{\circ }$
, the data reported by Inasawa et al. (Reference Inasawa, Kamijo and Asai2010) indicate that transition between suction- and pressure-side-dominated regimes occurs between
 $\mathit{Re}_{c}=1.3\times 10^{5}$
and
 $\mathit{Re}_{c}=2.1\times 10^{5}$
. After transition, the SPL associated with the primary tone for the smooth and the suction-side tripped cases shows better agreement. Thus, regimes exist where events on a single side of the airfoil dominate tonal noise generation.
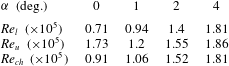
The comparison here suggests the definition of a characteristic Reynolds number
 $\mathit{Re}_{ch}$
separating two regimes: the Reynolds number at which the auto-spectral density related to the isolated pressure side (observed for airfoil with the suction side tripped) supersedes that associated with suction-side events (pressure side tripped). In summary, one can thus define suction-side-dominated and pressure-side-dominated regimes based on a characteristic Reynolds number
 $\mathit{Re}_{ch}$
. For
 $\mathit{Re}_{c}<\mathit{Re}_{ch}$
tonal noise emission is primarily influenced by suction-side events, while for
 $\mathit{Re}_{c}>\mathit{Re}_{ch}$
, instead, tonal noise emission is dominated by pressure-side events. The
 $\mathit{Re}_{ch}$
value is strongly dependent on the angle of attack. There is evidence of an intermediate regime, where the primary tone frequency can deviate from that of the isolated cases.
Figure 11 shows that the difference in narrowband SPL of the acoustic pressure for tones generated by pressure-side events increases rapidly for
 $\mathit{Re}_{c}>\mathit{Re}_{ch}$
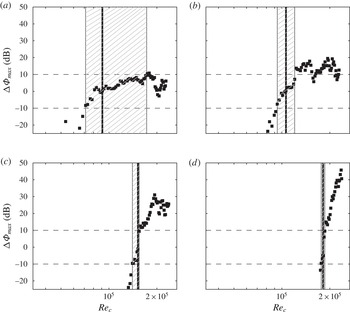
. This rapid increase is due to the different rates at which the SPL for the pressure- and suction-side tripped cases change. With larger angle of attack, the difference in the rate of change becomes larger and, as a result, the transition from the suction- to the pressure-side-dominated regime occurs over a smaller range of Reynolds numbers. In other words, the overlap region between the two regimes becomes smaller. To illustrate the latter, figure 12 shows the difference in narrowband SPL
 ${\rm\Delta}{\it\Phi}_{max}$
associated with the primary tone in the pressure- and suction-side tripped cases. As defined above, the characteristic Reynolds
 $\mathit{Re}_{ch}$
number is the Reynolds number where this difference approaches zero (indicated by the vertical line). This characteristic Reynolds number increases with angle of attack from
 $\mathit{Re}_{ch}=1\times 10^{5}$
at
 ${\it\alpha}=1^{\circ }$
(figure 12
b) to
 $\mathit{Re}_{ch}=1.8\times 10^{5}$
at
 ${\it\alpha}=4^{\circ }$
(figure 12
d). The range of Reynolds numbers where this difference is within
 $\pm 10~\text{dB}$
is bound by a lower limit
 $\mathit{Re}_{l}$
and an upper limit
 $\mathit{Re}_{u}$
(hatched region, dashed horizontal lines). Table 1 lists the characteristic Reynolds number
 $\mathit{Re}_{ch}$
together with the limits
 $\mathit{Re}_{l}$
and
 $\mathit{Re}_{u}$
. The difference between the limits
 ${\rm\Delta}\mathit{Re}=\mathit{Re}_{u}-\mathit{Re}_{l}$
provides a measure for the extent of the overlap of the two regimes. This overlap decreases with increasing angle of attack from
 ${\rm\Delta}\mathit{Re}=0.26\times 10^{5}$
at
 ${\it\alpha}=1^{\circ }$
(figure 12
b) to
 ${\rm\Delta}\mathit{Re}=0.05\times 10^{5}$
at
 ${\it\alpha}=4^{\circ }$
(figure 12
d). Thus, at higher angle of attack possible interaction or coupling between events on the two sides of the airfoil is confined to a smaller range of Reynolds numbers.
The reader should note that the case
 ${\it\alpha}=0^{\circ }$
has been left out of the above discussion. Potential asymmetries in the experimental set-up and finite accuracy in setting the geometric angle of attack
 ${\it\alpha}=0\pm 0.15^{\circ }$
are probably the cause of the finite overlap region observed in figure 12(a). Ideally, for a symmetric airfoil, the overlap region should extend over the entire tonal noise regime in such a symmetric condition.
Difference of narrowband SPL at frequency at primary tone frequency between cases with the pressure and suction sides tripped. The characteristic Reynolds number (vertical line) and overlap region (hatched) are indicated:
 ${\it\alpha}=0^{\circ }$
(a),
 $1^{\circ }$
(b),
 $2^{\circ }$
(c) and
 $4^{\circ }$
(d).

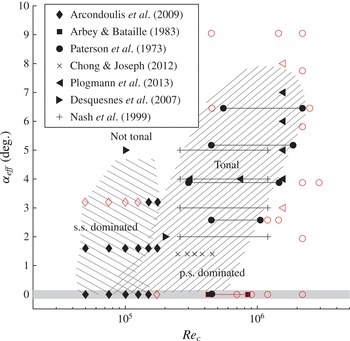
Figure 13 shows the two regimes of tonal noise generation relative to the effective angle of attack
 ${\it\alpha}_{eff}$
(2.1) and Reynolds number
 $\mathit{Re}_{c}$
. Measurements acquired in the present study are depicted for tonal (filled symbols) and non-tonal (open symbols) cases. Tonal cases are identified as such if the background subtracted narrowband SPL
 ${\it\delta}_{f}{\it\Phi}_{aa}$
of the primary tone exceeds
 $25~\text{dB}$
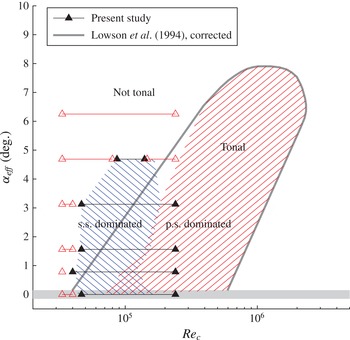
(figure 11). This typically coincides with a sharp rise in noise level. Lowson et al. (Reference Lowson, Fiddes and Nash1994) suggested a limit of tonal noise generation, compiled from experimental data of Paterson et al. (Reference Paterson, Vogt, Fink and Munch1973) (high-Reynolds-number limit) and Brooks, Pope & Marcolini (Reference Brooks, Pope and Marcolini1989) (low-Reynolds-number limit). However, it appears that they considered the geometric angle of attack, at least for the data of Paterson et al. (Reference Paterson, Vogt, Fink and Munch1973). Therefore, the angle of attack correction (2.1) with the data of Paterson et al. (Reference Paterson, Vogt, Fink and Munch1973) is also applied to the envelope (grey, solid line). The simply hatched regions indicate the two regimes of suction- and pressure-side-dominated noise generation, respectively, where the high-Reynolds-number limit of the pressure-side-dominated regime is inferred from the envelope of Lowson et al. (Reference Lowson, Fiddes and Nash1994). The overlap region has been defined in table 1 and is represented in figure 13 by the cross-hatched region. It is interesting to note the divergence of suction- and pressure-side-dominated regimes at higher angles of attack (
 ${\it\alpha}_{eff}\geqslant 3.5^{\circ }$
), which allows for the existence of an intermediate non-tonal regime.
Regimes of tonal noise generation on a NACA 0012: the solid line shows the limit of tonal noise generation on the pressure side (adapted from Lowson et al. Reference Lowson, Fiddes and Nash1994). Suction- (blue, hatched) and pressure-side-dominated regimes (red, hatched). Experiments showing tonal (solid symbols) and non-tonal noise (open symbols) for the present study.

Characteristic Reynolds number
 $\mathit{Re}_{ch}$
and limits over the overlap region,
 $\mathit{Re}_{l}$
and
 $\mathit{Re}_{u}$
.

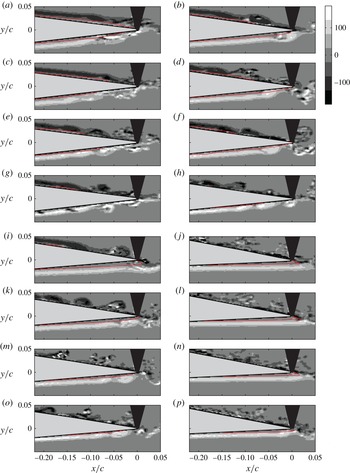
Spanwise vorticity component (
 ${\it\omega}_{z}c/u_{\infty }$
) and indication of reverse flow region (line at
 $u/u_{\infty }=0$
) for several angles of attack ((a,c,e,g)
 ${\it\alpha}=0^{\circ }$
; (b,d,f,h)
 $1^{\circ }$
; (i,k,m,o)
 $2^{\circ }$
; (j,l,n,p)
 $4^{\circ }$
) and Reynolds numbers ((a,b,i,j)
 $\mathit{Re}=1.33\times 10^{5}$
; (c,d,k,l)
 $1.6\times 10^{5}$
; (e,f,m,n)
 $1.9\times 10^{5}$
; (g,h,o,p)
 $2.1\times 10^{5}$
). Smooth airfoil with the pressure side at the bottom (
 $y<0$
) and the suction side on the top (
 $y>0$
).

3.4. Flow structure and relation to different regimes
To understand the origin of tonal noise and its relation to the different flow regimes, the structure of the flow field in the proximity of the trailing edge needs to be considered. Figure 14 shows an instantaneous realization of the spanwise vorticity component around the trailing edge of the smooth airfoil for
 ${\it\alpha}=0^{\circ }$
–
 $4^{\circ }$
and Reynolds numbers between
 $\mathit{Re}_{c}=1.3\times 10^{5}$
and
 $2.1\times 10^{5}$
. In addition, the reverse flow region is indicated (identified by
 $u/u_{\infty }=0$
, solid line) on both pressure and suction sides, and marks the position of the separation bubble or separated shear layer. Nash et al. (Reference Nash, Lowson and McAlpine1999) postulated that the existence of a separation bubble close to the trailing edge is a necessary condition for the generation of tonal noise. Here, a separation bubble or separated shear layer is observed in all cases. For a given Reynolds number, separation on the suction side is expected to shift upstream with increasing angle of attack due to an increasingly adverse pressure gradient. For the pressure side, the opposite holds true, and the separation point moves downstream. For a given angle of attack, the separation bubble becomes smaller and shorter with increasing Reynolds number (Boutilier & Yarusevych Reference Boutilier and Yarusevych2012).
The instantaneous flow structure shows a marked dependence upon Reynolds number and an even stronger dependence on angle of attack. At near zero incidence (
 ${\it\alpha}=0^{\circ }$
, figure 14
a,c,e,g), the flow pattern is comparatively, yet not perfectly, symmetric, with roll-up vortices reaching the trailing edge on the two sides. These vortical structures are the result of amplified unstable waves in the laminar boundary layer and roll-up over the separated shear layer. Acoustic feedback locks the shedding frequency of these structures, which in turn induce periodic unsteady surface pressure fluctuations, on the frequency of the primary tone (Pröbsting et al.
Reference Pröbsting, Serpieri and Scarano2014). Amiet (Reference Amiet1976) related the acoustic pressure in the far field to the statistics of the unsteady surface pressure field near the trailing edge. The periodic nature of these fluctuations thus results in the strong characteristic tones. Along with a shift of reattachment to an upstream location, the roll-up of vortical structures occurs further upstream with increasing Reynolds number.
Changing the angle of attack to
 ${\it\alpha}=1^{\circ }$
(figure 14
b,d,f,h) introduces a distinct change in the instantaneous flow structure. Instability waves on the suction side amplify further upstream, while on the pressure side a shift downstream is observed. These shifts are related to changes of separation and reattachment location with angle of attack. While at low Reynolds number (
 $\mathit{Re}_{c}=1.3\times 10^{5}$
) the structures on both sides are similarly coherent near the trailing edge, early amplification and eventual 3D breakdown cause a reduction in coherence on the suction side at high Reynolds number (
 $\mathit{Re}_{c}=2.1\times 10^{5}$
). Amplification on the pressure side is delayed and occurs closer to the trailing edge, thus strongly coherent pressure-side events will start to dominate the tonal noise generation process.
The asymmetry between the events on the two sides becomes larger with increasing angle of attack (
 ${\it\alpha}=2^{\circ }$
, figure 14
i,k,m,o). At low Reynolds number (
 $\mathit{Re}_{c}=1.3\times 10^{5}$
), strongly coherent events on the suction side are visible and, as discussed before (figure 13), dominate tonal noise generation under these conditions. Increasing Reynolds number (
 $\mathit{Re}_{c}=1.6\times 10^{5}$
) implies earlier amplification on the pressure side and further progress of transition on the suction side. As a result, the strength of roll-up vortices at the trailing edge becomes comparable; a situation that is encountered close to characteristic Reynolds number
 $\mathit{Re}_{ch}$
and pertains to an overlap between the suction- and pressure-side-dominated regimes. For even larger
 $\mathit{Re}_{c}>\mathit{Re}_{ch}$
, a clear loss in coherence on the suction side is observed. This loss of coherence is the result of the 3D breakdown encountered in the later stages of transition. Consequently, pressure-side events dominate tonal noise generation due to this asymmetry in flow conditions on the two sides, while the suction side primarily contributes to broadband noise emission. Inasawa et al. (Reference Inasawa, Kamijo and Asai2010) described a similar Reynolds-number dependence for the particular case of
 ${\it\alpha}=2^{\circ }$
.
At
 ${\it\alpha}=4^{\circ }$
(figure 14
j,l,n,p) these changes in flow structure and the asymmetry are more emphasized. The comparatively low intensity of tones at low Reynolds numbers (compare figure 11) can be explained by the progressively increasing coherence loss on the suction side with increasing angle of attack. Upstream of the trailing edge, strong amplification of pressure-side instability waves is only observed at higher Reynolds number (
 $\mathit{Re}_{c}>1.9\times 10^{5}$
) when compared to
 ${\it\alpha}=2^{\circ }$
. Thus, transition to the pressure-side-dominated regime for tonal noise generation is delayed to a higher characteristic Reynolds number (compare table 1).
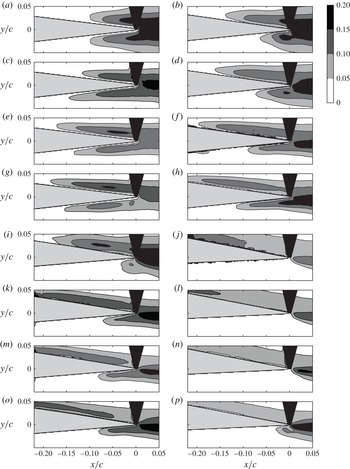
The transition location is typically defined by a marked change in shape factor or by a steep increase of the velocity fluctuation level. Figure 15 shows the root-mean-square (r.m.s.) value of the corresponding
 $y$
-velocity fluctuations with respect to the mean flow. For the airfoil at non-zero angle of attack (for instance
 ${\it\alpha}=1^{\circ }$
, figure 15
b,d,f,h), the transition point based on the gradient criterion occurs upstream of the reattachment point (compare figure 14) and consequently earlier on the suction side than on the pressure side. The difference becomes larger with increasing angle of attack (
 ${\it\alpha}=4^{\circ }$
, figure 15
j,l,n,p).
R.m.s. of fluctuating
 $y$
-velocity component
 $\text{r.m.s.}(v^{\prime })/u_{\infty }$
for different angles of attack ((a,c,e,g)
 ${\it\alpha}=0^{\circ }$
; (b,d,f,h)
 $1^{\circ }$
; (i,k,m,o)
 $2^{\circ }$
; (j,l,n,p)
 $4^{\circ }$
) and Reynolds numbers ((a,b,i,j)
 $\mathit{Re}=1.33\times 10^{5}$
; (c,d,k,l)
 $1.6\times 10^{5}$
; (e,f,m,n)
 $1.87\times 10^{5}$
; (g,h,o,p)
 $2.13\times 10^{5}$
). Smooth airfoil with the pressure side at the bottom (
 $y<0$
) and the suction side on the top (
 $y>0$
).

In summary, at low Reynolds number, transition on the pressure side, where a separated shear layer often even extends into the wake, occurs late or even downstream of the trailing edge. On the suction side, earlier separation causes amplification of instability waves and coherent roll-up vortices to convect past the trailing edge. As a result of the shorter separation bubble length with increasing Reynolds number (figure 14), the transition point moves upstream on both sides of the airfoil (figure 15), leading to coherent vortical structures on the pressure side and initial stages of 3D turbulent breakdown on the suction side. This behaviour causes a shift of the contribution to overall tonal noise generation from events on the suction side towards those on the pressure side. Increasing the Reynolds number even further amplifies this effect and the boundary layer on the suction side reaches a turbulent state upstream of the trailing edge. Therefore, the strong tonal noise emission is dominated by pressure-side events for
 $\mathit{Re}_{c}>\mathit{Re}_{ch}$
. The existence of a separated shear layer on either the pressure or suction side sufficiently close to the trailing edge is thus confirmed to be a necessary condition for the generation of tonal noise (Nash et al.
Reference Nash, Lowson and McAlpine1999).
3.5. Characteristics of secondary tones
Figure 5 showed that, for most flow conditions, multiple tones are present. Desquesnes et al. (Reference Desquesnes, Terracol and Sagaut2007) ascribed this to periodic amplitude modulation of the primary tone. Thus, the primary tone can be interpreted as a carrier signal, and the difference between the frequency of the primary tone and symmetric side tones can be interpreted as a modulation at frequency
 ${\rm\Delta}f$
and multiples thereof.
Figure 16 shows the frequencies of the primary and side tones at least
 $30~\text{dB}$
above the background noise level and at most
 $15~\text{dB}$
below the intensity of the primary tone. Data are shown for the smooth and tripped cases (markers). In addition, the empirical estimation of the tone frequencies
 $f_{n}$
for the suction side of the smooth airfoil is indicated (equations (1.2) and (1.4) with
 $K=0.365$
, lines). The latter requires an estimation of the feedback loop length scale
 $L_{f}$
, which is considered as the distance between the maximum velocity point and the trailing edge as originally suggested by Arbey & Bataille (Reference Arbey and Bataille1983). This distance has been computed using XFOIL (Drela Reference Drela1989) for every combination of Reynolds number and angle of attack.


Arbey & Bataille (Reference Arbey and Bataille1983) suggested the empirical estimation (1.4) for a NACA 0012 at near zero incidence (
 ${\it\alpha}=0^{\circ }$
). Near zero incidence, figure 16(a,b) indeed shows good agreement between the measured and predicted tonal frequencies for the smooth airfoil and pressure-side-tripped cases (
 ${\rm\Delta}fc/u_{\infty }\approx 0.65$
). In particular, the increase in side tone spacing at low Reynolds number, which is described by the empirical relation, is confirmed by the measurements. Interestingly, the modulation frequency for the smooth airfoil and Reynolds numbers
 $\mathit{Re}_{c}<1.5\times 10^{5}$
is substantially lower (
 ${\rm\Delta}fc/u_{\infty }\approx 0.3$
) over a small range of intermediate Reynolds numbers (about
 $\mathit{Re}_{c}\approx 1.5\times 10^{5}$
). To the authors’ knowledge, this halving of modulation frequency has not been reported before and might be a distinct feature for an airfoil at near zero incidence over a restricted range of Reynolds number.
With increasing angle of attack, the predicted modulation frequency
 ${\rm\Delta}f$
decreases on the suction side as a result of an increase in feedback loop length. At
 ${\it\alpha}=2^{\circ }$
(figure 16
c) and
 ${\it\alpha}=4^{\circ }$
(figure 16
d) and for
 $\mathit{Re}_{c}<\mathit{Re}_{ch}$
, the tone frequencies
 $f_{n}$
for the smooth airfoil and that associated with the suction side are in good agreement, and both configurations show a very similar side tone structure. In contrast, for
 $\mathit{Re}_{c}>\mathit{Re}_{ch}$
, the frequencies for the smooth airfoil adapt to those found for the case with the suction side tripped.
For their numerical simulation, Desquesnes et al. (Reference Desquesnes, Terracol and Sagaut2007) ascribed the periodic amplitude modulation of acoustic pressure to acoustic feedback on both the pressure and suction sides. Recently, Pröbsting et al. (Reference Pröbsting, Serpieri and Scarano2014) reported similar periodic amplitude modulation of the acoustic pressure signal and showed that it is related to periodic amplitude modulation of the instability waves and roll-up vortices near the trailing edge. Moreover, it was demonstrated that pressure-side events can sustain such periodic amplitude modulation, while the boundary layer on the suction side is turbulent. Such an explanation does not require a strong coupling or interaction between the two sides and can explain the presence of multiple side tones.
For the present study, figure 16 shows that the marked side tone structure at
 $\mathit{Re}_{c}<\mathit{Re}_{ch}$
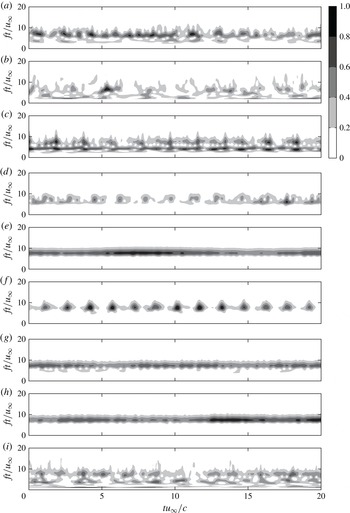
is ascribed to suction-side events. Pröbsting et al. (Reference Pröbsting, Serpieri and Scarano2014) used wavelet analysis based on the Morlet wavelet to identify the time-dependent spectral characteristics of the corresponding signal (Torrence & Compo Reference Torrence and Compo1998). Figure 17 shows the normalized magnitude of the wavelet coefficients, indicating the time-varying amplitude of acoustic pressure, for the airfoil at
 ${\it\alpha}=2^{\circ }$
and Reynolds numbers of
 $\mathit{Re}_{c}=1.1\times 10^{5}$
,
 $1.6\times 10^{5}$
and
 $2.1\times 10^{5}$
. At the lowest Reynolds number (
 $\mathit{Re}_{c}=1.1\times 10^{5}$
, figure 17
a), amplitude modulation is observed for the smooth case and is even more pronounced when the pressure side is tripped. The causality of the main modulation relating to suction-side events is more apparent at
 $\mathit{Re}_{c}=1.6\times 10^{5}$
(figure 17
b). Close inspection of the smooth case reveals a secondary peak, which is not present when the pressure side is tripped. This distinct difference might point to a modification of the noise emission by a secondary feedback loop (Desquesnes et al.
Reference Desquesnes, Terracol and Sagaut2007). For
 $\mathit{Re}_{c}>\mathit{Re}_{ch}$
, the side tone structure is substantially less emphasized (compare figure 16). Such a case is represented here by
 $\mathit{Re}_{c}=2.1\times 10^{5}$
(figure 17
c). Clearly, the signal emitted by the smooth airfoil is pressure-side-dominated in this case and does not show strong periodic amplitude modulation when compared to cases with
 $\mathit{Re}_{c}<\mathit{Re}_{ch}$
.
Magnitude of wavelet coefficients of acoustic pressure (normalized by maximum value) against pseudo-frequency and time for
 ${\it\alpha}=2^{\circ }$
and
 $\mathit{Re}_{c}=1.1\times 10^{5}$
,
 $1.6\times 10^{5}$
and
 $2.1\times 10^{5}$
: smooth (a,d,g), s.s. tripped (b,e,h), p.s. tripped (c,f,i).

3.6. A perspective view on previous studies
In the past, a large number of experimental and numerical studies relating to tonal noise generation on the NACA 0012 profile have been published. Arcondoulis et al. (Reference Arcondoulis, Doolan and Zander2009) performed extensive acoustic measurements on a NACA 0012 in a similar low to moderate Reynolds number range (
 $0.5\times 10^{5}$
to
 $1.5\times 10^{5}$
) as investigated in the present study. Their data are presented together with other experimental and numerical results discussed below in figure 18. The comparison suggests that Arcondoulis et al. (Reference Arcondoulis, Doolan and Zander2009) mainly considered suction-side-dominated cases or those constituting the overlap region. They observed no tones at their largest investigated angle of attack (
 ${\it\alpha}_{geo}=10^{\circ }$
,
 ${\it\alpha}_{eff}=3.2^{\circ }$
). The reason for the discrepancy with the results of the present study is not clear, but might be related to the comparatively large blockage ratio in the study of Arcondoulis et al. (Reference Arcondoulis, Doolan and Zander2009). This might have led to a substantially different pressure distribution and renders the simple angle-of-attack correction by (2.1) questionable.
Experiments showing tonal (solid symbols) and non-tonal (open symbols) noise. Suction (hatched, top left to bottom right) and pressure-side-dominated regimes (hatched, bottom left to top right). For the results of Nash et al. (Reference Nash, Lowson and McAlpine1999) and Plogmann et al. (Reference Plogmann, Herrig and Würz2013), the geometric angle of attack is reported. The grey bar around
 ${\it\alpha}_{eff}=0^{\circ }$
indicates the uncertainty in angle of attack for the present study.

The study of Paterson et al. (Reference Paterson, Vogt, Fink and Munch1973) constitutes the classical reference for boundary layer instability noise and, as evident from figure 18, exclusively treated pressure-side-dominated cases for non-zero angle of attack. Their statement that tripping of the boundary layer on the suction side had no effect on the tonal noise emission corroborates this conclusion.
Plogmann et al. (Reference Plogmann, Herrig and Würz2013) covered a similar range of Reynolds numbers and identified a ladder structure with tonal emission in the range
 $3.1\leqslant \mathit{Re}_{c}\leqslant 7.5\times 10^{5}$
at
 ${\it\alpha}=4^{\circ }$
(compare figure 4 of Plogmann et al. (Reference Plogmann, Herrig and Würz2013)). At fixed Reynolds number
 $\mathit{Re}_{c}=1.57\times 10^{6}$
, they reported tones between
 $4^{\circ }\leqslant {\it\alpha}\leqslant 7^{\circ }$
(compare figure 3 of Plogmann et al. (Reference Plogmann, Herrig and Würz2013)). They also tripped the boundary layer on the pressure side, which eliminated tonal noise. It should be noted that these experiments were performed in a closed section wind tunnel and the geometric angle of attack is given. In contrast to an open jet set-up, the effective angle of attack is thus expected to be larger than the geometric one. A good match with the (corrected) tonal envelope of Lowson et al. (Reference Lowson, Fiddes and Nash1994) is found and, clearly, noise emission was pressure-side-dominated, as stated by the authors in their conclusion. However, they also concluded that a secondary feedback loop due to suction-side events is not relevant for tonal noise emission. This conclusion should be put into perspective: Desquesnes et al. (Reference Desquesnes, Terracol and Sagaut2007), who originally proposed the secondary feedback loop, considered a case close to the interaction regime (see figure 18) and the results of Plogmann et al. (Reference Plogmann, Herrig and Würz2013) do not necessarily apply to this case. Nevertheless, Pröbsting et al. (Reference Pröbsting, Serpieri and Scarano2014) showed that a secondary feedback loop is also not a necessary condition for periodic amplitude modulation of the roll-up vortices within this interaction regime.
Nash et al. (Reference Nash, Lowson and McAlpine1999) considered a NACA 0012 with
 $300~\text{mm}$
chord at angles of attack between
 ${\it\alpha}=2^{\circ }$
and
 $5^{\circ }$
(
 $2.6\times 10^{5}<\mathit{Re}_{c}<1.2\times 10^{6}$
) in a closed test section (quasi-anechoic) wind tunnel. The high Reynolds-number range suggests that tonal noise generation was pressure-side-dominated, exclusively. The authors remarked that no ladder structure was observed (compare figure 5 of Nash et al. (Reference Nash, Lowson and McAlpine1999)). Indeed, for
 ${\it\alpha}=2^{\circ }$
and
 $3^{\circ }$
the data show evidence of transitions (jumps) at intermediate Reynolds numbers, while this is not the case for higher angles of attack, where the primary tone frequency varies continuously with
 $u_{\infty }^{0.8}$
. These transitions without clear ladder structure, albeit at different Reynolds number, are similar to the observations in the present study (figure 10
c,d).
Chong & Joseph (Reference Chong and Joseph2012) presented results on an airfoil at effective angle of attack
 ${\it\alpha}_{eff}=1.4^{\circ }$
for the pressure-side-dominated range of Reynolds numbers between
 $\mathit{Re}_{c}=2.5\times 10^{5}$
and
 $5\times 10^{5}$
. Their results (compare figure 3 of Chong & Joseph (Reference Chong and Joseph2012)) show a similar asymmetric shape of the side tones with respect to the primary tones as in the present study (figure 4), which was attributed to a relative shift of broadband and tonal contributions.
Two-dimensional (2D) large-eddy simulation and direct numerical simulation (DNS) studies have been a popular tool for the investigation of the tonal noise phenomenon (Desquesnes et al.
Reference Desquesnes, Terracol and Sagaut2007; Sandberg et al.
Reference Sandberg, Jones, Sandham and Joseph2009; Jones & Sandberg Reference Jones and Sandberg2011; Ikeda, Atobe & Takagi Reference Ikeda, Atobe and Takagi2012; Tam & Ju Reference Tam and Ju2012; Golubev et al.
Reference Golubev, Nguyen, Mankbadi, Roger and Visbal2013, Reference Golubev, Nguyen, Mankbadi, Roger and Visbal2014; Fosas de Pando et al.
Reference Fosas de Pando, Schmid and Sipp2014). Desquesnes et al. (Reference Desquesnes, Terracol and Sagaut2007) interpreted the results of their 2D DNS such that, for a NACA 0012 at
 $5^{\circ }$
and Reynolds number
 $1\times 10^{5}$
, only broadband noise is present, while tones occurred at
 $2^{\circ }$
and
 $2\times 10^{5}$
, respectively. Their results show coherent vortical structures on both pressure and suction sides for this case (compare figure 4 of Desquesnes et al.
Reference Desquesnes, Terracol and Sagaut2007) and evidence of tonal noise (compare figure 7 of Desquesnes et al.
Reference Desquesnes, Terracol and Sagaut2007), which was in agreement with the envelope of Lowson et al. (Reference Lowson, Fiddes and Nash1994). Observing periodic amplitude modulation of far-field acoustic pressure and vortical structures on both sides of the airfoil, the authors suggested a concept including two feedback loops to explain such modulation. In view of the results presented here, this concept can be considered for the overlap region of the two regimes. However, within the pressure- and suction-side-dominated regimes such interaction has little effect, as discussed above.
Fosas de Pando et al. (Reference Fosas de Pando, Schmid and Sipp2014) recently performed another 2D DNS simulation at similar Reynolds number (
 $2\times 10^{5}$
) and angle of incidence (
 $2^{\circ }$
), which suggests a suction-side-dominated case. It should be noted that in both simulations suction-side events appear to be more coherent than for the experimental results under similar conditions (figure 14). This is probably related to the physics of 2D flow, which fundamentally differs in the nature of the energy cascade from its 3D counterpart. Thus the interaction between the events on the two sides is likely to be overestimated for 2D simulations under such conditions. This can lead to discrepancies in the results for 2D simulations when compared to experimental studies: in order to capture the entire physics of the problem, the 2D assumption is not appropriate, which has been acknowledged by some authors by stating that, at higher angles of attack or Reynolds numbers, one of the boundary layers would become turbulent, thus leading to broadband noise emission (Desquesnes et al.
Reference Desquesnes, Terracol and Sagaut2007). Furthermore, owing to the comparatively low-Reynolds-numbers (suction-side-dominated) cases often targeted in numerical simulations, comparison with higher-Reynolds-number experimental data (for pressure-side-dominated cases) needs to be interpreted carefully.
A particular point of debate has been the noise emission at zero incidence. The acoustic measurements of Arcondoulis et al. (Reference Arcondoulis, Doolan and Zander2009) for Reynolds number between
 $0.75\times 10^{5}$
and
 $1.5\times 10^{5}$
show a primary tone and weak secondary tones (
 $20~\text{dB}$
lower). In the same study, the authors reported that the spectral content became significantly more broadband at higher Reynolds number (
 $\mathit{Re}_{c}>1.8\times 10^{5}$
). These observations agree with the present study (figure 5) and the broadening at higher Reynolds numbers is related to earlier transition (figure 14). However, these experimental results are in conflict with the 2D DNS results of Tam & Ju (Reference Tam and Ju2012), who found a single primary tone at a frequency scaling with
 $f_{s}$
(1.1) at even higher Reynolds number (between
 $\mathit{Re}_{c}=2\times 10^{5}$
and
 $5\times 10^{5}$
), but for zero inflow turbulence. Also the flow structure presented by Tam & Ju (Reference Tam and Ju2012) shows a fundamental difference: the boundary layer remains laminar up to the trailing edge and tonal noise generation is attributed to a wake instability, which contrasts the convection and scattering of amplified instability waves at the trailing edge as suggested in the present and previous studies (Arbey & Bataille Reference Arbey and Bataille1983). According to Tam & Ju (Reference Tam and Ju2012) differences may be ascribed to the turbulence level (
 ${\leqslant}0.1\,\%$
in the present study (Mueller et al.
Reference Mueller, Scharpf, Batill, Strebinger, Sullivan and Subramanian1992)). A point of attention on the experimental side are asymmetries in the set-up, in particular for the adjustment of the angle of attack (
 $\pm 0.15^{\circ }$
in the present study, indicated by grey area in figure 18). Owing to the high sensitivity of the flow regimes to angle-of-attack changes near zero incidence, the experimental results should be considered carefully. However, it is not expected that the case of zero incidence
 ${\it\alpha}=0^{\circ }$
represents a singularity in the sense that the flow remains laminar up to the trailing edge, while transition is observed in experiments at far lower Reynolds number at near zero incidence (Arcondoulis et al.
Reference Arcondoulis, Doolan and Zander2009; Pröbsting et al.
Reference Pröbsting, Serpieri and Scarano2014). From the perspective of numerical modelling, the extent to which the 2D flow model and inflow turbulence level influence the results should be considered.
4. Conclusion
Strong amplification of instability waves is linked to a separation bubble or separated shear layer on the pressure and/or the suction side. The reattachment point on both pressure and suction sides moves upstream with increasing Reynolds number. Therefore, the transition region, constituting the aft portion of the separation bubble, also moves upstream. This Reynolds-number dependence is weak compared to changes with angle of attack. With increasing angle of attack, the reattachment point on the suction side shifts upstream. On the pressure side, the reattachment shifts further downstream in the case of a separation bubble, while the reverse flow region extends further into the wake in the case of a separated shear layer. These dependences of the topology promote the division of the Reynolds-number and angle-of-attack domains into pressure- and suction-side-dominated regimes of tonal noise generation. They provide conditions for which either pressure- and/or suction-side instability waves are amplified sufficiently close to the trailing edge to induce the roll-up of spanwise coherent vortical structures, which then coherently convect past the latter and thus contribute to tonal noise generation. Suction-side events dominate tonal noise emission at low Reynolds number, while pressure-side events prevail at high Reynolds number. With increasing angle of attack, the overlap region between the regimes becomes progressively smaller due to a larger sensitivity of the reattachment and transition location to Reynolds number. An overview of the regimes identified in the present study was given in figure 13 and indicated that the domain of tonal noise extends over a larger range of Reynolds number than typically indicated previously for the NACA 0012 airfoil.
Experiments with forced boundary layer transition have shown that interaction between events on the two sides, such as suggested by the secondary feedback (Desquesnes et al. Reference Desquesnes, Terracol and Sagaut2007) or hydrodynamic interaction (Nash et al. Reference Nash, Lowson and McAlpine1999), is not a necessary condition for the presence of side tones and a ladder structure. Nevertheless, such interaction has an influence on the details of the emitted tonal noise. Especially with regard to such interaction, assessment and quantification of the spanwise correlation length on the two sides may lead to further insight. In the present study, the side tone structure and modulation are most prominent in the suction-side-dominated regime. A fine ladder structure is not present near zero incidence, but indications of a ladder structure are observed at higher angle of attack. Previous reports suggest that the ladder structure is also evident in the pressure-side-dominated regime at higher Reynolds numbers.
Acknowledgements
The authors would like to acknowledge the support of J. Serpieri and Y. Guan to this work. This research is partially supported by the European Community Seventh Framework Programme (FP7/2007–2013) under the AFDAR project (Advanced Flow Diagnostics for Aeronautical Research), grant agreement no. 265695.