I. INTRODUCTION
The poly(lactic acid) (PLA), a biodegradable aliphatic thermoplastic polyester, is an excellent biomaterial that can be produced from renewable resources. Reference Nampoothiri, Nair and John1 Possessing high modulus and high strength, PLA is a good choice for petroleum-based polymer replacement. The excellent biocompatibility and absorbability of PLA have made it suitable for medical applications such as drug delivery systems, sutures and blood vessels. Reference Valarezo, Tammaro, Malagon, Gonzalez, Armijos and Vittoria2 Even through PLA possesses excellent properties, it is still necessary to improve the crystallinity and crystallization rate of PLA to expand its use in broader applications. For example, Drieskens Reference Drieskens, Peeters, Mullens, Franco, Lemstra and Hristova-Bogaerds3 reported that the oxygen and water vapor permeability coefficients of highly crystallized PLA were more than 3–4 times lower than that of the amorphous PLA references. Moreover, PLA with high crystallinity also possesses superior mechanical properties. Reference Wang, Wang, Huang and Weng4
To improve the crystallization rate of PLA, various particles have been introduced as nucleation agents. Reference Pan, Liang, Cao and Inoue5–Reference Papageorgiou, Achilias, Nanaki, Beslikas and Bikiaris9 It is well accepted that nanoparticles are efficient heterogeneous nucleating agents for various semicrystalline polymers. Reference Grady, Pompeo, Shambaugh and Resasco10,Reference Ray and Okamoto11 Inoue et al. found that layered metal phosphonate, zinc phenylphosphonate (PPZn), was an excellent nucleating agent of PLA, and PLA can be crystallized at a fast rate even at a very low PPZn concentration. Reference Pan, Liang, Cao and Inoue5 Papageorgiou et al. found that silica nanoparticles (SiO2) and oxidized multiwalled carbon nanotubes (CNTs) can increase the crystallization rate of PLA effectively. Reference Papageorgiou, Achilias, Nanaki, Beslikas and Bikiaris9 Compared with CNTs, graphene possesses double the surface area, Reference Shiu and Tsai12 which exhibits excellent nucleating performance. Zhang Reference Wu, Cheng, Feng, Yao and Zhang13 investigated PLA crystallization behavior in the presence of graphene. During cold crystallization, graphene just acted as an inert filler. However, graphene was a heterogeneous nucleating agent during melt crystallization, increasing the overall crystallization rate. As a kind of graphene derivative, graphene oxide (GO) possesses the same carbon sheet but with –OH, –COOH, –O–, and C=O functional groups linking on the surface and edge regions, Reference Stankovich, Piner, Nguyen and Ruoff14 leading to strong van der Waals interaction with PLA. Moreover, GO is more compatible with organic polymers compared with graphene. Reference Kim, Abdala and Macosko15–Reference Potts, Dreyer, Bielawski and Ruoff17 Therefore, it shows a great potential in promoting crystallization of PLA. Wang and Qiu Reference Wang and Qiu18,Reference Wang and Qiu19 carried out a detailed study on the crystallization behavior of PLA/GO composites and found that, compared with neat PLA, the overall crystallization rates of the composites increased with increasing GO loading. However, when the content of GO was higher, the crystallization rate of PLA was restrained to some extent. They attribute this behavior to aggregation of GO and neglect the interaction between PLA and GO which restricted the PLA chain mobility. We hypothesize that because of the interaction, it is difficult for PLA chains to crystallize impacting the morphology of PLA crystals. The influence of the interaction between PLA and GO on the morphology of crystal is an important part of this research work.
Porous biopolymer materials have widespread applications, especially in medicine. As a typical biopolymer, the preparation of porous PLA was important. As is well known, the pore size of porous materials impacts the properties and applications of polymeric foams, Reference Li, Yokoyama, Nemoto and Sugiyama20–Reference Zhang, Zhu, Li and Lee23 such as catalysis, separation technology and bioengineering. For example, as tissue engineering scaffolds, porous materials with macropores and micropores simultaneously performed better. Reference Salerno, Oliviero, Di Maio, Iannace and Netti24,Reference Salerno, Zeppetelli, Di Maio, Iannace and Netti25 When Suh proposed the concept of microcellular foaming, he believed that nanopores could improve the mechanical properties of materials like nanofillers. Reference Martini, Waldman and Suh26 However, it was difficult to prepare porous materials with nanopores. Many researchers focus on reducing the pore size of foams. Reference Li, Yokoyama, Nemoto and Sugiyama20,Reference Yokoyama, Li, Nemoto and Sugiyama22 Among polymeric materials, block copolymer (BCP) self-assembly is an effective method to form nanopores and the size is tunable by controlling molecular parameters. Reference Sai, Tan, Hur, Asenath-Smith, Hovden, Jiang, Riccio, Muller, Elser, Estroff, Gruner and Wiesner27 Ruiz prepared porous polymethyl methacrylate/polystyrene (PMMA/PS) composites in the presence of BCPs, and achieved a pore size of 0.2 µm. Reference Ruiz, Pedros, Tallon and Dumon28 Liu found that the addition of PP can improve the pore density and reduce the pore size of polyetherimide foams. Reference Liu, Lei, Chen, Wang and Luo29 Nevertheless, in the previous studies, significant amounts of additives or chemical solvents were needed, some of which were toxic. Microcellular foaming, using environmentally friendly supercritical carbon dioxide (SC-CO2) as a physical foaming agent, was a promising method to prepare porous materials. Reference Kuang, Mi, Fu, Jing, Chen, Mou and Peng30–Reference Huang, Jing, Geng, Chen, Mi and Peng33 As a semicrystalline polymer, PLA possessed crystalline and amorphous regions. The crystallinity can be improved by the addition of GO. It is easier for SC-CO2 to dissolve in amorphous region compared to the crystalline regions. Thus, if the soaking temperature is far below the melt temperature, only the amorphous regions contain CO2 which foams when the CO2 is released, resulting in the formation of nanopores. Nanopores were prepared by SC-CO2 low temperature foaming and the effect of GO on the nanopores formation has not been reported.
In this work, PLA composites filled with GO were prepared by solution mixing. The crystal morphology was observed using a polarizing microscope and scanning electron microscope (SEM). Isothermal crystallization kinetics of the nanocomposites was investigated by differential scanning calorimetry (DSC). PLA/GO composites with nanopores were prepared by a low temperature foaming process (LTFP). The crystallization and foaming mechanism of PLA/GO nanocomposites was also analyzed.
II. EXPERIMENTAL
A. Materials
Commercially available polylactide (PLA, 4032D) with a density of 1.24 g/cm3 was purchased from NatureWorks (Blair, Nebraska). Its molecular weight (Mw) and polydispersity index are 207 kDa and 1.74, respectively. GO was synthesized from expanded graphite (EG) using the modified Hummers' method following the procedure proposed in Ref. Reference Evanoff, Magasinski, Yang and Yushin34. Graphite powders, sodium nitrate (NaNO3), concentrated sulfuric acid (H2SO4), potassium permanganate (KMnO4), hydrogen peroxide (H2O2), and hydrochloric acid (HCl, 37%) were bought from Sigma–Aldrich (St. Louis, Missouri). All chemicals were used as received.
B. PLA/GO nanocomposite sheet preparation
The PLA/GO nanocomposites were prepared by the solution mixing method as reported by Wang and Qiu. Reference Wang and Qiu18,Reference Wang and Qiu19 Briefly, the desired amounts of GO were first suspended into N,N-dimethylformamide (DMF) followed by sonication for 2 h to achieve a uniform dispersion of GO in the solvent. Meanwhile, PLA was dissolved in DMF at a concentration of 100 mg/mL at 80 °C for 4 h. Then, the PLA solution was sufficiently mixed with GO suspension under vigorous magnetic stirring at 80 °C for 2 h to obtain the homogeneous PLA/GO solution. The PLA/GO nanocomposites were obtained by evaporating the solvent at room temperature for 1 week. The PLA/GO nanocomposites with various GO contents were labeled as PLA-0.1, PLA-0.5, and PLA-1 according to the weight concentration of GO in the composites. For example, PLA-0.1 means that the GO content was 0.1% in the PLA/GO nanocomposites. Neat PLA was also processed following the same procedures as PLA/GO composites for better comparison. To observe the crystal morphology, the nanocomposite sheets were etched to eliminate the amorphous region on the sample surface. The sheets were prepared according to the following process. The nanocomposites were first melted at 190 °C and compression molded on a hot press (QLB-25D/Q, Wuxi First Rubber and Plastic Machinery Equipment Factory, Wuxi, China) under a pressure of 10 MPa to form a sheet with a thickness of 1 mm, followed by decompression and isothermal annealing for 6 min to erase any thermal and mechanical history. Then, the as-prepared sheet was quickly transferred to another hot press at 120 °C for 30 min to allow isothermal crystallization of PLA. The crystallized nanocomposite sheets were obtained when the samples were cooled down to room temperature.
C. Supercritical carbon dioxide foaming process
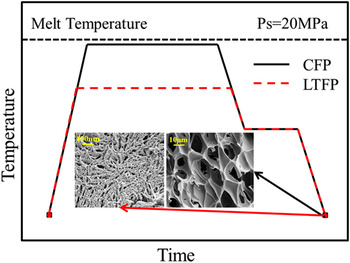
The samples cut from the prepared nanocomposite sheets were foamed in a homemade batch foaming device with the SC-CO2 as the blowing agent. Figure 1 shows the foaming process. The prepared PLA/GO sheets were first put into a high-pressure vessel (three dimensions with free space). The vessel was then heated to the desired soaking temperatures (T s). After that, SC-CO2 was pressed into the vessel via a supercritical fluid pump (TELEDYNE ISCO 260D, Lincoln, Nebraska) to the soaking pressure (P s, 20 MPa). The system was kept at T s and P s for 1 h to allow the saturation of SC-CO2 into the samples. Subsequently, the vessel was cooled to the foaming temperature (T f, 90 °C) and kept for 30 min, and the saturation pressure was maintained at the same time. The vessel was then depressurized instantaneously to ambient pressure to induce cell nucleation and growth. The foamed samples were obtained after the vessel was cooled down to room temperature with a water cooling system. In this study, two soaking temperatures were used in the foaming process. For the conventional foaming process (CFP), T s was 160 °C, which is close to the melting temperature of PLA. As indicated in Fig. 1, the cell size was about 100 µm. For the LTFP, T s was 120 °C, which is below the melting temperature of PLA. At this temperature, the crystal structure was maintained and only the amorphous region can foam, which resulted in the formation of nanocells, as presented in Fig. 1.
Temperature versus time diagram for CFP and LTFP.

D. Characterizations
1. Differential scanning calorimetry
The study of crystallization behavior and kinetics of neat PLA and the PLA/GO nanocomposites was performed using DSC (DSC204C, Netzsch Group, Bavaria, Germany) under nitrogen atmosphere. The samples were heated from room temperature to 190 °C, held for 3 min to eliminate any thermal history, and subsequently cooled to 40 °C and reheated to 190 °C with a cooling and heating rates of 5 and 10 °C/min respectively, due to that PLA crystallization was unobvious with 10 °C/min cooling rate. For isothermal crystallization, the samples were quenched to the desired crystallization temperature (T c =120 °C) at a cooling rate of 80 °C/min after melting at 190 °C for 3 min. The samples were held at T c for 30 min to allow the crystallization of PLA and PLA/GO nanocomposites. The evolution of heat flow versus crystallization time was recorded for later data analysis.
2. Wide angle x-ray diffraction (WAXRD)
The crystalline structures of neat PLA and PLA/GO nanocomposites were analyzed by WAXRD (PANALYTICAL, Almelo, The Netherlands) with Ni-filtered Cu K radiation (λ = 0.15418 nm, 40 kV, 200 mA) at a scanning rate of 5°/min from 5° to 35°. The samples used for the test were trimmed into the dimension of 10 × 10 × 1 mm (long × width × thickness).
3. Scanning electron microscopy
Crystal morphology of neat PLA and the PLA/GO nanocomposites was observed with the S-3700N (Hitachi, Tokyo, Japan) SEM. The accelerating voltage was 10 kV. Prior to the observation, the prepared sheets were cryogenically fractured in liquid nitrogen in the cross section and subsequently etched with a 1:2 water–methanol mixture solution containing 0.025 mol/L NaOH for 12 h followed by drying and surface coated with a thin layer of gold.
4. Polarized optical microscopy (POM)
The spherulite morphology of neat PLA and PLA/GO nanocomposites was studied by an STEMI 2000 POM equipped with a temperature controller (Carl Zeiss AG, Jena, Germany). The samples were pressed by glass slide after melting to form a thin film. Samples were first annealed at 190 °C for 3 min and then cooled to 120 °C at a cooling rate of 60 °C/min for 30 min. The process of spherulite growth during isothermal crystallization was recorded.
5. Raman spectroscopy
A laser confocal Raman microscope system (LabRAM Aramis, Horiba Jobin Yvon, Longjumeau, France) was used to characterize the prepared samples. An air-cooled argon-ion laser operated at a wave length of 532.8 nm was used as an excitation source with the output power varying between 2 and 20 mW. The Raman spectra were recorded with an integration time of 30–60 s at room temperature using a Nikon 100× air objective.
III. RESULTS AND DISCUSSION
A. Crystallization and melting behavior
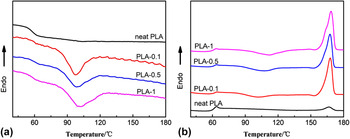
It has been previously reported that the presence of GO has a significant influence on the crystallization of PLA. Reference Wang and Qiu18,Reference Wang and Qiu19,Reference Sun and He35,Reference Xu, Chen, Yang, Li, Mao, Zeng and Hsiao36 In this study, the effect of GO on the PLA crystallization behavior was further analyzed. Figure 2 shows DSC results of neat PLA and the PLA/GO nanocomposites. As shown in Fig. 2(a), no exothermic peak was detected for neat PLA during cooling, suggesting that neat PLA did not crystallize during nonisothermal process. However, the PLA/GO nanocomposites showed obvious crystallization peaks during cooling, which indicates that the GO sheets acted as effective nucleating agents. Moreover, the crystallization temperature (T c) of the PLA/GO nanocomposites shifted higher with the increase of GO (97.2 °C for PLA-0.1 to 101.7 °C for PLA-1) suggesting that GO promoted the nonisothermal crystallization of PLA.
DSC thermograms for neat PLA and the PLA/GO nanocomposite in (a) cooling process and (b) second heating process.

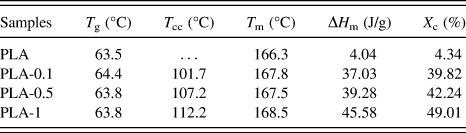
During the second heating process [Fig. 2(b)], three typical transitions, including a glass transition, a cold-crystallization exothermic peak and a melting endothermic peak were observed, which are listed in Table I. Compared with neat PLA, the PLA/GO nanocomposites showed higher glass transition temperature (T g), which may be due to the restriction of the GO structure on the PLA molecular mobility due to the interaction between PLA and GO. Reference Li and Sun37 Obvious cold-crystallization peaks were found in all PLA/GO nanocomposites but not neat PLA, indicating that GO acted as effective nucleating agents during the crystallization of PLA and accelerated the crystal growth. Meanwhile, the restricted effect of GO on PLA molecular mobility resulted an increase in the cold crystallization temperature (T cc) as the GO content increased. The melting temperature (T m) and crystallinity of PLA were enhanced by the addition of GO as indicated by PLA-1 showing the highest degree of crystallinity (168.5 °C and 49.01%, respectively), while they were only 166.3 °C and 4.34% for neat PLA. These results revealed that GO was effective in promoting the crystallization of PLA, which is in agreement with the previous study. Reference Wu, Cheng, Feng, Yao and Zhang13,Reference Wang and Qiu19
Calorimetric data derived from the second heating DSC scan for neat PLA and PLA/GO nanocomposites.

T g, glass transition temperature; T cc, cold-crystallization temperature; T m, melting temperature; ΔH m, enthalpy of the melt process; X c is the degree of crystallinity.
B. Crystal structure of neat PLA and PLA/GO nanocomposites
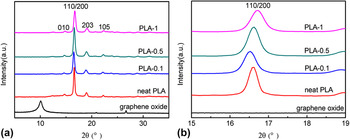
GO was obtained by the chemical oxidation and exfoliation of EG, possessing a multilayered structure. Its influences on the crystallization of PLA strongly depended on the dispersion states. To reveal the intercalation and exfoliation of GO in the PLA matrix, the neat PLA and PLA/GO nanocomposites were investigated with wide angle X-ray diffraction (WAXD). Figure 3(a) shows the WAXD patterns of GO, neat PLA and the PLA/GO nanocomposites. It should be noted that all samples were crystallized at 120 °C. The characteristic peak of GO was present at 2θ = 11.6°, while this peak was absent in all PLA/GO nanocomposites, suggesting that the layered GO had been exfoliated in the nanocomposites. Reference Jang, Kim, Jeong and Shin38 The poly(ε-caprolactone)/organo-graphite oxide composite also showed similar results. Reference Hua, Kai, Liang and Inoue39 For neat PLA, the strongest peak at 16.6° and the less intense peaks at 14.7°, 18.9°, and 22.1° were attributed to reflections of the (200)/(110), (010), (203), and (015) planes, respectively. The PLA/GO nanocomposites showed similar diffraction patterns to neat PLA, indicating that the addition of GO did not modify the crystal structure of PLA in the nanocomposites obviously. Therefore, both neat PLA and PLA/GO nanocomposites crystallized in α form. Reference Zhang, Duan, Sato, Tsuji, Noda, Yan and Ozaki40,Reference Pan, Zhu, Kai, Dong and Inoue41 In Fig. 3(b), it should be noticed that the 2θ of PLA-0.1 peaks shifted to lower degrees compared with neat PLA, but it became larger with the increasing of GO. According to Bragg equation Reference Uvarov and Popov42 :
 $$2d\,\sin \,\theta = n\lambda \quad .$$
WAXD patterns of (a) neat PLA and PLA/GO nanocomposites and (b) the enlarged pattern.

The interplanar spacing which is indicated by factor d is an inverse to θ when θ is below 90°. Therefore, the interplanar spacing increased with the presence of GO, while it reduced as the content of GO increased, indicating that GO changed the arrangement compactness degree of PLA crystals, thus, affected the crystal growth.
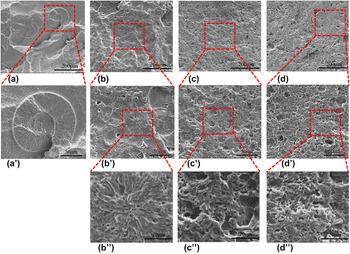
In Fig. 4, the SEM images of the etched neat PLA and PLA/GO nanocomposites after cryogenic fracture in liquid nitrogen more directly showed the crystal morphology. Typical spherulitic crystals were observed in both neat PLA and the PLA/GO nanocomposites. It was clear that the nucleation density of PLA spherulites increased in the PLA/GO nanocomposites as the GO content increased because of the nucleating effect of GO [and thus their size decreased from 100 μm for neat PLA to 40 μm for PLA-0.1—Fig. 2(a)]. From Fig. 4(a′), it was noticed that the center of neat PLA spherulites has been etched because it was a highly disordered crystalline domain with low crystallinity in the center, which etches more quickly than the dominant radial lamellae. Reference Dong, Kai, Pan, Cao and Inoue43 In contrast, the etched regions in the center of the spherulites of PLA/GO nanocomposites were much smaller, because the nucleating effect of GO resulted in highly ordered crystalline structures that were hard to etch. In addition, it was found that with the presence of GO, the morphology of PLA spherulites was irregular, especially for PLA-0.5 and PLA-1 samples. This is because the spherulite growth was restricted when the GO content was high due to the increased nucleation density of PLA spherulites, which resulted in the collision between spherulites. Moreover, the PLA chain mobility was also hindered by GO at high content, so that it was difficult for the PLA chain to arrange well into crystal lattice.
SEM images of (a) neat PLA, (b) PLA-0.1, (c) PLA-0.5, and (d) PLA-1 and their enlarged images.

C. Isothermal crystallization kinetics
In the above section, we found that the introduction of GO into the PLA matrix promoted crystallization. The overall isothermal melt crystallization kinetics was further investigated with DSC by isothermal crystallization of the samples at 120 °C. The relative crystallinity (X t ) at a particular crystallization time (t) can be calculated according to Eq. (2)
 $${X_t} = {{{Q_t}} \over {{Q_\infty }}} = {{\int_0^t {\left( {{{{\rm{d}}H} \mathord{\left/ {\vphantom {{{\rm{d}}H} {{\rm{d}}t}}} \right. \kern-\nulldelimiterspace} {{\rm{d}}t}}} \right){\rm{d}}t} } \over {\int_0^\infty {\left( {{{{\rm{d}}H} \mathord{\left/ {\vphantom {{{\rm{d}}H} {{\rm{d}}t}}} \right. \kern-\nulldelimiterspace} {{\rm{d}}t}}} \right){\rm{d}}t} }}\quad ,$$
where Q t and Q ∞ are the heats generated at time t and at infinite time, respectively, and dH/dt is the rate of heat evolution.
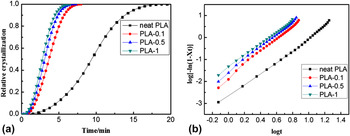
Figure 5(a) shows the development of relative crystallinity with crystallization time for neat PLA and PLA/GO nanocomposites. All the samples showed typical “S” shaped curves, and the relative crystallinity of PLA/GO nanocomposites was much higher than that of neat PLA and increased with increasing GO content for specific crystallization times.
Plots of (a) relative crystallinity versus crystallization time for neat PLA and PLA/GO nanocomposites in 120 °C and (b) the log[−ln(1 − X t )] versus log t.

The isothermal crystallization kinetics were further analyzed by the well-known Avrami equation: Reference Avrami44
 $$1 - {X_t} = \exp \left( { - k{t^n}} \right)\quad ,$$
where n is the Avrami constant relying on the nature of nucleation and growth geometry of the crystals, and k is the crystallization rate constant involving both nucleation and growth rate parameters.
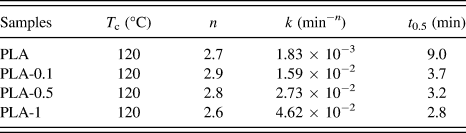
The related Avrami plots of all samples are illustrated in Fig. 5(b). The plots show a nearly linear relationship, hence, the n and k parameters were obtained from the slopes and the intercepts, respectively by linear fitting, and the Avrami parameters are listed in Table II. It was found that the average n was around 2.7 for both neat PLA and PLA/GO nanocomposites which was similar to the other literature, Reference Wu, Cheng, Feng, Yao and Zhang13,Reference Guo, Liu, Zhang and Huang45 indicating that the addition of GO did not influence the PLA crystal growth mechanism, which was a mixture of spherulitic growth and platelike growth.
Summary of the Avrami parameters.

The crystallization half-time (t 0.5) was utilized for a direct comparison of crystallization rates of the samples. The t 0.5 was obtained by Eq. (4) and summarized in Table II:
 $${t_{0.5}} = {\left( {{{\ln \,2} \over k}} \right)^{{1 \mathord{\left/ {\vphantom {1 n}} \right. \kern-\nulldelimiterspace} n}}}\quad .$$
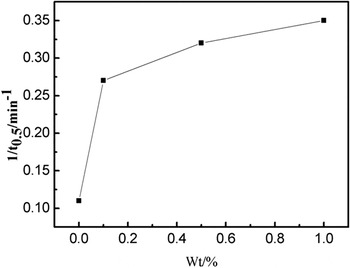
According to the crystallization half-time results, the crystallization rate increased with increasing of GO content during isothermal crystallization. In Fig. 6, the significant promotion of the 1/t 0.5 values of the nanocomposites compared with neat PLA suggested GO accelerated crystallization. However, when the content of the GO was high, the rate did not increase. This might be due to the reduction in chain mobility.
Variation of 1/t 0.5 versus the content of GO.

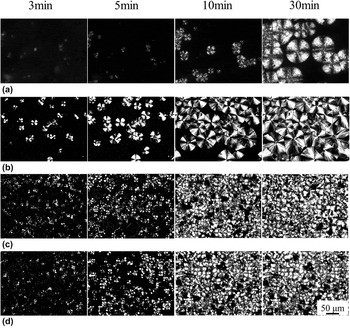
The crystallization process was characterized via POM. As shown in Fig. 7, it was clear that the crystallization behaviors of neat PLA and PLA/GO nanocomposites were quite different. When the crystallization time was 3 min, bare crystal nuclei can be observed in the neat PLA sample, while the PLA/GO nanocomposites showed more nuclei, indicating effective nucleation effect by GO. The spherulite number and size increased for all samples as the crystallization time increased, and the nucleation density was higher for PLA/GO nanocomposites compared to that of neat PLA. The spherulites formed in neat PLA at 30 min were large and perfect, while they were much smaller and less perfect for the nanocomposites with GO content of 0.5 and 1 wt%. These observations agree with the SEM results, which further demonstrate that the presence of excess GO prevented the formation of large crystalline domains, and resulted in smaller crystalline domains and a degraded spherulite morphology. It is noteworthy that the PLA-0.5 and PLA-1 showed similar crystallization behavior and their crystalline morphology did not change significantly from 10 to 30 min, which indicated that the crystallization rate of PLA-0.5 and PLA-1 were higher than that of neat PLA and PLA-0.1, and the effect of GO was insignificant when the GO content exceeded 0.5 wt%.
POM images reflecting crystallization process of (a) neat PLA, (b) PLA-0.1, (c) PLA-0.5, and (d) PLA-1.

D. Formation of nanopore in LTFP
We have researched the effect of GO on the crystal morphology and crystallization process. For low temperature foaming, because the soaking temperature is far below the melt temperature, the crystal structure was not destroyed, and only the amorphous region foam. This was a foaming process with crystal restriction. Thus, the crystal morphology was crucial in determining the pore morphology. For conventional foaming, the soaking temperature was close to T m so that the crystal region was melted and SC-CO2 can achieve absorption equilibrium quickly. When CO2 was released, porous PLA material was obtained. In that case, the size of pore is large (about 10–20 µm) as presented in Fig. 8(a).
Pore structure of (a) neat PLA in CFP and the pore structure of (b) neat PLA, (c) PLA-0.1, (d) PLA-0.5, and (e) PLA-1 in LTFP.

In this study, nanopores PLA and PLA/GO nanocomposites were prepared via LTFP. In Fig. 8(b), most pores of neat PLA were spindle-like, arranged from the center of the spherulite to the border because of the restriction of crystalline lamella. The whole area of SEM image was just like a spherulite and the pores occupied the amorphous region, which was a reflection of neat PLA crystal morphology in Fig. 4. Similar pores were observed in PLA-0.1 sample as shown in Fig. 8(c). Expectedly, due to the nucleating effect of GO, the size of spherulite was smaller, the crystal was less perfect and degree of crystallinity was higher, resulting in less amorphous region compared with neat PLA and thus smaller pores. For PLA-0.5 [Fig. 8(d)], it was difficult to find regions where the pores were arranged like a spherulite. This is consistent with crystal morphology of nanocomposites in Fig. 4. For PLA-1 [Fig. 8(e)], the size of the pores was larger compared with that of PLA-0.1 and PLA-0.5. Kuang Reference Kuang, Mi, Fu, Jing, Chen, Mou and Peng30 reported that the CO2 absorption ability increased with the addition of GO and desorption diffusivity decreased at the same time. Thus, PLA-1 might absorb more CO2, and release the CO2 more slowly, which would result in larger pores.
E. Crystallization and foaming mechanism of PLA/GO nanocomposites
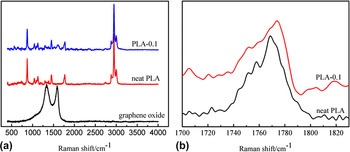
To understand the crystallization mechanism in PLA/GO nanocomposites in detail, the interactions between PLA and GO and the mobility of PLA chains were investigated by Raman spectroscopy. As seen in Fig. 9(a), the Raman spectrum obtained for GO showed two obvious characteristic peaks, representing the D (1270–1450 cm−1) and G (1580 cm−1) bands, respectively. The neat PLA exhibited characteristic peaks at 1768, 1454, and 874 cm−1. New peaks appeared in the spectra of PLA-0.1 at wavelengths corresponding to GO spectra, which confirmed the presence of GO in the PLA matrix. Li and Jeong Reference Li and Jeong46 reported that the characteristic peaks of poly(butylene terephthalate) (PBT) in PBT/EG nanocomposites were shifted by the interaction between PBT and EG. The C=O stretch (wavenumber ∼ 1768 cm−1) of PLA was enlarged in Fig. 9(b) to investigate the interactions between PLA and GO. The peak position of C=O stretch in PLA-0.1 shifted higher than that of neat PLA, demonstrating the interaction between PLA and GO potentially because of hydrogen bonding. This supports the idea that the PLA chain mobility decreased with increasing GO content due to intermolecular interactions.
Raman spectra of (a) neat PLA, PLA-0.1, and GO and (b) the representative Raman spectra of C=O stretch.

The schematic diagram of PLA/GO nanocomposite crystallization and LTFP is shown in Fig. 10. It has been reported that GO has strong nucleation ability and can provide the area for crystallite nucleation. Reference Xu, Chen, Wang, Tang, Li and Hsiao47,Reference Xu, Liang, Zhong, Li, Chen, Li and Li48 The PLA chains are easy to arrange onto a GO sheet forming crystal nuclei due to the interaction between PLA chain and GO. Thus, some low molecular weight PLA can be absorbed by GO sheets which would initiate the crystallization and result in high nucleation rates, due to the low interfacial free energy between PLA molecular chain and GO sheet. At low GO content (0.1 wt%), the nucleation sites provided by the GO sheets resulted in smaller spherulites compared with neat PLA. As the GO content increases, the number of nucleation sites were increased as well, which resulted in the collision and squeeze of spherulites with each other. Therefore, the spherulites formed in PLA-0.5 and PLA-1 were less perfect than that of PLA-0.1. During LTFP, it was difficult for CO2 to dissolve into crystal region so that most CO2 was absorbed by amorphous region. Therefore, only the amorphous region was foamed. Spindle-like nanopores were formed and arranged from the center of spherulite to the border because of restriction of crystal plates. The size of pores was smaller compared with neat PLA due to smaller spherulite and more perfect crystal structure. However, when the content of GO was high, as shown in Fig. 10(b), the interfacial area between PLA and GO increased and the interparticle distance became smaller, which resulted in reducing PLA molecular chain mobility. Combining with the restriction of the hydrogen bond, the crystal growth of PLA was suppressed. Therefore, although the nucleation effect was enhanced with the addition of GO, the crystallization rate was only improved slightly at high GO content. Moreover, due to the restriction effect, the PLA molecular chains can hardly be arranged into crystal lattice, which resulted in imperfect spherulite morphology. Thus, the amorphous region was irregular and spindle-like nanopores were much less. The arrangement of pores was not like spherulites because of imperfect crystal morphology. When the content of GO was higher, the addition of GO improved the absorption ability of CO2 and reduced the desorption diffusivity, which resulted in larger nanopore size.
Schematic diagram of crystallization and LTFP of PLA/GO nanocomposites with (a) low GO content and (b) high GO content.

IV. CONCLUSIONS
In the present work, a series of biodegradable PLA/GO nanocomposites with various GO contents ranging from 0.1 to 1 wt% were prepared by solution mixing. The spherulite morphology, nonisothermal and isothermal crystallization behavior of the nanocomposites were investigated comprehensively. The nonisothermal melt crystallization test revealed that the PLA/GO nanocomposites with higher GO content showed higher crystallinity. The WAXD results confirmed that the layered GO had been exfoliated in the nanocomposites, while the incorporation of GO did not modify the crystal structure of PLA. The SEM results confirmed that the incorporation of GO increased the total crystallinity and reduced the crystal size, indicating that GO was an effective nucleating agent for PLA. For isothermal melt crystallization, the overall isothermal melt crystallization rate was significantly greater in the nanocomposites than in neat PLA. However, when the content of GO was high (e.g., 0.5 wt%), the crystallization rate was only improved slightly due to the restriction of hydrogen bond and geometry hindrance. Spindle-like nanopores were prepared by LTFP and the restriction of pore growth by the lamella. The arrangement of nanopores was like spherulites. The pore size of PLA-1 was lager because the addition of GO improved the absorption ability of CO2 and reduced the desorption diffusivity.
ACKNOWLEDGMENTS
We would like to thank National Nature Science Foundation of China for the financial support (Contract Grant Nos. 21174044, 51573063, and 11272093); Guangdong Nature Science Foundation (Contract Grant No. S2013020013855); National Basic Research Development Program 973 in China (Contract Grant No. 2012CB025902); Guangdong Province Higher Vocational Colleges & Schools Pearl River Scholar Funded Scheme (2012); Fundamental Research Funds for the Central Universities (D2155470).