Introduction
Cephalaria joppensis (CJ) is a broad-leaved (dicotyledonous) wild annual winter plant that belongs to the Caprifoliaceae family (Gokturk and Sumbul, Reference Gokturk and Sumbul2014). Global distribution of CJ includes the Mediterranean woodlands, shrublands and other regions in Asia, South and North America and Africa with climate conditions similar to those in the Mediterranean region (Miron et al., Reference Miron, Weinberg, Chen, Miron, Raviv, Bloch, Yosef, Nikbahat, Zenou and Daklo2012). In Israel, CJ is found in most areas from Sderot in the south to Mount Hermon in the north. Commercial CJ sowed between December and January mostly blooms between April and July during the dry season (April–May), reducing the risk of post-harvest spoilage (Galili et al., Reference Galili, Hovav, Bellalou, Amir-Segev, Badani, Deutch, Rubinovich, Asher, Faraj and Singer2018). The plant can reach a height of over 2.5 m and has the potential for use as a new forage plant in Israel (Miron et al., Reference Miron, Raviv, Weinberg, Bloch, Porat, Nahim, Miron, Yosef, Nikbachat, Zenou, Adin, Portnik, Yakobi, Chen, Nashaf and Kushnir2010, Reference Miron, Weinberg, Chen, Miron, Raviv, Bloch, Yosef, Nikbahat, Zenou and Daklo2012; Leibovich et al., Reference Leibovich, Zenou, Yosef, Nikbachat, Kaadan, Eshtiwi, Nashef, Kushnir and Miron2013; Bellalou et al., Reference Bellalou, Badani, Amir-Segev, Deutch, Singer, Asher, Rubinovich, Shemesh and Galili2017, Reference Bellalou, Amir-Segev, Richker, Badani, Dekalo-Keren, Abu-Aklin, Cohen, Sidan and Galili2018; Galili et al., Reference Galili, Hovav, Bellalou, Amir-Segev, Badani, Deutch, Rubinovich, Asher, Faraj and Singer2018). Indeed, CJ has recently been domesticated in Israel as a forage plant at the Volcani Center of the Agricultural Research Organization. To accomplish this, a large genetic infrastructure was established, based on wild CJ populations collected from many locations, representing most of its natural growing sites in Israel. These populations were tested for yield (biomass), chemical composition and ruminant digestibility (Galili et al., Reference Galili, Hovav, Bellalou, Amir-Segev, Badani, Deutch, Rubinovich, Asher, Faraj and Singer2018). Variety and semi-commercial field trials showed that CJ has a high forage yield potential (7–15 t/ha), even under 300–350 mm of rain annually, which is below the average precipitation of most agricultural areas in Israel (Bellalou et al., Reference Bellalou, Badani, Amir-Segev, Deutch, Singer, Asher, Rubinovich, Shemesh and Galili2017). The chemical composition and digestibility of CJ are similar to those of wheat; it does not accumulate a high content of nitrates and can be easily preserved as silage or hay (Miron et al., Reference Miron, Raviv, Weinberg, Bloch, Porat, Nahim, Miron, Yosef, Nikbachat, Zenou, Adin, Portnik, Yakobi, Chen, Nashaf and Kushnir2010, Reference Miron, Weinberg, Chen, Miron, Raviv, Bloch, Yosef, Nikbahat, Zenou and Daklo2012; Bellalou et al., Reference Bellalou, Badani, Amir-Segev, Deutch, Singer, Asher, Rubinovich, Shemesh and Galili2017). Feeding trials have shown that CJ silage can replace wheat in a total mixed ration in dairy cow (Miron et al., Reference Miron, Weinberg, Chen, Miron, Raviv, Bloch, Yosef, Nikbahat, Zenou and Daklo2012) and sheep (Leibovich et al., Reference Leibovich, Zenou, Yosef, Nikbachat, Kaadan, Eshtiwi, Nashef, Kushnir and Miron2013) diets. Recently, a feeding experiment conducted on a commercial dairy farm in Israel found that CJ hay can replace wheat hay in the dairy cows’ diet (Shaani et al., Reference Shaani, Bellalou, Asher, Rubinovich, Spirer, Falach, Sabag, Liberman and Galili2022) and alfalfa hay in the dairy goats’ diet.
It has been shown that plant density affects yield and forage quality (Seiter et al., Reference Seiter, Altemose and Davis2004). Low plant density tends to lead to the development of more side branches than high plant density. However, the plants grown at high density have a thinner main stem (Volenec et al., Reference Volenec, Cherney and Johnson1987). Moreover, in high-density stands, there is a greater tendency for plants to lodge. A study on quinoa plants found that sowing at high density increases the forage yield of the plants and decreases the stem diameter, which can result in lodging (Asher et al., Reference Asher, Dagan, Galili and Rubinovich2022). An optimal stand ensures proper growth of the plants, efficient utilization of solar radiation and nutrients (Malek et al., Reference Malek, Shafiquzzaman, Rahman, Ismail and Mondal2012), and the ability to compete successfully with weeds (Harder et al., Reference Harder, Sprague and Renner2007; Hamoda et al., Reference Hamoda, Sary, Shoker and Roshdy2017).
In the current work, we examined CJ as a novel forage plant to increase the diversity of plants in the forage crop rotation. As a novel forage crop, the most suitable planting density and harvest timing for potential biomass yield and optimal nutritional parameters have yet to be determined for CJ. We hypothesized that appropriate planting density and harvest timing could enhance CJ productivity and nutritive value.
Materials and methods
Field trials
Two field trials were conducted at the Acre research farm of Western Galilee R&D (32°55′ N, 35°06′ E, 10 m a.s.l.). The soil is heavy grumusol with 60% clay, 3% chalk and low salinity with pH 7.6–7.9 (Nadav et al., Reference Nadav, Tarchitzky, Lowengart-Aycicegi and Chen2013). The climate is Mediterranean, with an average annual rainfall of about 500 mm distributed mainly between October and April. Most of the total rainfall occurs during the growing season (December–April), and in both experimental seasons, most rainfall occurs before February. Monthly average air temperatures in the 2019–2020 and 2020–2021 seasons are reported in Table 1.
Monthly total rainfall (mm) (a) and average temperature (°C) (b) at the Acre research farm during Cephalaria joppensis growing season in 2019–2020 and 2020–2021 (Israeli Meteorological Services)

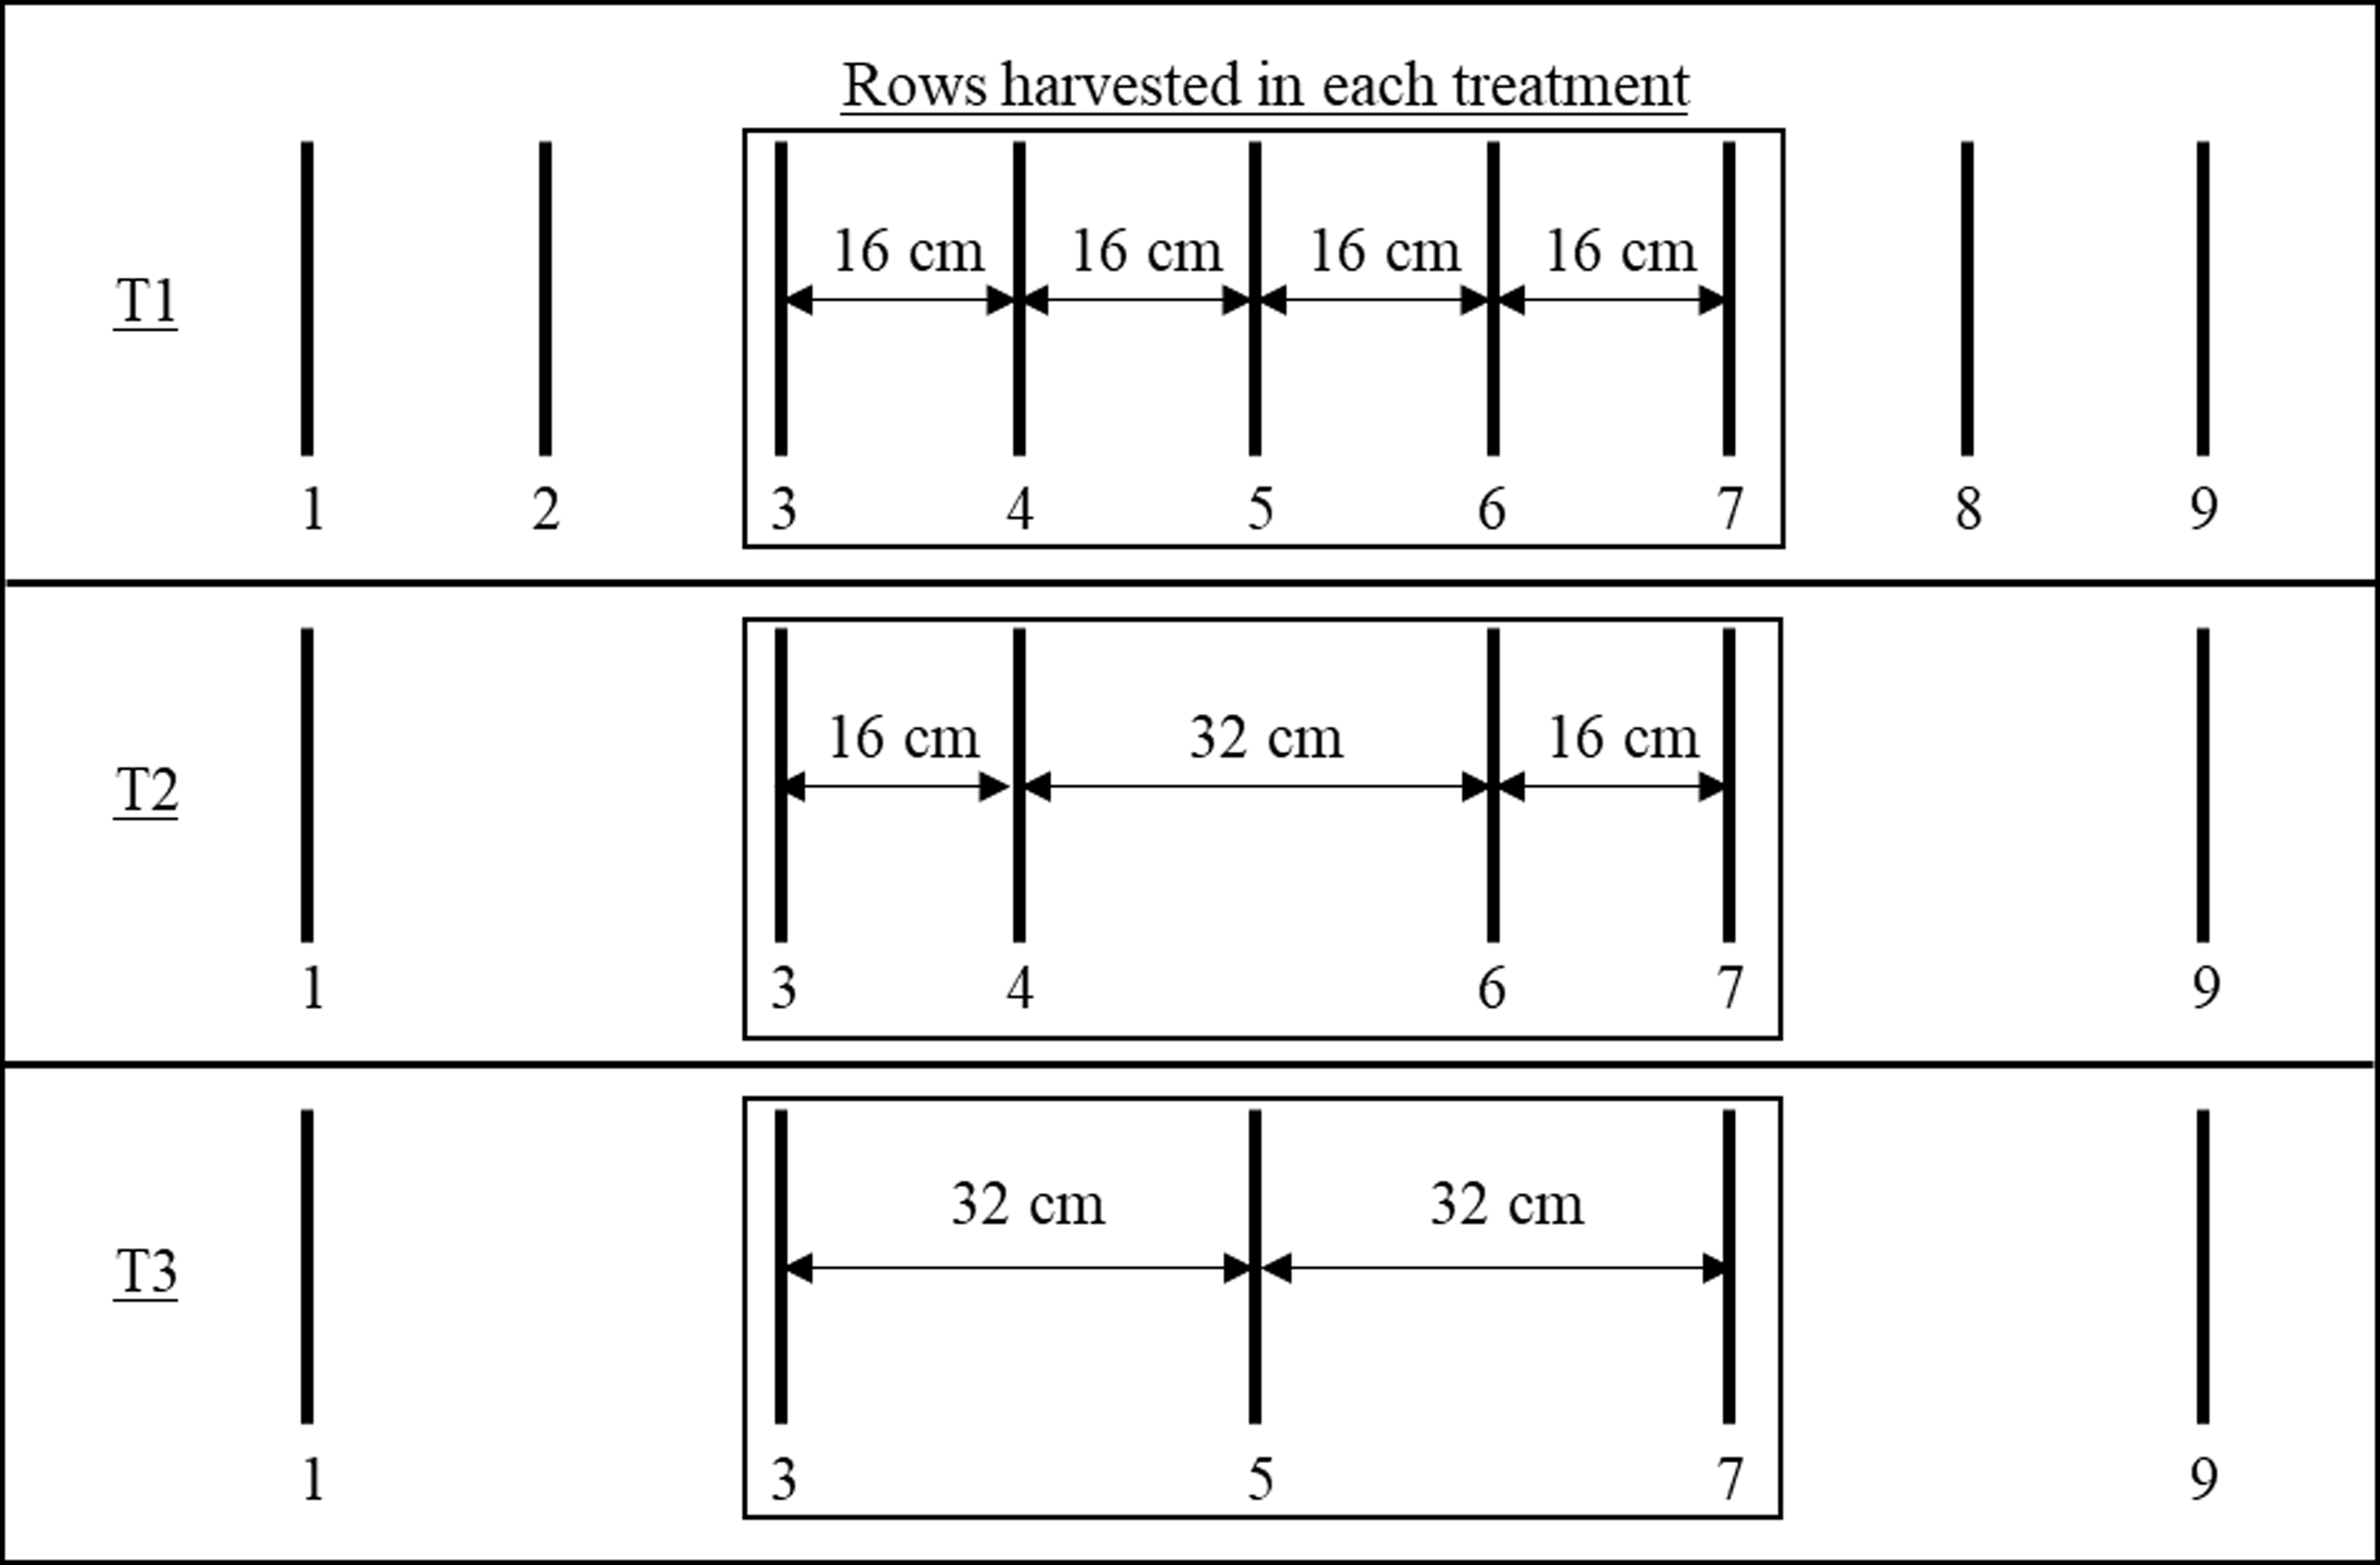
Two field trials were conducted with a randomized complete block design with 6 (trial 1) or 8 (trial 2) replicates. The experimental plot size was 26 m2 (2 m x 13 m). To examine three harvest dates, each experimental plot was divided into three sub-plots of 6 m2 (2 m x 3 m) with 2 m of space between them. The seedbed preparation included 600 m3/ha irrigation for pre-sowing weed germination, followed by the application of Roundup (2500 ml/ha) and Spotlight (350 ml/ha) herbicides, and the use of a rotary tiller, cultivator and roller. The plot received an essential 200 kg nitrogen (N)/ha fertilization as urea. Both experiments utilized seeds of CJ cv. Rishon (Dalia Seeds Ltd., Kibbutz Dalia, Israel). One trial was sown on 23 Dec 2019, and the second on 12 December 2020. Three-row spacing treatments were used in both experiments: T1 (narrow row spacing) – 16 cm between the rows; T2 (alternated row spacing) – 16 cm between a pair of adjacent rows, 32 cm between pairs; T3 (wide row spacing) – 32 cm between the rows (Fig. 1). Intra-row seed density was 42 seeds/m. Growth rate, area coverage rate and plant height were measured during the growing season, as described below. Relative canopy coverage was determined by photographing each plot from a height of about 1 m on days 43, 54 and 71 after sowing in the winter of 2019–2020, and days 31, 46 and 60 after sowing in the winter of 2020–2021, and running Elacanopy software, which calculates area coverage from the green pixels in each image (Easlon and Bloom, Reference Easlon and Bloom2014). The plant height in each plot was determined using a ruler, with measurements on days 91, 103, 124, 131, 138 and 147 after sowing for trial 1, and days 89, 100, 114, 122, 128, 138, 144, 151, 158 and 165 after sowing for trial 2. For yield determination, representative areas of 0.8 m2 for T1 and 0.96 m2 for T2 and T3 were harvested from each plot at pre-bloom (138 days after sowing), early bloom (147 days after sowing) and full bloom (158 days after sowing) in 2019–2020, and at pre-bloom (144 days after sowing), early bloom (158 days after sowing) and full bloom (165 days after sowing) in 2020–2021. The total harvested plant biomass of each sample was weighed to determine the sample’s fresh weight. Representative samples from each plot were dried at 60 °C for 3 days to determine the dry matter (DM) content and sample dry weight. Dry biomass yield (t/ha) was calculated by dividing sample dry weight (kg) by sample area (m2) x 10. In addition, three representative plants were taken from each plot to determine the main stem length (from the ground to the last internode) and the proportion of leaves, side branches and stems. The three plants were separated into leaves, lateral branches and stems, and each part was dried at 60 °C for 3 days. The relative proportion of each part was determined as the DM weight of the part relative to that of the whole plant. The dry samples were ground and sifted through a 1-mm sieve to determine forage chemical composition and digestibility.
Schematic of the row spacing treatments tested in this work. T1 (narrow row spacing): 16 cm between the rows (conventional spacing), T2 (alternated row spacing): pairs of adjacent (16 cm apart) rows with 32 cm spacing between pairs, T3 (wide row spacing): 32 cm between the rows. Row numbers are indicated at the bottom of each row spacing. The central rectangle in each treatment indicates the rows harvested in each row spacing treatment.

Forage chemical composition and digestibility
Ground dry samples were scanned with a Foss Near Infrared Systems model 5000 monochromatic spectrometer (Hoganas, Sweden). Determination of chemical composition and digestibility values (g/kg dry weight) included crude protein, ash, non-fibre carbohydrates (NFC), lignin, acid detergent fibre (ADF) and neutral detergent fibre (NDF); in vitro DM digestibility (IVDMD) and NDF digestibility (NDFD) were determined by near-infrared reflectance spectroscopy (NIRS) and calibration formulas previously developed using the equations in Dos Passos Bernardes et al. (Reference Dos Passos Bernardes, Tremblay, Bélanger, Seguin, Brégard and Vanasse2016) modified by Galili et al. (Reference Galili, Hovav, Bellalou, Amir-Segev, Badani, Deutch, Rubinovich, Asher, Faraj and Singer2018).
Statistical analysis
Data analysis was performed with JMP®, Version 16 (SAS Institute Inc., Cary, NC, 1989–2023). For the analysis of area coverage, main stem length and forage yield, a mixed model was used with row spacing, harvest and their interaction as fixed effects, and block and plot nested in row spacing and block as random effects. For organ weight ratios, this mixed model did not include the plot effect. The row spacing by harvest effect was significant for main stem length and the model was then applied for each harvest separately. Forage nutritional quality data were analyzed by two-way ANOVA with row spacing, harvest and their interaction as the effects. Where appropriate, row spacing was compared for both years together, adding year and year-by-row spacing effects to the mixed model and nesting block within a year. Posthoc comparisons were performed using the Tukey HSD test (alpha = 0.05). Overall comparisons of growth rates from day 90 onwards were performed using a mixed model with row spacing (categorical), day (continuous) and their interaction as fixed effects, and block and plot nested in row spacing and block as random effects. Row spacing treatment growth rates were compared pairwise by t-tests on the linear coefficients obtained. In all cases, statistical significance was set at alpha = 0.05.
Results
Effect of plant density on canopy coverage
The area coverage rate of the different sowing designs in the two growing seasons is shown in Fig. 2. In the 2019–2020 season, the area coverage rate of T1 was significantly higher than that of T2, which was significantly higher than the area coverage rate of T3. T1 plants reached 0.5 area coverage 58 days after sowing, T2 plants 62 days after sowing and T3 plants 68 days after sowing (Fig. 2a). In the 2020–2021 season, the area coverage rate of T1 was significantly higher than that of T2 plants at all measurement points. The area coverage rate of T2 plants was only significantly higher than that of T3 plants 60 days after sowing. T1 plants reached 0.5 area coverage 50 days after sowing, T2 plants 53 days after sowing and T3 plants 55 days after sowing (Fig. 2b).
Influence of row spacing on relative canopy coverage of Cephalaria joppensis plants in the 2019–2020 (a) and 2020–2021 (b) growing seasons. T1 (narrow row spacing): 16 cm between the rows, T2 (alternated row spacing): pairs of adjacent (16 cm apart) rows with 32 cm spacing between pairs, T3 (wide row spacing): 32 cm between the rows. Dashed black line indicates 50% canopy coverage. Each point indicates a mean and standard error from at least 24 replicates. Different letters at each time point indicate significant difference at P < 0.05 by Tukey HSD t-test.

Effect of plant density on plant height and growth rate
Plant height for the different sowing designs in the two growing seasons is presented in Fig. 3. In the 2019–2020 season, till 90 days after sowing, the plant height of T1 and T2 plants was significantly higher than that of T3 plants. Then, from 90 to 147 days after sowing, the plant height of T2 and T3 plants was significantly higher than that of T1 plants (Fig. 3a). Till 90 days after sowing, the daily growth rate of T1 and T2 plants was about 0.70 cm/day, which was significantly faster than 0.56 cm/day for T3 plants. Then, from 90 to 147 days after sowing, the growth rate increased to 3.21 cm/day in T1 plants, which was significantly slower than the growth rate of T2 plants (3.37 cm/day) and slower than the growth rate of T3 plants (3.66 cm/day). Similar results were obtained in the 2020–2021 season (Fig. 3b). Till 90 days after sowing, the plant height of T1 plants was significantly higher than that of T3 plants and the plant height of T2 plants did not significantly differ from those of the two other row spacings. From 90 to 165 days after sowing, the plant height of T2 and T3 plants was significantly higher than that of T1 plants. Till 90 days after sowing, the daily growth rate of T1 (0.82 cm/day) was significantly faster than that of T3 (0.71 cm/day). The growth rate of T2 (0.75 cm/day) plants did not significantly differ from the growth rate of the two other row spacings. Then, from 90 to 165 days after sowing, the daily growth rates of T3 (3.09 cm/day) and T2 (3.05 cm/day) plants were significantly faster than that of T1 plants (2.94 cm/day).
Influence of row spacing on Cephalaria joppensis plant height in the 2019–2020 (a) and 2020–2021 (b) growing seasons. T1 (narrow row spacing): 16 cm between the rows, T2 (alternated row spacing): pairs of adjacent (16 cm apart) rows with 32 cm spacing between pairs, T3 (wide row spacing): 32 cm between the rows. Each point indicates a mean and standard error from at least 24 measurements. Different letters for each growing period 0–90 and 90–147/165 days after sowing indicate significant difference in plant growth rates for the row spacing treatments at P < 0.05 by Tukey HSD t-test.

Effect of row spacing on main stem length
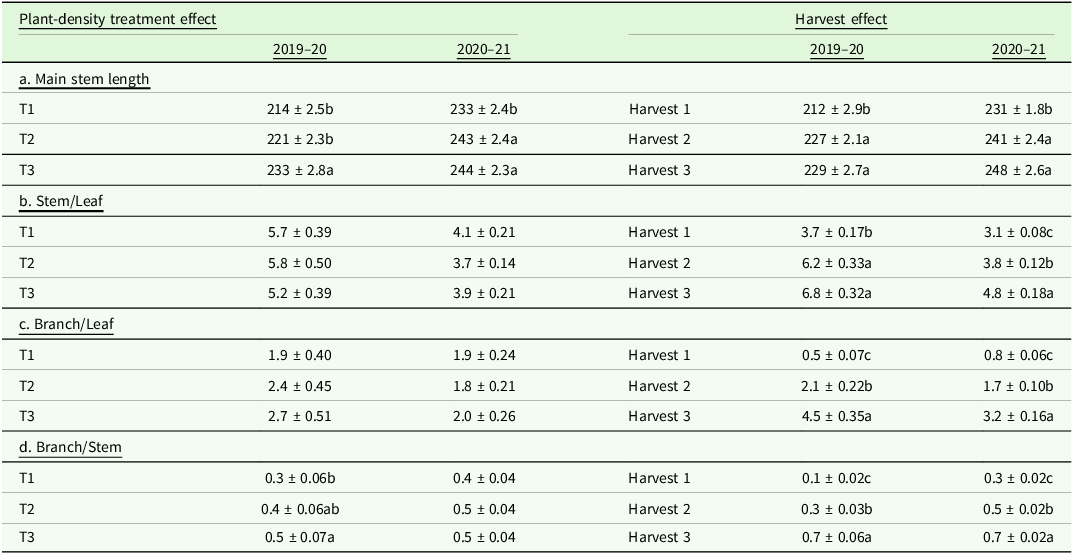
The main stem length at harvest is presented in Table 2a. In the 2019–2020 season, the main stem length of T3 plants was significantly higher than that of T2 and T1 plants. In addition, plants exhibited a continuous increase in main stem length from pre-bloom through early bloom to full-bloom stages. In the 2020–2021 season, the main stem lengths of T3 and T2 plants were significantly higher than that of T1 plants. In addition, the main stem length in the last two harvests was significantly higher than in the pre-bloom harvest.
Effect of row spacing treatments and harvest time on main stem length (cm) (a), stem-to-leaf ratio (b), branch-to-leaf ratio (c), and branch-to-stem ratio (d) in each growing season. T1 (narrow row spacing): 16 cm between rows (conventional row spacing), T2 (alternated row spacing): pairs of adjacent (16 cm apart) rows with 32 cm spacing between pairs, T3 (wide row spacing): 32 cm between the rows. Data indicate mean ± standard error

Different letters in each column/row indicate significant differences between treatments/harvests in each year at P < 0.05 by Tukey HSD t-test.
Effect of row spacing on leaf, stem, and branch weight ratios
The weight ratios among the plant leaves, stems and branches are shown in Table 2b–d. No significant differences were found among the different row spacings, except for the branch-to-stem ratios in the 2019–2020 season, where that of T3 was significantly higher than that of T1. The branch-to-stem ratio of T2 did not differ from the other two row spacings (Table 2d). In contrast, in both growing seasons, there were significant differences in organ ratios among the three harvest dates. In both the 2019–2020 and 2020–2021 seasons, the stem-to-leaf (Table 2b), branch-to-leaf (Table 2c) and branch-to-stem ratios (Table 2d) increased significantly from the pre-bloom to full-bloom stage. The stem-to-leaf and branch-to-leaf ratios in the 2019–2020 season were significantly higher than their counterparts in the 2020–2021 season, but no significant difference was found between the two growing seasons in the branch-to-stem ratio (Table 3).
Effect of growing seasons on stem-to-leaf, branch-to-leaf and branch-to-stem ratios of Cephalaria joppensis. Data indicate mean ± standard error

Different letters in each column indicate significant differences between seasons at P < 0.05 by Tukey HSD t-test.
Effect of row spacing on forage yield
The forage dry biomass yield of the three harvests is presented in Fig. 4a and 4c. In the 2019–2020 season, significant differences were observed between the row spacings for all harvests. In the pre-bloom harvest, the dry biomass yield for T2 was significantly higher than that for T3, which was significantly higher than that for T1. In the early bloom and full-bloom harvests, the dry biomass yields for T2 and T3 were significantly higher than that for T1 (Fig. 4a). Bivariate analysis showed that the average dry biomass yield of all row spacings for the full-bloom harvest was significantly higher than those for the pre-bloom and early bloom harvests (Fig. 4a). The dry biomass yields of T2 and T3 were significantly higher than that of T1 (data not shown). No significant differences were found in DM content among the row spacings in each harvest. The average DM content of all row spacings in the pre-bloom harvest was about 254 g/kg and was significantly lower than the DM content in the early bloom harvest, which was about 276 g/kg; the latter, in turn, was significantly lower than the DM content in the full-bloom harvest, which was about 338 g/kg (Fig. 4b).
Effect of plant density and harvest date (days from sowing) on dry biomass yield (a, c) and DM content in plants (b, d) of Cephalaria joppensis in the two growing seasons of 2019–2020 (a, b) and 2020–2021 (c, d). T1 (narrow row spacing): 16 cm between the rows, T2 (alternated row spacing): pairs of adjacent (16 cm apart) rows with 32 cm spacing between pairs, T3 (wide row spacing): 32 cm between the rows. Columns indicate mean ± standard error from at least six replicates. Different lowercase letters indicate significant differences between the row spacing treatments on each harvest date at P < 0.05 by one-factor Tukey HSD t-test. Different uppercase letters indicate significant differences between harvest dates at P < 0.05 by two-factor Tukey HSD t-test.

In the 2020–2021 season, no significant differences were found in dry biomass yield or DM content among row spacings for each harvest. In the pre-bloom harvest, the average dry biomass yield of all row spacings was significantly lower than the average dry biomass yields in the early bloom and full-bloom harvests (Fig. 4c). The average DM content of all row spacings in the pre-bloom harvest was about 249 g/kg and was significantly lower than the DM content in the early bloom harvest, which was about 327 g/kg, the latter being significantly lower than the DM content in the full-bloom harvest, which was about 362 g/kg (Fig. 4d).
Effect of plant density on forage chemical composition and digestibility
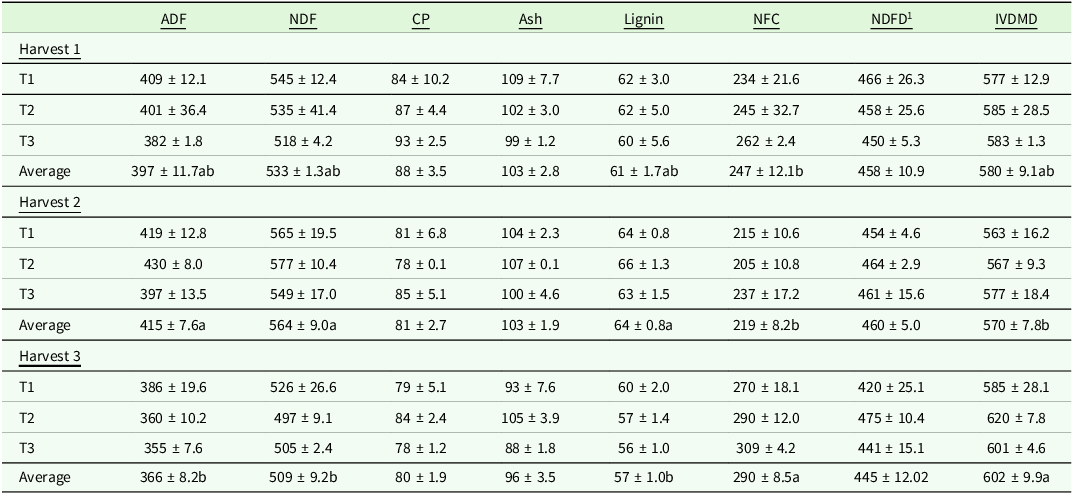
The chemical composition and digestibility values of CJ plants in the different harvests in the 2019–2020 season are presented in Table 4. No significant differences were found in the chemical composition or digestibility of the plants among the row spacings or the different harvests (Table 4). The average chemical composition and digestibility values of CJ plants over the three harvests were: crude protein 83 g/kg, ash 100 g/kg, lignin 60 g/kg, ADF 390 g/kg, NDF 540 g/kg, NFC 250 g/kg, NDFD 460 g/kg NDF and IVDMD 580 g/kg DM.
Forage quality data (g/kg dry matter) from Cephalaria joppensis plants grown in 2019–2020 for the different harvests and treatments (T1–T3, defined in Table 2). Data are mean ± standard error of three repetitions

Different letters in each column indicate significant differences between harvests at P < 0.05 by Tukey HSD t-test.
1g/kg NDF.
ADF – acid detergent fibre; NDF – neutral detergent fibre; CP – crude protein; NFC –non-fibre carbohydrates; NDFD – NDF digestibility; IVDMD – in vitro dry matter digestibility.
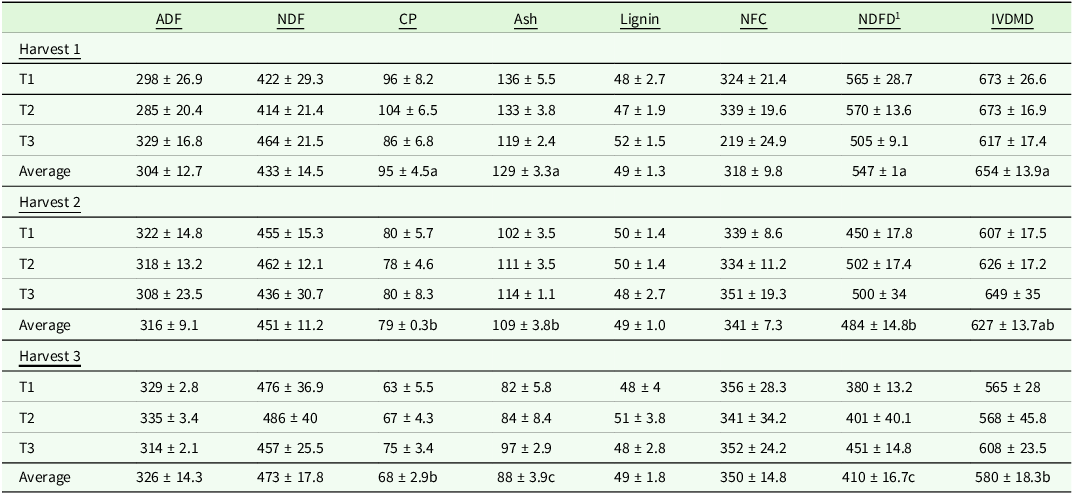
The chemical composition and digestibility of CJ plants in the different harvests in the 2020–2021 season are presented in Table 5. No significant differences were found in the chemical composition or digestibility of the CJ plants among the different row spacings. However, significant differences were found between the harvests in average crude protein, ash, NDFD and IVDMD. The amount of crude protein in the pre-bloom harvest was significantly higher than in the early bloom and full-bloom harvests. The average ash content in the pre-bloom harvest was significantly higher than in the early bloom harvest, and the latter was significantly higher than in the full-bloom harvest. The NDFD in the pre-bloom harvest was significantly higher than in the early bloom harvest, and the latter was significantly higher than that in the full-bloom harvest. The IVDMD in the pre-bloom harvest was significantly higher than that in the full-bloom harvest, whereas that in the early-bloom harvest did not differ significantly from the other two harvests (Table 5).
Forage quality data (g/kg dry matter) from Cephalaria joppensis plants grown in 2020–2021 for the different harvests and treatments (T1–T3, defined in Table 2). Data are mean ± standard error of three repetitions

Different letters in each column indicate significant differences between harvests at P < 0.05 by Tukey HSD t-test.
1g/kg NDF.
ADF – acid detergent fibre; NDF – neutral detergent fibre; CP – crude protein; NFC –non-fibre carbohydrates; NDFD – NDF digestibility; IVDMD – in vitro dry matter digestibility.
Discussion
The potential of CJ as a new forage crop in Israel, and possibly in other countries with a Mediterranean climate, was previously demonstrated (Miron et al., Reference Miron, Raviv, Weinberg, Bloch, Porat, Nahim, Miron, Yosef, Nikbachat, Zenou, Adin, Portnik, Yakobi, Chen, Nashaf and Kushnir2010; Bellalou et al., Reference Bellalou, Badani, Amir-Segev, Deutch, Singer, Asher, Rubinovich, Shemesh and Galili2017, Reference Bellalou, Amir-Segev, Richker, Badani, Dekalo-Keren, Abu-Aklin, Cohen, Sidan and Galili2018; Shaani et al., Reference Shaani, Bellalou, Asher, Rubinovich, Spirer, Falach, Sabag, Liberman and Galili2022). The current work examined the effect of plant density and harvest date on various characteristics of CJ for forage.
Canopy coverage
The rate of canopy coverage increased with increasing planting density. This is not surprising because the number of plants per unit area increased. A similar phenomenon has been observed with other forage plants, such as quinoa (Asher et al., Reference Asher, Dagan, Galili and Rubinovich2022) and amaranth (Moshaver et al., Reference Moshaver, Emam, Madani, NourMohamadi and Heidari-Sharifabad2015). High plant density gives the plants a competitive advantage over weeds for nutrients and water in the soil and light used for photosynthesis (Aharon et al., Reference Aharon, Peleg, Argaman, Ben-David and Lati2020). Increasing the area coverage may allow the CJ plants to compete more effectively with weeds and other pests as they establish themselves, as has been observed with rice (Arvind et al., Reference Arvind, Satish, Shalabh, Bhagirath, Jerome, Ramaiah, Dule and Shrivastava2009). This can offer a solution to the limited number of safe herbicides for CJ cultivation. The differences in coverage rate between the two seasons might have resulted from changes in the amount and distribution of precipitation events, and air and ground temperatures (Larbi et al., Reference Larbi, Abd El-Moneim, Nakkoul, Jammal and Hassan2011; Huang et al., Reference Huang, Gao, Nan and Zhang2017, Reference Huang, Matthew, Li and Nan2021; Sievers and Cook, Reference Sievers and Cook2018), or be due to the different sowing dates between the two seasons, which could affect seed germination and seedling growth rates (Tenikecier, Reference Tenikecier2021).
Plant height and growth rate
In both growing seasons, the influence of plant density on plant height was divided into two periods. Up to 90 days after sowing, T1 plants were taller than T2 and T3 plants. After that, the situation reversed, and the T2 and T3 plants grew taller than the T1 plants. This could be due to greater competition between plants sown at high density in the first period, and less lodging of plants sown at low density in the second period. Different studies have found different effects of plant density on plant height. In ryegrass (Kusvuran and Tansi, Reference Kusvuran and Tansi2011), sorghum (Porfirio et al., Reference Porfirio, Neres, Fuhr, da Silva and Guimarães2021) and rice (Nakano et al., Reference Nakano, Hattori and Morita2014), there is no effect; in cabbage (Kuai et al., Reference Kuai, Sun, Zuo, Huang, Liao, Wu, Lu, Wu and Zhou2015; Cacan and Kokten, Reference Cacan and Kokten2017) and soybean (Seiter et al., Reference Seiter, Altemose and Davis2004), higher plant density decreases plant height; in peas, on the other hand, higher sowing density increases plant height (Karadeniz and Bengisu, Reference Karadeniz and Bengisu2022). Moreover, in the current work, there were no differences in main stem length between the last two harvests. This could be due to cessation or slowing of plant growth after flowering, as flowering and growth rate are often positively correlated (Kebede et al., Reference Kebede, Subudhi, Rosenow and Nguyen2001; Bolmgren and Cowan, Reference Bolmgren and Cowan2008; Kumar et al., Reference Kumar, Hash, Singh, Nepolean and Srivastava2021; Stagnati et al., Reference Stagnati, Busconi, Soffritti, Martino, Lanubile and Marocco2021). A similar phenomenon has also been observed in previous work on CJ (Galili et al., Reference Galili, Hovav, Bellalou, Amir-Segev, Badani, Deutch, Rubinovich, Asher, Faraj and Singer2018), berseem clover (Galili et al., Reference Galili, Levana and Leshem1998) and corn (Troyer and Larkins, Reference Troyer and Larkins1985).
Relative distribution of the plant leaves, stems and branches
The leaf-to-stem ratio is an important trait during forage harvest. The leaves are usually of better quality than the stems and therefore, the higher the proportion of leaves, the higher the quality of the plant material for forage (Annicchiarico, Reference Annicchiarico2007; Bilgili et al., Reference Bilgili, Cifci, Hanoglu, Kl and Acikgoz2009; Rao and Northup, Reference Rao and Northup2012). The quality of the chemical composition of the side branches, which are young stems, is usually intermediate between those of the main stems and leaves (Ben-Moshe et al., Reference Ben-Moshe, Brener, Baram, Barkai, Dvash, Yonatan, Lifshitz, Landau, Leshem and Nitzan2003). In the current study, there was no difference in the stem-to-leaf ratio among row spacings or between the two growing seasons, similar to observations in alfalfa plants (Mattera et al., Reference Mattera, Romero, Cuatrín, Cornaglia and Grimoldi2013), berseem clover (Rajab and Kasem, Reference Rajab and Kasem2022) and forage beans (Joshi et al., Reference Joshi, Patel, Dharaviya and Patel2024). In contrast, plant density increases the stem-to-leaf ratio in cowpea (Salem et al., Reference Salem, El-Naby, Zeinab and Nasr2012). Moreover, a decrease in stem-to-leaf ratio was found in fennel plants used for forage when harvesting was delayed, due to leaf senescence (Reta-Sánchez et al., Reference Reta-Sánchez, Serrato-Corona, Quiroga-Garza, Gaytán-Mascorro and Cueto-Wong2015).
Forage yield
The dry biomass yield of T1—the conventional row spacing obtained in this study was similar to that previously obtained in experimental plots (Miron et al., Reference Miron, Raviv, Weinberg, Bloch, Porat, Nahim, Miron, Yosef, Nikbachat, Zenou, Adin, Portnik, Yakobi, Chen, Nashaf and Kushnir2010, Reference Miron, Weinberg, Chen, Miron, Raviv, Bloch, Yosef, Nikbahat, Zenou and Daklo2012; Galili et al., Reference Galili, Hovav, Bellalou, Amir-Segev, Badani, Deutch, Rubinovich, Asher, Faraj and Singer2018). Forage yield has been previously shown to increase with plant density for forage legumes (Baath et al., Reference Baath, Sarkar, Sapkota, Flynn, Northup and Gowda2024), quinoa (Asher et al., Reference Asher, Dagan, Galili and Rubinovich2022) and sorghum (Snider et al., Reference Snider, Raper and Schwab2012). In contrast, Porfirio et al. (Reference Porfirio, Neres, Fuhr, da Silva and Guimarães2021) found that low plant density increases the yield of forage sorghum. This might be because high plant density leads to reduced stem thickness (Asher et al., Reference Asher, Dagan, Galili and Rubinovich2022) and thus increases plant lodging, which may, in turn, cause a decrease in yield (Mahmood and Honermeier, Reference Mahmood and Honermeier2012). The DM content of the CJ plants varied from 276 to 362 g/kg in the last two harvests. This allowed cutting the CJ plants directly for silage production without additional wilting, reducing harvest costs. A similar result was obtained in a previous work on CJ (Bellalou et al., Reference Bellalou, Badani, Amir-Segev, Deutch, Singer, Asher, Rubinovich, Shemesh and Galili2017).
Forage chemical composition and digestibility
Forage chemical composition and digestibility of CJ plants were similar to previous results for CJ plants harvested at the pre-bloom stage (Bellalou et al., Reference Bellalou, Amir-Segev, Richker, Badani, Dekalo-Keren, Abu-Aklin, Cohen, Sidan and Galili2018; Galili et al., Reference Galili, Hovav, Bellalou, Amir-Segev, Badani, Deutch, Rubinovich, Asher, Faraj and Singer2018) and at the early bloom stage (Miron et al., Reference Miron, Raviv, Weinberg, Bloch, Porat, Nahim, Miron, Yosef, Nikbachat, Zenou, Adin, Portnik, Yakobi, Chen, Nashaf and Kushnir2010, Reference Miron, Weinberg, Chen, Miron, Raviv, Bloch, Yosef, Nikbahat, Zenou and Daklo2012; Bellalou et al., Reference Bellalou, Amir-Segev, Richker, Badani, Dekalo-Keren, Abu-Aklin, Cohen, Sidan and Galili2018). Plant density did not affect the forage’s chemical composition or digestibility in either season, in accordance with results found for summer legumes (Baath et al., Reference Baath, Sarkar, Sapkota, Flynn, Northup and Gowda2024); in contrast, in sorghum plants used for forage, higher plant density increases chemical composition and digestibility (Jahanzad et al., Reference Jahanzad, Jorat, Moghadam, Sadeghpour, Chaichi and Dashtaki2013). Although cell wall components and digestibility of berseem clover have been found to be strongly affected by the length of growth and flowering time (Galili et al., Reference Galili, Levana and Leshem1998), there were no differences in CJ forage chemical composition among the different harvests in the 2019–2020 season. This result is in contrast with previous studies on forage plants where the chemical composition and digestibility decreased with plant maturation (Galili et al., Reference Galili, Levana and Leshem1998; Foster et al., Reference Foster, Adesogan, Carter, Sollenberger, Blount, Myer, Phatak and Maddox2009; Northup and Rao, Reference Northup and Rao2015; Baath et al., Reference Baath, Sarkar, Sapkota, Flynn, Northup and Gowda2024). This could be because the older CJ plants produce more branches, which compensate for the decreased number of leaves. In the second season, no differences were found among the harvests in the cell wall components (ADF, NDF and lignin). Nevertheless, there was a decrease in crude protein content, ash, NDFD and IVDMD with plant maturation. The plants produced fewer lateral branches (Table 3), which have better nutritional quality than the main stem (Galili et al., Reference Galili, Hovav, Bellalou, Amir-Segev, Badani, Deutch, Rubinovich, Asher, Faraj and Singer2018) than in the first season.
Conclusion
Closer row spacing of Cephalaria joppensis provides an advantage at the beginning of growth, enabling the establishment of plants in the field and successful competition with weeds. Before conclusions can be drawn, this should be tested in semi-commercial and commercial plots. A later harvest date increased yield, thus, we should define the phenological stages of Cephalaria joppensis and their relationship to nutritional quality at different sites with different climate conditions in both small and semi-commercial plots.
Author contributions
AB, LG and IM conducted the field experiments. LR, AA and SG designed and supervised the field experiment, including data gathering. TDT conducted the chemical composition and digestibility tests. All authors contributed to discussing and interpreting the results, reviewed the manuscript and approved the final version.
Funding statement
This research received no specific grant from any funding agency, commercial or not-for-profit sectors.
Competing interests
The authors declare there are no conflicts of interest.
Ethical standards
Not applicable.