Implications
An efficient way of evaluating management strategies in a dairy herd is simulation modeling. In the current study, an existing simulation model of a dairy herd was modified by incorporating continuous genetic progress in the dairy population. The modified model found that when ignoring genetic progress, profitability of management strategies involving selective sale of heifers and use of sexed semen was underestimated. It was furthermore found that profitability of improving estrus detection was overestimated when genetic progress was ignored. This paper illustrates the importance of considering genetic progress when modeling a dairy herd.
Introduction
Herd simulation modeling has been recognized as a relevant method to study reproduction management strategies in a dairy herd (Marsh et al., Reference Marsh, Dijkhuizen and Morris1987; Dijkhuizen et al., Reference Dijkhuizen, Huirne and Morris1997; Herrero et al., Reference Herrero, Fawcett and Dent1999; Østergaard et al., Reference Østergaard, Chagunda, Friggens, Bennedsgaard and Klaas2005a). These simulation models estimate the technical and economic effects of certain replacement and reproductive strategies based on the phenotypic states of the individual animals over a number of years. Typically, the genetic levels of replacement heifers in these models are not different from those of the culling candidates in the herd; continuous genetic improvement in the population is ignored. Van Arendonk (Reference Van Arendonk1985) demonstrated with an optimization model that the proportion of cows for which replacement was voluntary in the optimum situation increased from 23.2% to 32.4% when annual genetic improvement quadrupled. This increase was explained by the genetic superiority of replacement heifers. Using a marginal net revenues approach, Allaire (Reference Allaire1981) found that optimal cow replacement rates were insensitive to the influence of different levels of genetic trend for milk yield potential.
The continuous increase of the genetic potential in the dairy population is often ignored when reproductive strategies are evaluated with simulation models. Improved reproductive efficiency allows for a higher selection intensity when determining which cows stay in the herd and produce offspring for future generations. When heifers are self-raised, excluding the fact that calves have a higher genetic potential than older cows and that high-yielding cows pass the genetic component of this higher yield onto their offspring will influence the effects of strategies that improve reproductive efficiency. Improved reproductive efficiency reduces the importance of non-pregnancy as a culling reason, which allows the farmer to put more emphasis on other culling reasons such as lowered milk yield and disease.
Several trends in dairy herd management may increase the importance of considering genetic progress in the evaluation of reproduction strategies: (i) the commercialization of sexed semen (SS); (ii) the development of electronic aids to detect estrus; and (iii) postponement of first insemination. The commercialization of SS has offered possibilities for intensified selection among dams to produce the next generation cows. The potential for genetic progress on herd and population levels has already been discussed decades before commercialization of the technique (Van Vleck and Everett, Reference Van Vleck and Everett1976; Hohenboken, Reference Hohenboken1999; Abdel-Azim and Schnell, Reference Abdel-Azim and Schnell2007; De Vries et al., Reference De Vries, Overton, Fetrow, Leslie, Eicker and Rogers2008). The expected net present value of various breeding strategies with SS and conventional semen were compared by Olynk and Wolf (Reference Olynk and Wolf2007). However, the increased genetic level of the produced dairy calves and their future offspring was not included and the production of heifer calves was evaluated as a separate enterprise rather than an integrated part of the dairy herd. In addition to the performance of the cows and prices of feed and milk, availability of replacement heifers is an essential aspect of the replacement issue for a dairy herd. For instance, culling of a cow is often postponed in case no replacement heifer is available; increasing heifer production is likely to change culling rates. With a bio-economic model, Ghavi Hossein-Zadeh et al. (Reference Ghavi Hossein-Zadeh, Nejati-Javaremi, Miraei-Ashtiani and Kohram2010) found a greater rate of genetic progress and a greater net profit when using SS compared with conventional semen. In this study, SS was used on both herd and population levels.
Another trend in modern dairy management is the development of electronic aids for estrus detection (Galon, Reference Galon2010). The technical and economic effects of improved estrus detection have been evaluated with a simulation model (Østergaard et al., Reference Østergaard, Friggens and Chagunda2005b), which included many aspects of herd dynamics, except for genetic progress in the dairy population. Estrus synchronization did not result in a greater genetic progress in the study of Ghavi Hossein-Zadeh et al. (Reference Ghavi Hossein-Zadeh, Nejati-Javaremi, Miraei-Ashtiani and Kohram2010).
In addition, an interesting reproductive management strategy is postponement of first insemination. It has been demonstrated that this affects herd dynamics in many ways (Sørensen and Østergaard, Reference Sørensen and Østergaard2003). However, the effect of the decrease in replacement rate and calf production caused by postponed insemination on genetic progress in the herd has not been explored yet. The objective of this study was to estimate the importance of including genetic progress in milk yield when evaluating SS use and other reproduction strategies in a dairy herd via dynamic simulation modeling.
Material and methods
General framework of the model
The model developed in this study, SimHerd V, is an extended and modified version of the mechanistic, dynamic and stochastic dairy herd model, SimHerd IV (Østergaard et al., Reference Østergaard, Chagunda, Friggens, Bennedsgaard and Klaas2005a). SimHerd IV simulates the production and state changes of dairy cows and young stock in a herd. The state of an animal is defined by age, parity, lactation stage, a permanent component of milk yield potential, actual milk yield, body weight, culling status, reproductive status (estrus and pregnancy), somatic cell count (actual and trades) and disease status.
The prediction of the current state is made week-by-week for each cow and heifer in the herd. The state of the individual animal is updated, and production and input consumption of the herd calculated. The drawing of random numbers by using relevant probability distributions triggers variation among animals and discrete events such as estrus detection, conception, abortion, sex and viability of the calf, diseases, involuntary culling and death. The production and development within the herd are thus determined indirectly by simulation of production and change in state of the individual cow and heifer. Model behavior can be controlled by a set of decision variables, which define certain production systems and management strategies.
In SimHerd IV, the permanent component for milk yield potential represents both the animal's genetic potential and the potential that can be contributed to the permanent environment. This value is drawn for each calf at birth from a normal distribution, regardless of the calf's dam or sire. SimHerd V was modified in two ways. First of all, the permanent component for milk yield potential was divided into a genetic component and a component for permanent environment. Secondly, the value for genetic milk yield potential was calculated as the average value of the calf's parents. These modifications are subsequently explained.
Modeling individual lactation curves
The Wilmink function was used to describe the fixed part of the lactation curves (Wilmink, Reference Wilmink1987). The lactation curve model was as follows:

where Yijk is the daily milk yield in kilograms (kg) of energy corrected milk (ECM) of cow i in lactation j at weekly time step k, W0ij is associated with the yield level (intercept), W1ij is the lactation curve slope after peak yield of cow i in lactation j, DIMijk is the lactation stage expressed as days in milk of cow i in lactation j at time step k, W2j is the parameter for the lactation curve's shape until the peak in lactation j. The value for W1ij is drawn randomly at each calving from a normal distribution with mean and variance parameters W1j and SD(W1j)2, respectively. Fixed values for W2j are used in lactation j. W0ij is drawn randomly at the start of every lactation from the normal distribution as follows:

where  is the permanent part of the cow's milk yield potential expressed as daily yield level in lactation 3. With
 being the mean for the daily milk yield level of third lactation cows,
 is the fixed effect of lactation j on the yield level in lactation j. The temporary environmental variance of the yield level in lactation j is represented by
 .
 contains a genetic component and a component for permanent environment. The genetic component (
 ) is calculated at birth as

where  is the genetic milk yield level of the dam of calf i, and W0sire the daily increase in milk yield potential of the sires. Genetic lag (GL) is a measure of the proven sires’ superiority over the unselected cow population. No individual sires are represented in the model; the genetic level for milk yield potential of the sires in equation (3) represents the population of Danish proven sires and is simulated as a trend progressing with daily time steps. The sires and therefore newborn calf's genetic level depends on the moment at which the calf is born in the simulation study (SimDay).
After calculating the genetic component of milk yield potential,  is calculated as follows:

Three values are sampled independently from normal distributions with parameters representing the Mendelian variance  , a quarter of the variance among sires
 and the variance caused by permanent environment
 . The first variance component represents variance caused by Mendelian sampling. The second component represents variance among proven sires, which is multiplied by 0.25, as a quarter of the individual's genetic variance comes from the paternal side. The third component represents the variance in permanent yield potential caused by permanent environment.
Parameterization of the lactation curves, variance components and genetic progress
In Denmark, the milk yield index (Y-index) is used to characterize the dairy cows’ and sires’ milk yield potentials. The Y-index describes the genetic potential for milk, protein and fat production. This also describes the genetic level of protein and fat content in milk and persistence of lactation curve (Nordic Cattle Genetic Evaluation, 2010). The genetic model for the Y-index is validated according to Interbull standards (Lidauer et al., Reference Lidauer, Pedersen, Pösö, Mäntysaari, Stranden, Madsen, Nielsen, Eriksson, Johansson and Aamand2006). The Y-index of proven sires has increased from 78.5 in 1988 to 110 in 2002, a linear increase of 2.25 units per year (Danish Cattle Organisation, 2007). One index unit expresses 49.4 kg of milk in first lactation. If the sire's Y-index is 1 unit higher than that of the dam, then first lactation 305-day milk yield of the daughter is 24.7 kg ECM higher compared with the dam (Danish Cattle Organisation, 2007). The genetic component of milk yield potential in first lactation expressed in kg ECM has increased between 1988 and 2002 with 111 kg (2.25 × 49.4) per year because of genetic progress. The increase in milk yield potential in a 305-day lactation of proven sires expressed as daily milk yield (W0sire) was therefore simulated with 0.0010 kg ECM per simulation day ((111/305)/365). Furthermore, the GL between sires and the unselected population of cows was assumed to be 20 index-units (two genetic standard units) corresponding to Danish practice. The GL expressed as daily milk yield was set at 3.24 kg ECM (20 × 24.7 × 2/305).
Variance components describing genetic and environmental variances in equations (3) and (4) were set in a way that met two objectives. First of all, they were set in a manner that resulted in a simulated phenotypic variance in milk yield as found for 39 Danish dairy herds. The breed of the cows in these herds was Holstein–Friesian and the average herd size was 137. The data set is described in detail by Thomsen et al. (Reference Thomsen, Østergaard, Sørensen and Houe2007). From these data, it was found that the phenotypic variances of daily milk yield in the first, second and third lactations were 15.6, 27.7 and 35.6 kg ECM, respectively. Second of all, the proportion of genetic variance in relation to the other sources of variance matched the documented values for heritability and repeatability. In Denmark, heritabilities of 305-day milk production were 0.43, 0.29 and 0.27 in first, second and third lactation Holstein cows, respectively (Danish Cattle Organisation, 2007). Heritability and proportion of variance caused by permanent environment for first lactation were set at 0.43 and 0.15, respectively. Mendelian variance  is half the total genetic variance and was therefore set at 3.35 kg (15.6 × 0.43 × 0.5) for the first lactation. The variance due to permanent environment
 was set at 2.34 kg (0.15 × 15.6). It was assumed that the genetic variance among the selected sires was reduced by 78% owing to strong selection – the ‘Bulmer effect’ (Falconer and Mackay, Reference Falconer and Mackay1996);
 was set at 1.0 kg.
The final variance components to specify after setting the variance components in equation (4) were the components representing temporary environment for the different parities in equation (2). Theoretically, they are equal to the phenotypic variances minus the genetic variance and variance of permanent environment. However, the simulation model also creates variance in the individual cow's milk yield by random occurrence of diseases. The variance components of temporary environment were therefore set by calibration. This was done by changing settings for the variance components until the model produced output for phenotypic variance in agreement with the earlier mentioned values found in 39 Danish dairy herds. An overview of all variance components and the settings for parameters from equation (1) are presented in Table 1.
Variance components of milk yield potential and parameters in the Wilmink function (Wilmink, Reference Wilmink1987) used by SimHerd to simulate phenotypic variance corresponding to data from 39 Danish dairy herds

1Obtained by calibration: variance components were adjusted until the model produced output for phenotypic variance that was in agreement with the values found in 39 Danish dairy herds (Thomsen et al., Reference Thomsen, Østergaard, Sørensen and Houe2007).
2Obtained from data analyses (Thomsen et al., Reference Thomsen, Østergaard, Sørensen and Houe2007), except for  and SD(W1j). These two components were obtained by calibration as described under footnote 1.
3W03 =  : the mean for daily milk yield level of third lactation cows.
The scenarios
Six different scenarios were simulated with the simulation model. These included a default scenario (DEF) and five variants of the DEF representing alternative reproduction strategies.
DEF
The DEF represented a typical Danish dairy herd.
Culling and reproduction
All parameters for culling and reproductive performance of cows and heifers are the model's default input parameters. They represent Danish conditions (Ancker et al., Reference Ancker, Sloth and Trinderup2008). Involuntary culling was defined as a constant risk of 0.003 per week for all cows. Voluntary culling was based on whether the cow became pregnant within the artificial insemination (AI) period. Cows with a milk yield higher or lower than the parity-specific median were specified to have an AI period until 301 or 259 days in milk, respectively. The AI periods were initiated 35 days after calving (voluntary waiting period) and cows were dried off 7 weeks before calving. A cow not pregnant after the AI period was replaced when a heifer entered the herd and the cow in question was the lowest yielding candidate for voluntary culling. The proportion of cows showing estrus after calving was set at 0.86. Conception rate to day 14 after AI was set at 0.53. An additional risk of fetal death, which includes early fetal death, was set at 0.13. Furthermore, an estrus detection rate per cycle of 0.45 was used. Reproductive disorders and the first estrus cycles after calving were modeled to have a detrimental effect on estrus detection and conception rates. Cows affected by other production diseases (e.g. mastitis, milk fever, ketosis and lameness) were more likely to get culled voluntarily, as diseases were modeled to lower milk yield and reproductive performance. Furthermore, a risk of involuntary culling and mortality was specified for each production disease. Heifers were sold in case no cows were selected for culling and a maximum number of 200 cows were reached. Heifers were purchased in case herd size reached a minimum number of 180 cows. In a mechanistic model such as SimHerd, culling rate is a result of the individual cows’ reproductive performance, disease occurrence, involuntary culling, mortality and the availability of replacement heifers.
Heifer management
The AI period for heifers was initiated at 392 days and terminated at 608 days; heifers were sold when not pregnant at this age. Heifers’ conception rate for conventional semen was set at 0.70 and the proportion of the conception rate obtained with SS was set at 85% (DeJarnette et al., Reference DeJarnette, Nebel, Meek, Wells and Marshall2007). Estrus detection rate was assumed to be 0.60.
Calving difficulty and production diseases
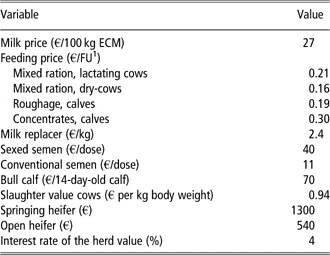
The probabilities of stillbirth and dystocia involving veterinary assistance for a female calf born from a nulliparous heifer were set at 0.04 and 0.05, respectively. These probabilities and important risk factors concerning difficulties around birth were based on scientific literature. Risk factors included an increased stillbirth risk for bull calves (simulated with a risk ratio (RR) of 1.2; Meyer et al., Reference Meyer, Berger and Koehler2000), increased stillbirth risk in case of dystocia (RR = 15; Chassagne et al., Reference Chassagne, Barnouin and Chacornac1999), increased dystocia risk for births of bull calves (RR = 2.0) and decreased dystocia risk for second or later calvings (RR = 0.20; Martinez et al., Reference Martinez, Freeman and Berger1983). Parameter settings concerning mortality risk and the risk of production diseases were set in a manner that was typical for Danish dairy farms with Holstein–Friesian cows (Enemark, Reference Enemark2007). The applied prices and costs were representative for Danish conditions in 2009 (Danish Cattle Organisation, 2009). The most important prices and costs are presented in Table 2. With the exception of labor associated with treatment of diseases, labor and management costs were not included as variable expenses.
Prices and costs used to economically quantify the simulated results of the default scenario

ECM = energy corrected milk.
1FU = feeding unit (1 FU = 7.89 MJ of net energy for lactation).
Improved estrus detection (IED) scenario
A scenario in which estrus detection was improved was designed in order to simulate the technical and economic impacts of using tools to detect cows’ estrus. Estrus detection rate was set at 0.80 in the IED scenario. In Denmark, equipment for electronic heat detection is available at a cost of €5880 for a herd of 100 cows (J. Borup, personal communication). The equipment is written off over a period of 6 years. The costs per cow-year for improved heat detection thereby amount to €9.8. All other parameters were equal to the DEF.
Improved estrus detection combined with selection among heifers (IED+)
A modified scenario of the IED scenario was designed. In anticipation of fewer cows getting culled because of increased reproductive efficiency, 20% of all heifers were set to be sold 3 months before calving in this scenario. Where heifers were being sold randomly in the default and IED scenarios (at calving, whenever no culling candidates were available), heifers with the lowest estimated breeding value (EBV) for milk yield were selected for sale 3 months before calving in the IED+ scenario. Every calf was assigned a simulated EBV at birth by adding a random number from a normal distribution with a mean of 0 and variance of 7.6 to the calf's true breeding value  . This ensured a correlation between simulated EBV and true breeding value of 0.62 or a squared correlation of 0.38, which equal the normal accuracy for heifer EBVs for production. The price of these earlier sold heifers was assumed to be €135 lower than the value reported in Table 2. The proportion of 20% was chosen in order to have the same number of cow-years and thereby the same ability to maintain herd size compared with the DEF.
SS scenario
The third scenario that was evaluated in this study was the use of SS on 50% of all heifers. Selection of heifers to breed with SS was based on the heifers’ EBV. Heifers were bred with SS during the entire insemination period. Culling strategy as described for the DEF was not altered; surplus heifers were sold regardless of their breeding value in case no culling candidates were available. However, a pregnant heifer via conventional semen was sold before a pregnant heifer via SS. Compared with the value for springing heifers in Table 2, a €100 higher price for pregnant heifers via SS was used.
Poor reproduction (PR) scenario
In a scenario representing a herd with poor reproductive management, conception rate and estrus detection rate were both lowered by 0.10 in comparison with the DEF and set at 0.43 and 0.35, respectively. Insemination periods and other parameter settings were equal to those in the DEF.
Postponed first insemination (PFI) scenario
In the final alternative reproduction strategy, the AI periods for primiparous cows were initiated 70 days later. The entire AI period was postponed, which means that the decision to stop breeding was set at 371 and 329 days for high- and low-yielding primiparous cows, respectively. All other parameters were equal to the DEF. These included an effect of calving interval on milk yield in the subsequent lactation. Daily milk yield during the first 24 weeks of the second lactation increased by 0.017 kg for each day the preceding calving interval increased (Sørensen and Østergaard, Reference Sørensen and Østergaard2003).
Sensitivity analysis
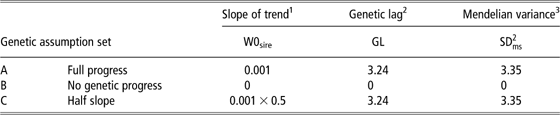
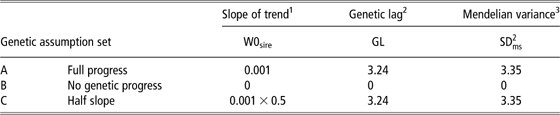
To identify the most important assumptions describing genetic progress in SimHerd V, a sensitivity analysis was performed. All six scenarios were simulated with three different assumption sets describing genetic progress (Table 3).
Parameters describing genetic progress that are adjusted in the three different sets of genetic assumptions under which the alternative reproduction strategies were compared to the default scenario
GL = genetic lag.
1Daily increase in milk yield potential (in kg energy corrected milk per day) of the sires (kg/day per day).
2Genetic lag: measure of the proven sires’ superiority over the unselected cow population.
3Variance caused by Mendelian sampling.
Genetic assumptions in set A represented full genetic progress as described in the section on parameterization. Set B ignored genetic progress. Therefore, the variance components for variance among sires  and Mendelian variance
 were set to 0. As a consequence, heritability was also 0. For the variance component for permanent environment
 and temporary environment for the three parities
 the same values were used as in SimHerd IV (Kristensen et al., Reference Kristensen, Ostergaard, Krogh and Enevoldsen2008). Therefore, the repeatability of milk yield (heritability and permanent environment) accounted for approximately 0.50 of the variance.
The genetic assumptions of set C represented a slower increase of genetic progress, and therefore the slope of the trend describing genetic milk yield potential of proven sires and GL was halved, respectively. The variance among sires was set at 1.5 in order to represent a less intensive selection of sires. Whether cows were given a short or long insemination period or whether cows were more or less susceptible for disease occurrence was based on their realized milk yields in relation to the parity-specific herd average. The aim was therefore to keep the phenotypic variance constant. The variances of temporary environment for the three parities  were therefore increased in set in order to keep total phenotypic variance constant.
Simulation and analysis procedure
A total of 18 simulations were performed (six scenarios with three genetic assumption sets). For each genetic assumption set, the six scenarios were simulated 1000 times over a period of 20 years where a different starting herd (number and states of all calves, heifers and cows at simulation start) was used for every replicate. Randomization of the starting herds for genetic assumption set A was performed as follows. One randomly generated initial herd was simulated 1000 times, over 15 years using parameters representing the DEF and parameters representing genetic assumptions set A. Milk yield potential  of all animals in this initial herd was set at 38 kg. Milk yield potential after running genetic assumption set A for 15 years corresponded to the current milk yield level of Danish dairy cows
 . Randomization was performed over 15 years in order for the genetic trend in milk yield potential to be present in the entire herd, that is, in order for the differences between animals in age and genetic potential to correspond to the genetic trend. The final 1000 herd states that resulted from this 15-year simulation were used as start herds for simulating the six scenarios under genetic assumption set A over 20 years; the time frame under study.
Similarly, 1000 randomized start herds were created for genetic assumption sets C. As genetic progress was ignored in assumption set B, randomizing herds for this assumption set was done as previously described, except for the fact that milk yield potential in the randomly generated initial herd was set at 42.6. Progress in milk yield in the different scenarios was studied over 20 years. Differences in the genetic component of milk yield potential for calves younger than 1 year between the scenarios remained stable after 15 years. Therefore, it was concluded that the model showed equilibrium in genetic progress after 15 years. The mean results of simulation years 16 to 20 were used to study the scenarios’ economic and technical effects. Five years of simulated results and 1000 replicates were used in order to obtain precise results. Total margin was calculated as the sales income minus the variable costs for cows and additional young stock.
Results
Technical and economic effects of the scenarios under study
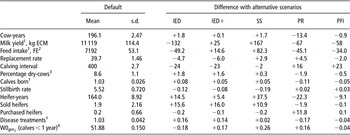
In Table 4, the technical results of the DEF are shown together with the differences of the five alternative scenarios. The results represent the averages of simulation years 16 to 20.
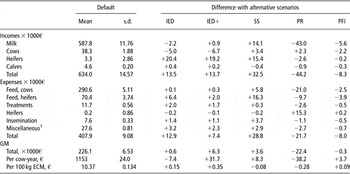
Average annual technical results of simulation years 16 to 20 where the genetic assumption set describing full progress was used for the default scenario and differences with five alternative scenarios; IED, IED+, SS on the 50% best heifers, overall PR efficiency and PFI

IED = improved estrus detection; IED+ = selectively selling heifers in addition to IED; SS = sexed semen; PR = poor reproduction; PFI = postponed first insemination; ECM= energy corrected milk.
1Per cow-year.
2FE = feeding units.
3Percentage of feeding days for dry-cows/total number of feeding days.
4 = average of the genetic component of milk yield potential (in kg ECM per day in lactation 3).
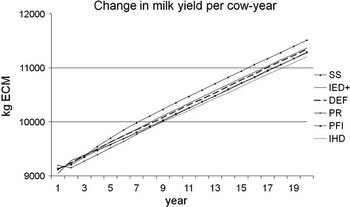
Compared with the DEF scenario, milk yield per cow-year for simulation years 16 to 20 was 25 and 167 kg ECM higher in the IED+ and SS scenarios, respectively. For the scenarios IED, PR and PFI milk yield per cow-year was on average 132, 67 and 58 kg ECM lower compared to DEF, respectively. Figure 1 shows how milk yield per cow-year changed over time in the six scenarios.
Increase in milk yield (kg ECM per cow-year) over time for the default scenario (DEF), improved estrus detection (IED), selectively selling heifers in addition to IED (IED+), sexed semen on the 50% best heifers (SS), overall poor reproductive efficiency (PR) and postponed first insemination (PFI).

In the DEF, milk yield per cow-year increased by 2218 kg ECM over 20 years, on average 111 kg per year. For SS, milk yield increased by 2389 kg during the same period. However, the slope of the SS scenario was especially steeper during years 4 to 6 when the first heifers from the SS program started entering the herd (Figure 1). The annual increase was on average 163 kg ECM per cow-year during these 3 years.
In Table 5, the average economic results of simulation years 16 to 20 of the DEF are shown together with the differences of the five alternative scenarios.
Average annual economic results of simulation years 16 to 20 where the genetic assumption set describing full progress was used for the default scenario and differences with five alternative scenarios; IED, IED+, SS on the 50% best heifers, overall PR efficiency and PFI

IED = improved estrus detection; IED+ = selectively selling heifers in addition to IED; SS = sexed semen; PR = poor reproduction; PFI = postponed first insemination; GM = gross margin; ECM= energy corrected milk.
1Interest on operating capital and various other costs per cow- and heifer-year.
In contrast to the DEF, gross margin (GM) per cow-year decreased by €7.4 in the IED scenario and increased by €31.7 where heifers were sold selectively in addition to improving estrus detection (IED+). GM per cow-year increased by €8.3 and €3.7 in the SS and PFI scenarios, respectively. However, total margin was lower and margin per kg ECM was higher in the PFI scenario compared with both the SS and DEF. In the scenario with PR, GM per cow-year and total GM were €38.2 and €22 400 lower, respectively. Differences in milk sales and feeding costs were especially important in the PR and PFI scenarios whereas income and costs associated with selling and raising heifers attributed mainly to differences in economic performance of the IED and IED+ scenarios. Differences in economics associated with both the production of milk and heifers were substantial for the SS scenario.
Sensitivity analysis
Sensitivity of the model's outcome for the parameters describing genetic gain was explored by performing the simulation study with modified genetic assumption sets as presented in Table 3.
Results of different genetic assumption sets
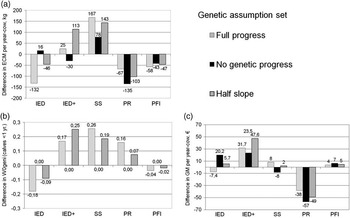
The simulated difference in ECM per cow-year between scenario-DEF and IED where full genetic progress was assumed is represented by the first bar from the left in Figure 2a. This value corresponds to the value of −132 kg reported in Table 4. Both the genetic and non-genetic effects of the scenarios are represented by the bars for full progress. The results for no genetic progress represent the non-genetic effects on milk yield and GM in Figure 2a and c, respectively. Except for milk production and feed intake per cow-year, technical effects of the scenarios presented in Table 4 were not different under the other genetic assumption sets.
Differences during simulation years 16 to 20 between the default scenario and the five simulated reproduction strategies (i.e. improved estrus detection (IED), selectively selling heifers in addition to IED (IED+), sexed semen on the 50% best heifers (SS), overall poor reproductive efficiency (PR) and postponed first insemination (PFI)) for (a) ECM per cow-year, (b) average of the genetic component of milk yield potential expressed as kg ECM per day in third lactation for calves younger than 1 year  and (c) gross margin (GM) per cow-year using the three different genetic assumption sets.

No differences in  for calves younger than 1 year were realized (Figure 2b) when genetic assumption set B was used as genetic progress was ignored. The difference between full progress and no genetic progress therefore represents the contribution of genetics alone in the five scenarios. Results for genetic assumption set C show to what extent the endpoints were sensitive to the assumptions made on the increase of breeding values among sires per time unit (i.e. slope).
Effects of including genetic progress
In the SS scenario, milk yield was 167 kg ECM per cow-year higher after 16 years compared with DEF when genetic progress was included in the model (the bar representing full progress for the SS scenario in Figure 2a). Milk yield increased by only 78 kg ECM in case no genetic progress was assumed (the bar representing no genetic progress for the SS scenario in Figure 2a). The latter increase was due to a higher replacement rate and a lower calving interval (Table 4). The fact that a larger proportion of offspring came from the 50% best heifers in the SS scenario was responsible for the remaining 89 kg (i.e. 167 to 78 kg). In contrast, for IED it can be stated that slower genetic progress, owing to the fact that cows producing offspring were on average older, was responsible for a 148 kg ECM lower milk yield per cow-year. This can be concluded from the fact that this reproduction strategy increased milk yield by 16 kg when genetic progress was ignored (no genetic progress in Figure 2a) and the effect when genetic progress was included was −132 kg ECM per cow-year (full progress in Figure 2a). Despite improved reproductive efficiency, there was only a minor increase of 16 kg and even a decrease of milk yield per cow-year for IED and IED+, respectively, when genetic progress was ignored (no genetic progress in Figure 2a). When ignoring genetic progress, the increase in GM for IED and IED+ was €20.2 and €23.5, respectively. The simulated average genetic potential of calves younger than 1 year  increased from 45.7 to 52.6 over a period of 20 years in the default herd. When expressing this milk yield potential as 305-day yield, it increased by 2147 kg ((52.6 to 45.7) × 305). In the SS scenario,
 increased up to 52.9; 305-d yield increased by 2226 and was 79 kg and thereby 4% higher compared to DEF. This means that the genetic difference between sires and calves was reduced by 79 kg in the SS compared with the DEF scenario.
Discussion
Method of describing genetic progress
The first step of including genetic progress in an existing dynamic, mechanistic and stochastic simulation model was adding a trend describing milk yield potential for proven sires. Genetic potential of offspring improved continuously over time based on the average of that of its dam and sire. However, it was only the potential to produce milk that was included in this study. Many studies have found the genetic correlation between production and reproduction (Dematawewa and Berger, Reference Dematawewa and Berger1998; Veerkamp et al., Reference Veerkamp, Koenen and de Jong2001; Konig et al., Reference Konig, Chang, Borstel, Gianola and Simianer2008) and between production and health (Windig et al., Reference Windig, Calus, Beerda and Veerkamp2006; Appuhamy et al., Reference Appuhamy, Cassell and Cole2009) to be antagonistic. Conception rates and disease risks were kept constant over time in our simulation study. In order to determine whether a scenario's profit was over- or underestimated as a result of excluding correlation between milk yield and functional traits, it should be realized that parameterization of the trend was based on the increase in (breeding value for) milk production in Denmark during the last 20 years. It has to be mentioned that in this period selection among sires and dams was not based on milk production only. Weight of functional traits in the breeding goal in Denmark was higher compared with countries such as the United States and Canada (Miglior et al., Reference Miglior, Muir and Van Doormaal2005). In other words, the slope describing the genetic potential of sires did not represent a breeding program focused on milk yield only. In that case, the slope would have reflected a maximum realizable progress in yield potential; the omission of correlation with functional traits would have been of larger concern.
Sensitivity analysis
Results from the sensitivity analysis clearly illustrated the importance of including genetic progress in milk yield when evaluating reproduction strategies in a herd. When ignoring genetic progress, economic performance of increasing estrus detection from 0.45 to 0.80 was overestimated by €27.6 per cow-year (€20.2 v. −€7.4). However, when modifying the IED scenario by selectively (IED+) instead of randomly selling heifers, profitability was underestimated by €9 per cow-year in case genetic progress was ignored (€23.5 v. €31.7). This was illustrated by Figure 2b, which shows the difference in genetic milk yield potential among calves, a measure of genetic progress in the herd. The low replacement rate in the IED scenario was responsible for a longer generation interval and lower turnover rate at the herd level. Fewer heifers, which on average are genetically superior over cows, entered the herd in the IED scenario. Only when IED was combined with selling heifers with the lowest breeding value, genetic progress was made despite an even lower replacement rate in this IED+ scenario (Table 4). Replacement rate also played an important role in explaining the smaller difference in genetic progress for the IED scenario when the simulation was performed with a slope half as steep representing a slower genetic progress among sires (half slope in Figure 2). The negative effect of a low-turnover rate was halved along with halving the slope.
Similarly, low replacement had a negative effect on genetic progress for IED+. However, owing to selective sale of heifers, this negative effect was compensated.
For the SS scenario, a reduction of the slope decreased genetic progress, milk yield and profit. In this scenario, age of the animals was important as many heifers calved each year (i.e. high replacement rate) and a higher proportion of the offspring in the herd were produced by heifers (via SS use) when compared to the DEF. The sensitivity to the assumed heritability in the IED+ and SS scenario was due to the fact that selection among heifers was performed in these scenarios. Response to this selection decreased with lower heritability.
The faster genetic progress in PR compared with DEF and the larger decrease in margin per cow-year when ignoring genetic progress could also be explained by the replacement rate. A higher replacement rate results in a smaller generation interval. When assuming a slope half as steep, the results for half slope were right between the results for full progress and no genetic progress in Figure 2.
In general, it could be concluded that when modeling genetic progress in the six scenarios, the results are not sensitive to the assumed GL between sires and the unselected cow population.
Genetic aspects in other modeling studies
To the authors’ knowledge, another model has been developed (Ghavi Hossein-Zadeh et al., Reference Ghavi Hossein-Zadeh, Nejati-Javaremi, Miraei-Ashtiani and Kohram2010) that predicts the performance at the herd level by simulating production and reproduction at the cow level and where the higher genetic potential of replacement heifers was included. Ghavi Hossein-Zadeh et al. (Reference Ghavi Hossein-Zadeh, Nejati-Javaremi, Miraei-Ashtiani and Kohram2010) also estimated a greater genetic progress when using SS compared with conventional semen, and no difference when using conventional semen and synchronizing estrus compared with no estrus synchronization. As cows were bred until 400 days after calving, synchronizing estrus and using SS with a lower conception chance had a minor effect on culling rates in the study of Ghavi Hossein-Zadeh et al. (Reference Ghavi Hossein-Zadeh, Nejati-Javaremi, Miraei-Ashtiani and Kohram2010). Only a small proportion of cows were culled because of being open more than 400 days. Furthermore, it was unclear as to what percentage of cows were culled and by what criteria. In our study, high- and low-yielding cows were not bred after 301 and 259 days, respectively. Therefore, improved heat detection had an important impact on replacement rate. Consequently, replacement rate explained the lower genetic progress in the IED scenario.
Other methods of modeling have explored the importance of including genetics. Van Arendonk (Reference Van Arendonk1985) quantified the effect of including genetic progress on optimal replacement policies by dynamic programming. When genetic improvement of replacement heifers was doubled, the average herd life decreased from 42.9 to 40.4 months, and the proportion of cows for which replacement was voluntarily increased from 26.3% to 32.4% (Van Arendonk, Reference Van Arendonk1985). However, in the study of Van Arendonk (Reference Van Arendonk1985) genetic information of only the father was included. The influence of the mother's breeding value on the production of her (grand) daughters was ignored. Allaire (Reference Allaire1981) used the marginal net revenue approach, where genetic merit for milk producing ability was transmitted from both parents. That study further supported that maximum phenotypic response is realized at a replacement rate between 28% and 32%. Selection intensity among dams decreased in case of higher replacement rates, which opposed the effects of a declining generation interval. In addition to an involuntary culling rate of 20%, voluntary culling was based solely on the cows’ ability to produce milk (Allaire, Reference Allaire1981).
In SimHerd V, cows are candidate for voluntary culling in case they fail to conceive within a certain insemination period. Subsequently, a culling candidate is culled when it becomes the lowest-yielding culling candidate at a time when a replacement heifer is available. The insemination period is specified to be shorter for cows yielding lower than the parity-specific herd average. If the culling model had differentiated more directly on the cow's genetic milk yield level in the culling decisions, then the model would have achieved a stronger selection among dams.
Selection intensities for voluntary culling are, in general, lower in SimHerd V compared with the model of Allaire (Reference Allaire1981). This might explain the more positive effect of a higher replacement rate on genetic progress as found in our study. The small effect on average herd life as found by Van Arendonk (Reference Van Arendonk1985) was stated as the reason for excluding genetic progress in more recently developed optimization models (De Vries, Reference De Vries2004; Groenendaal et al., Reference Groenendaal, Galligan and Mulder2004). However, as stated by De Vries (Reference De Vries2004), the effect of genetic improvement on optimal delayed replacement decisions is not clear and needs further studying.
Practical perspectives
Other than a discussion on the relevance of genetic improvement and the parameters describing it, this study contains important applications for dairy herd management. Improving estrus detection did not increase GM. However, GM per cow-year increased when this strategy was combined with selling 20% of the heifers selectively (IED+ v. IED). Despite a smaller calving interval, milk yield per cow-year was lower in the IED scenario when ignoring genetic progress. One explanation is that the number of dry-cows present in the herds at any point in time (Table 4) was 1.8% and 1.6% higher for IED and IED+, respectively. The average number of dry-cows present was calculated as the number of feeding days for dry-cows divided by the total number of feeding days for all cows. This means that on every day of the year, fewer cows were lactating in these herds. Another explanation was the higher number of disease treatments due to the scenarios’ lower replacement rates; high parity was specified to be a risk factor for many production diseases. Ignoring genetic progress over- and underestimates profitability of IED and IED+, respectively (Figure 2c). In terms of milk yield and GM, PR was performing worse than DEF. However, owing to a higher replacement rate (Table 4) a higher genetic level, due to a lower generation interval, was realized in PR (Figure 2b).
Breeding 50% of all heifers, based on their breeding value for milk yield, with SS increased GM by €8.3 per cow-year. When interpreting the practical significance of this 0.7% higher GM, it should be emphasized that the outcome is expected to be sensitive (not studied) to the price of milk, replacement heifers and feed. Furthermore, labor costs associated with for example the larger young stock herd (Table 4) were not included in the economic analysis. A comparison with other studies is difficult, as an analysis of the effects of SS on the production costs of replacement heifers, as well as increased availability of replacement heifers, has not been previously performed. In our study, the conception rate of conventional semen was set at 60% and the proportion of the conception rate of conventional semen obtained with SS was set at 85%. Olynk and Wolf (Reference Olynk and Wolf2007) calculated a difference in net present value of $4 per heifer between a breeding strategy with pure SS and conventional semen where conception rate of conventional semen was 58% and the proportion of SS was 90%. The difference in net present value dropped to −$10 in case the proportion for SS was 75%. When ignoring genetic progress in our study, similar to Olynk and Wolf (Reference Olynk and Wolf2007), a lower GM of €8 per cow-year was found for SS compared to DEF was found. Milk yield potential was 79 kg or 4% higher in the SS scenario compared to DEF. In other words, the genetic difference between sires and calves was reduced by 79 kg in the SS compared with the DEF scenario. The genetic impact of SS in commercial herds was studied by Abdel-Azim and Schnell (Reference Abdel-Azim and Schnell2007). They estimated the genetic superiority of first-lactation cows to be 11.1% in simulation years 16 to 20 when SS was extensively used in all commercial dairy herds when compared with the conventional system. The lower superiority in our study can be explained by the fact that SS was only used in the herd under study and not by all commercial herds; there was no contribution of the nucleus animals through the highly superior sires as described by Abdel-Azim and Schnell (Reference Abdel-Azim and Schnell2007). Furthermore, in our simulation study, only 50% of all heifers were bred with SS and heifers pregnant with SS were sold in case no replacement candidates among cows were available. The latter reason means that a stronger selection and a higher proportion of calves born from heifers could have been realized.
Postponing first insemination of primiparous cows by 70 days was found to reduce genetic progress, milk yield and margin per cow-year by €1.2 per cow-year. With an earlier version of the SimHerd model, Sørensen and Østergaard (Reference Sørensen and Østergaard2003) demonstrated that an analysis based on two subsequent lactations, as performed by Arbel et al. (Reference Arbel, Bigun, Ezra, Sturman and Hojman2001), overestimated profitability of extending first insemination. Replacement of cows affected the results and changed the conclusions drawn at the cow level. Our study has shown that profitability was slightly overestimated when genetic progress was ignored.
Conclusion
The importance of including genetic progress in evaluating reproductive strategies by simulation modeling was illustrated in this paper. Including genetics was important especially when evaluating the economic effect of (i) altered reproduction efficiency in a herd when surplus heifer were sold randomly with regard to genetic milk yield level and (ii) insemination with SS. When ignoring genetic progress, the economic effects of altered reproductive efficiency were overestimated and the economic effects of SS were underestimated.
Evaluating genetic progress on several traits in a herd-specific context where all mechanisms of fertility and replacement are incorporated has not been done before. An interesting and logical next step is to include the genetic level for functional traits. This would create the opportunity to answer more hypotheses on determining weight factors in a total net merit index.
Acknowledgements
The authors wish to thank two anonymous reviewers for their constructive criticism during the revision process. Furthermore, the authors wish to thank Anders Christian Sørensen from the Department of Genetics and Biotechnology of Aarhus University for increasing our understanding of genetic progress in dairy herds.