



Introduction
A staged Fontan operation enables 60% of patients with a single right ventricle to reach adulthood, Reference Newburger, Sleeper and Gaynor1 however, not all patients have a good prognosis. Although previous studies showed that 73% of post-Fontan operation patients with a single right ventricle maintained a normal ejection fraction, 81% had diastolic dysfunction. Reference Anderson, Sleeper and Mahony2 The right ventricle was more prone to myocardial microfibrosis and collagen deposition than the left ventricle due to preload and afterload fluctuations. Reference Friedberg and Redington3,Reference Modesti, Vanni and Bertolozzi4 This may be one reason why post-Fontan patients with a single right ventricle are more likely to have increased diastolic dysfunction than those with a single left ventricle. Reference Files and Arya5
Right ventricular dysfunction is a key determinant of prognosis Reference Altmann, Printz and Solowiejczyk6 ; in particular, diastolic dysfunction is a major problem in post-Fontan operation patients with single right ventricle. Thus, early detection of diastolic dysfunction is important but difficult for the management of patients with a single right ventricle. The geometry and myocardial structure of the right ventricle differ from that of the left ventricle. Therefore, quantitative echocardiographic evaluation of diastolic function in the left ventricle cannot be applied to a single right ventricle. Moreover, haemodynamic assessment using cardiac catheterisation is the gold standard for assessing diastolic function in patients with a single right ventricle.
Impaired relaxation is a major component of diastolic dysfunction, and time constant of isovolumic relaxation is an established index for ventricular relaxation, including that of the single ventricle Reference Chowdhury, Bultts and Buckley7 ; however, it requires invasive assessment. Although echocardiography is a central imaging modality for the routine evaluation of post-Fontan operation patients with a single right ventricle, there is no established index for assessing diastolic function. Reference Stout, Daniels and Aboulhosn8 Strain and strain rate are echocardiographic indices for measuring regional and global myocardial deformations. These can be part of a routine single right ventricular function assessment in the future; however, normal range values of these indices are lacking. Therefore, subjective echocardiographic assessments and chronological changes in individual patients rather than quantitative assessments are the current routine practice for patients with a single right ventricle.
This study aimed to investigate echocardiographic indices associated with the time constant of isovolumic relaxation, a marker of relaxation impairment in post-Fontan operation patients with a single right ventricle.
Methods
This retrospective single-centre case-control study enrolled patients with hypoplastic left heart syndrome post-Fontan operation who underwent cardiac catheterisation at our hospital between August 2009 and November 2019. As there are numerous factors (e.g., reduced systolic function, tricuspid valve regurgitation, neo-aortic valve regurgitation, and presence of fenestration) that affect hemodynamic data in patients with hypoplastic left heart syndrome post-Fontan operation, determining differences in diastolic function is difficult. Although systolic and diastolic functions are closely related, ejection fraction can be influenced by preload and afterload and could be overestimated by the presence of significant tricuspid and aortic valve regurgitation. Therefore, only patients with homogeneous hemodynamic backgrounds were included in this study. The exclusion criteria were as follows: (i) decreased systolic function (right ventricular ejection fraction <45%) calculated by ventriculography, (ii) more than moderate tricuspid valve regurgitation, (iii) more than mild neo-aortic valve regurgitation, (iv) residual fenestration, or (v) significant aortopulmonary collateral arteries. Thus, only patients with preserved systolic function and no significant tricuspid valve regurgitation, aortic valve regurgitation, or aortopulmonary collateral arteries were included.
Informed consent was obtained via opt-out on the website. The study was approved by the Institutional Review Board of Shizuoka Children’s Hospital (R2-83).
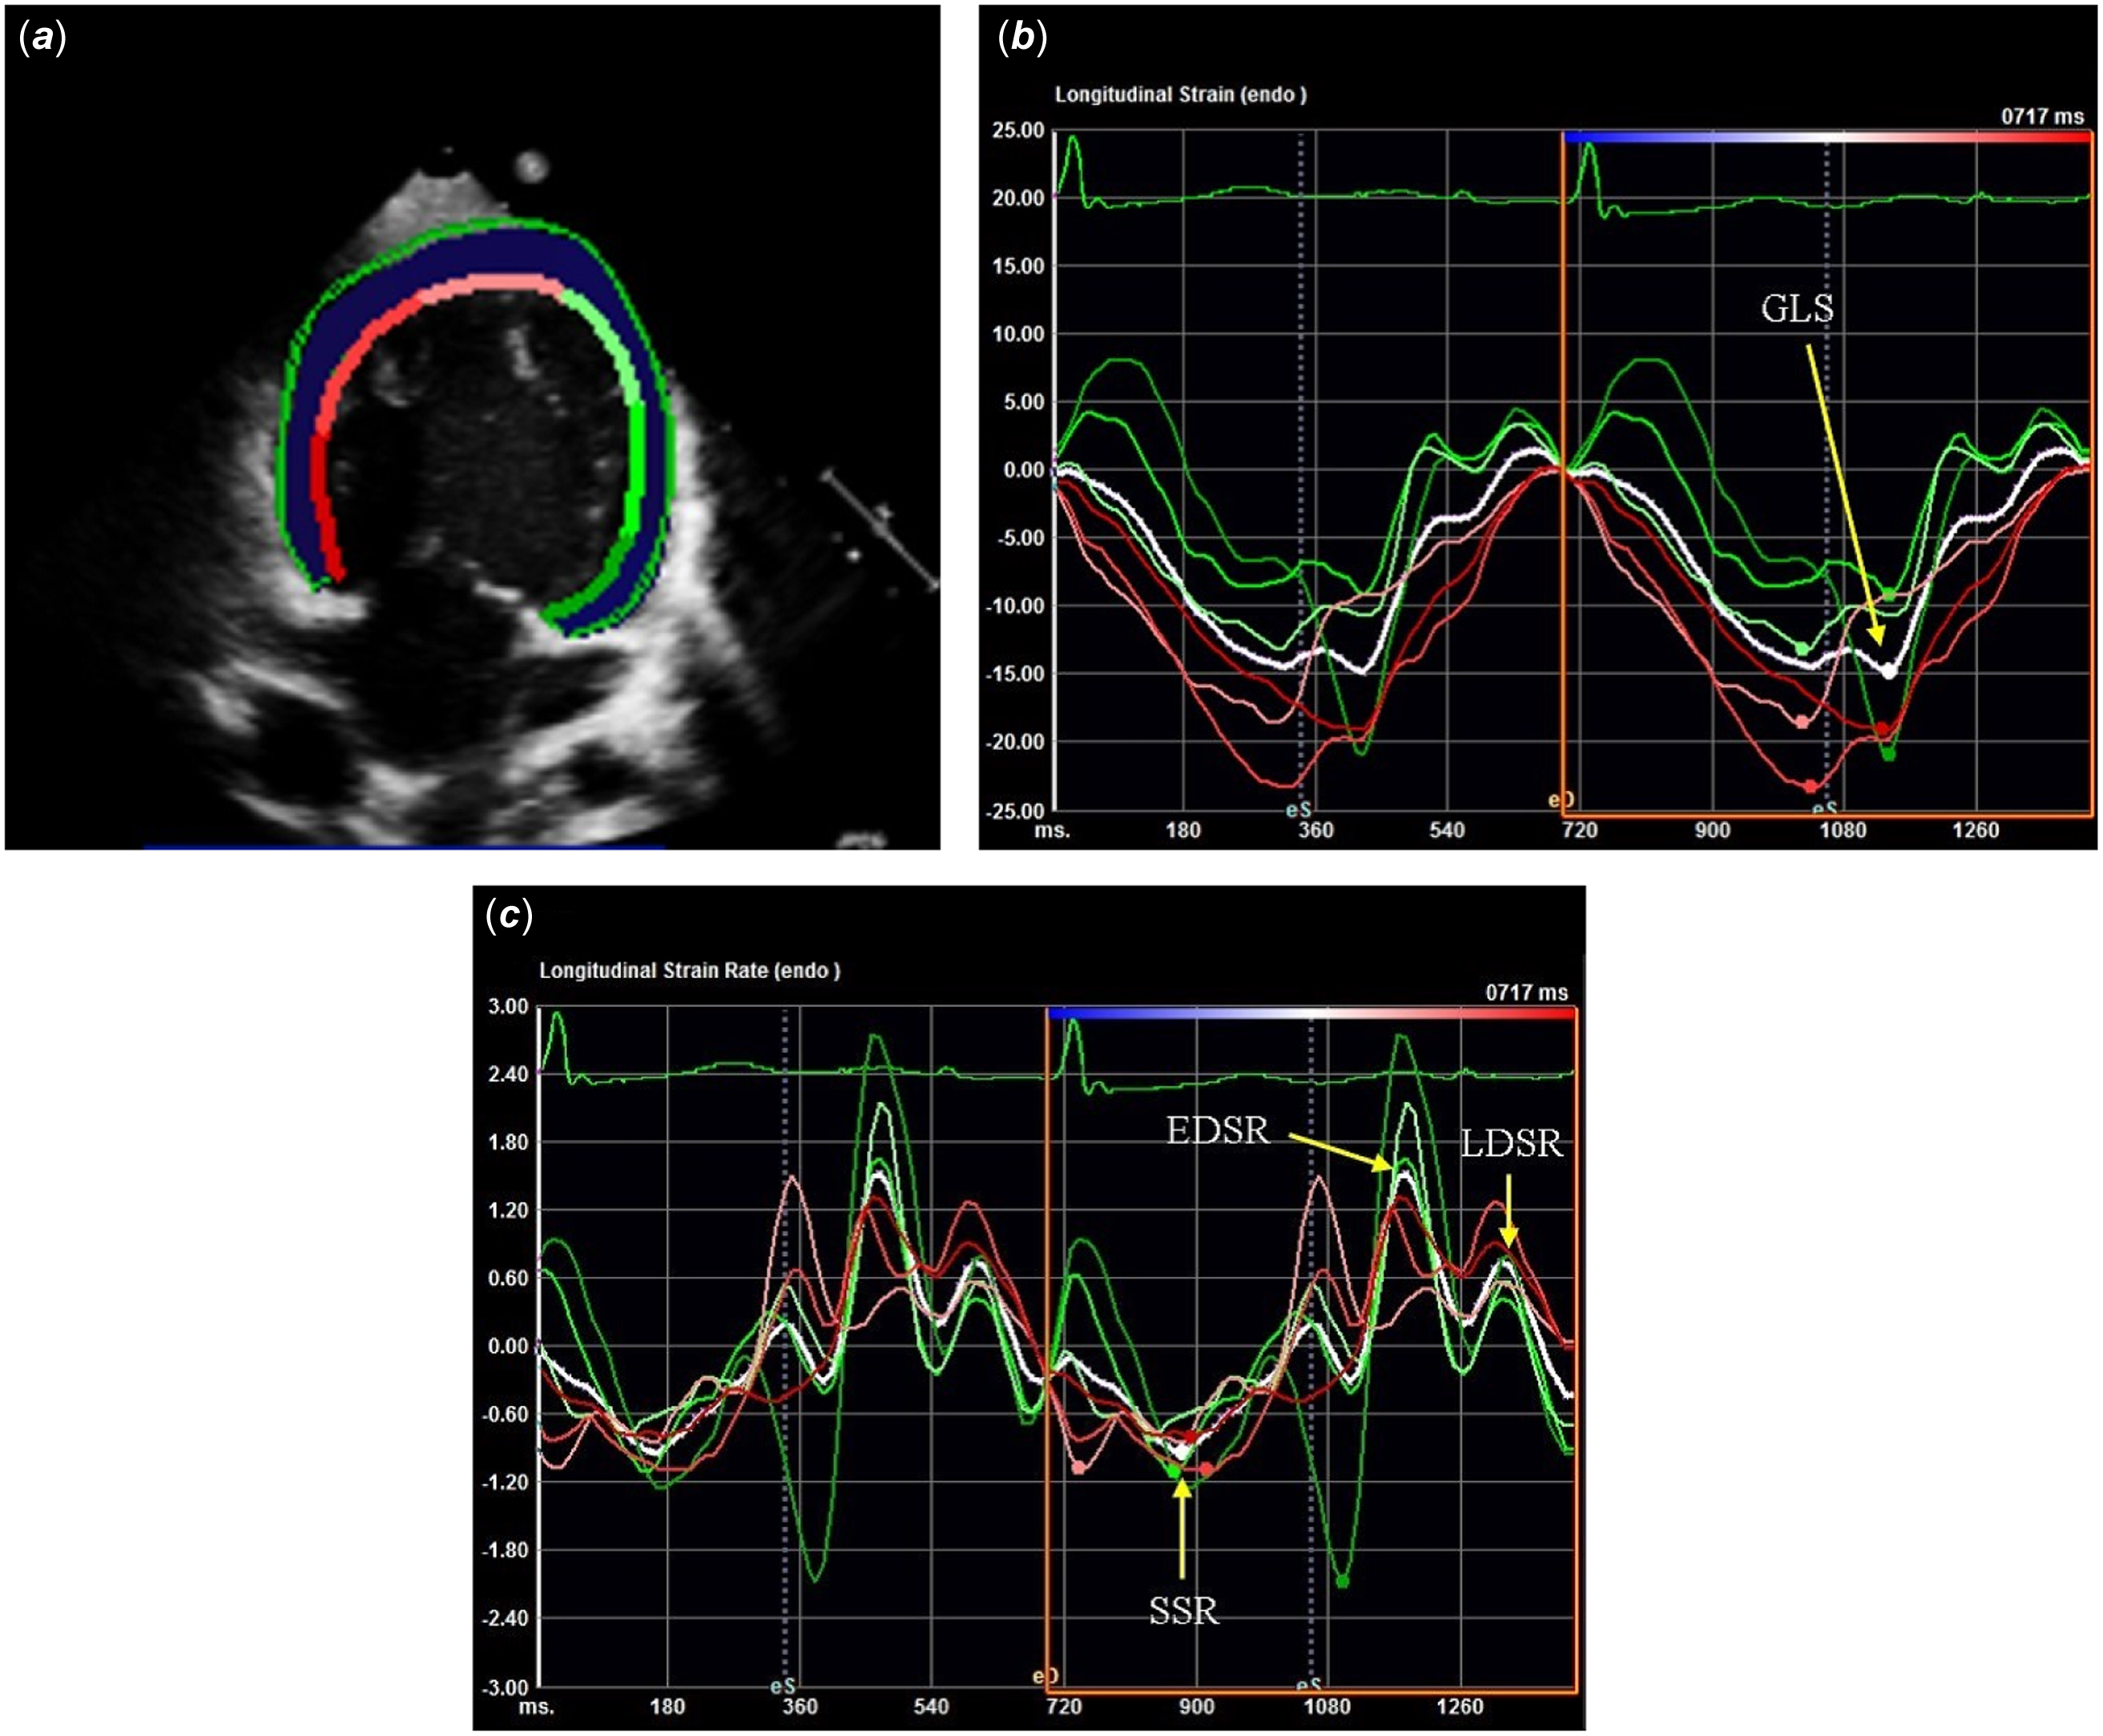
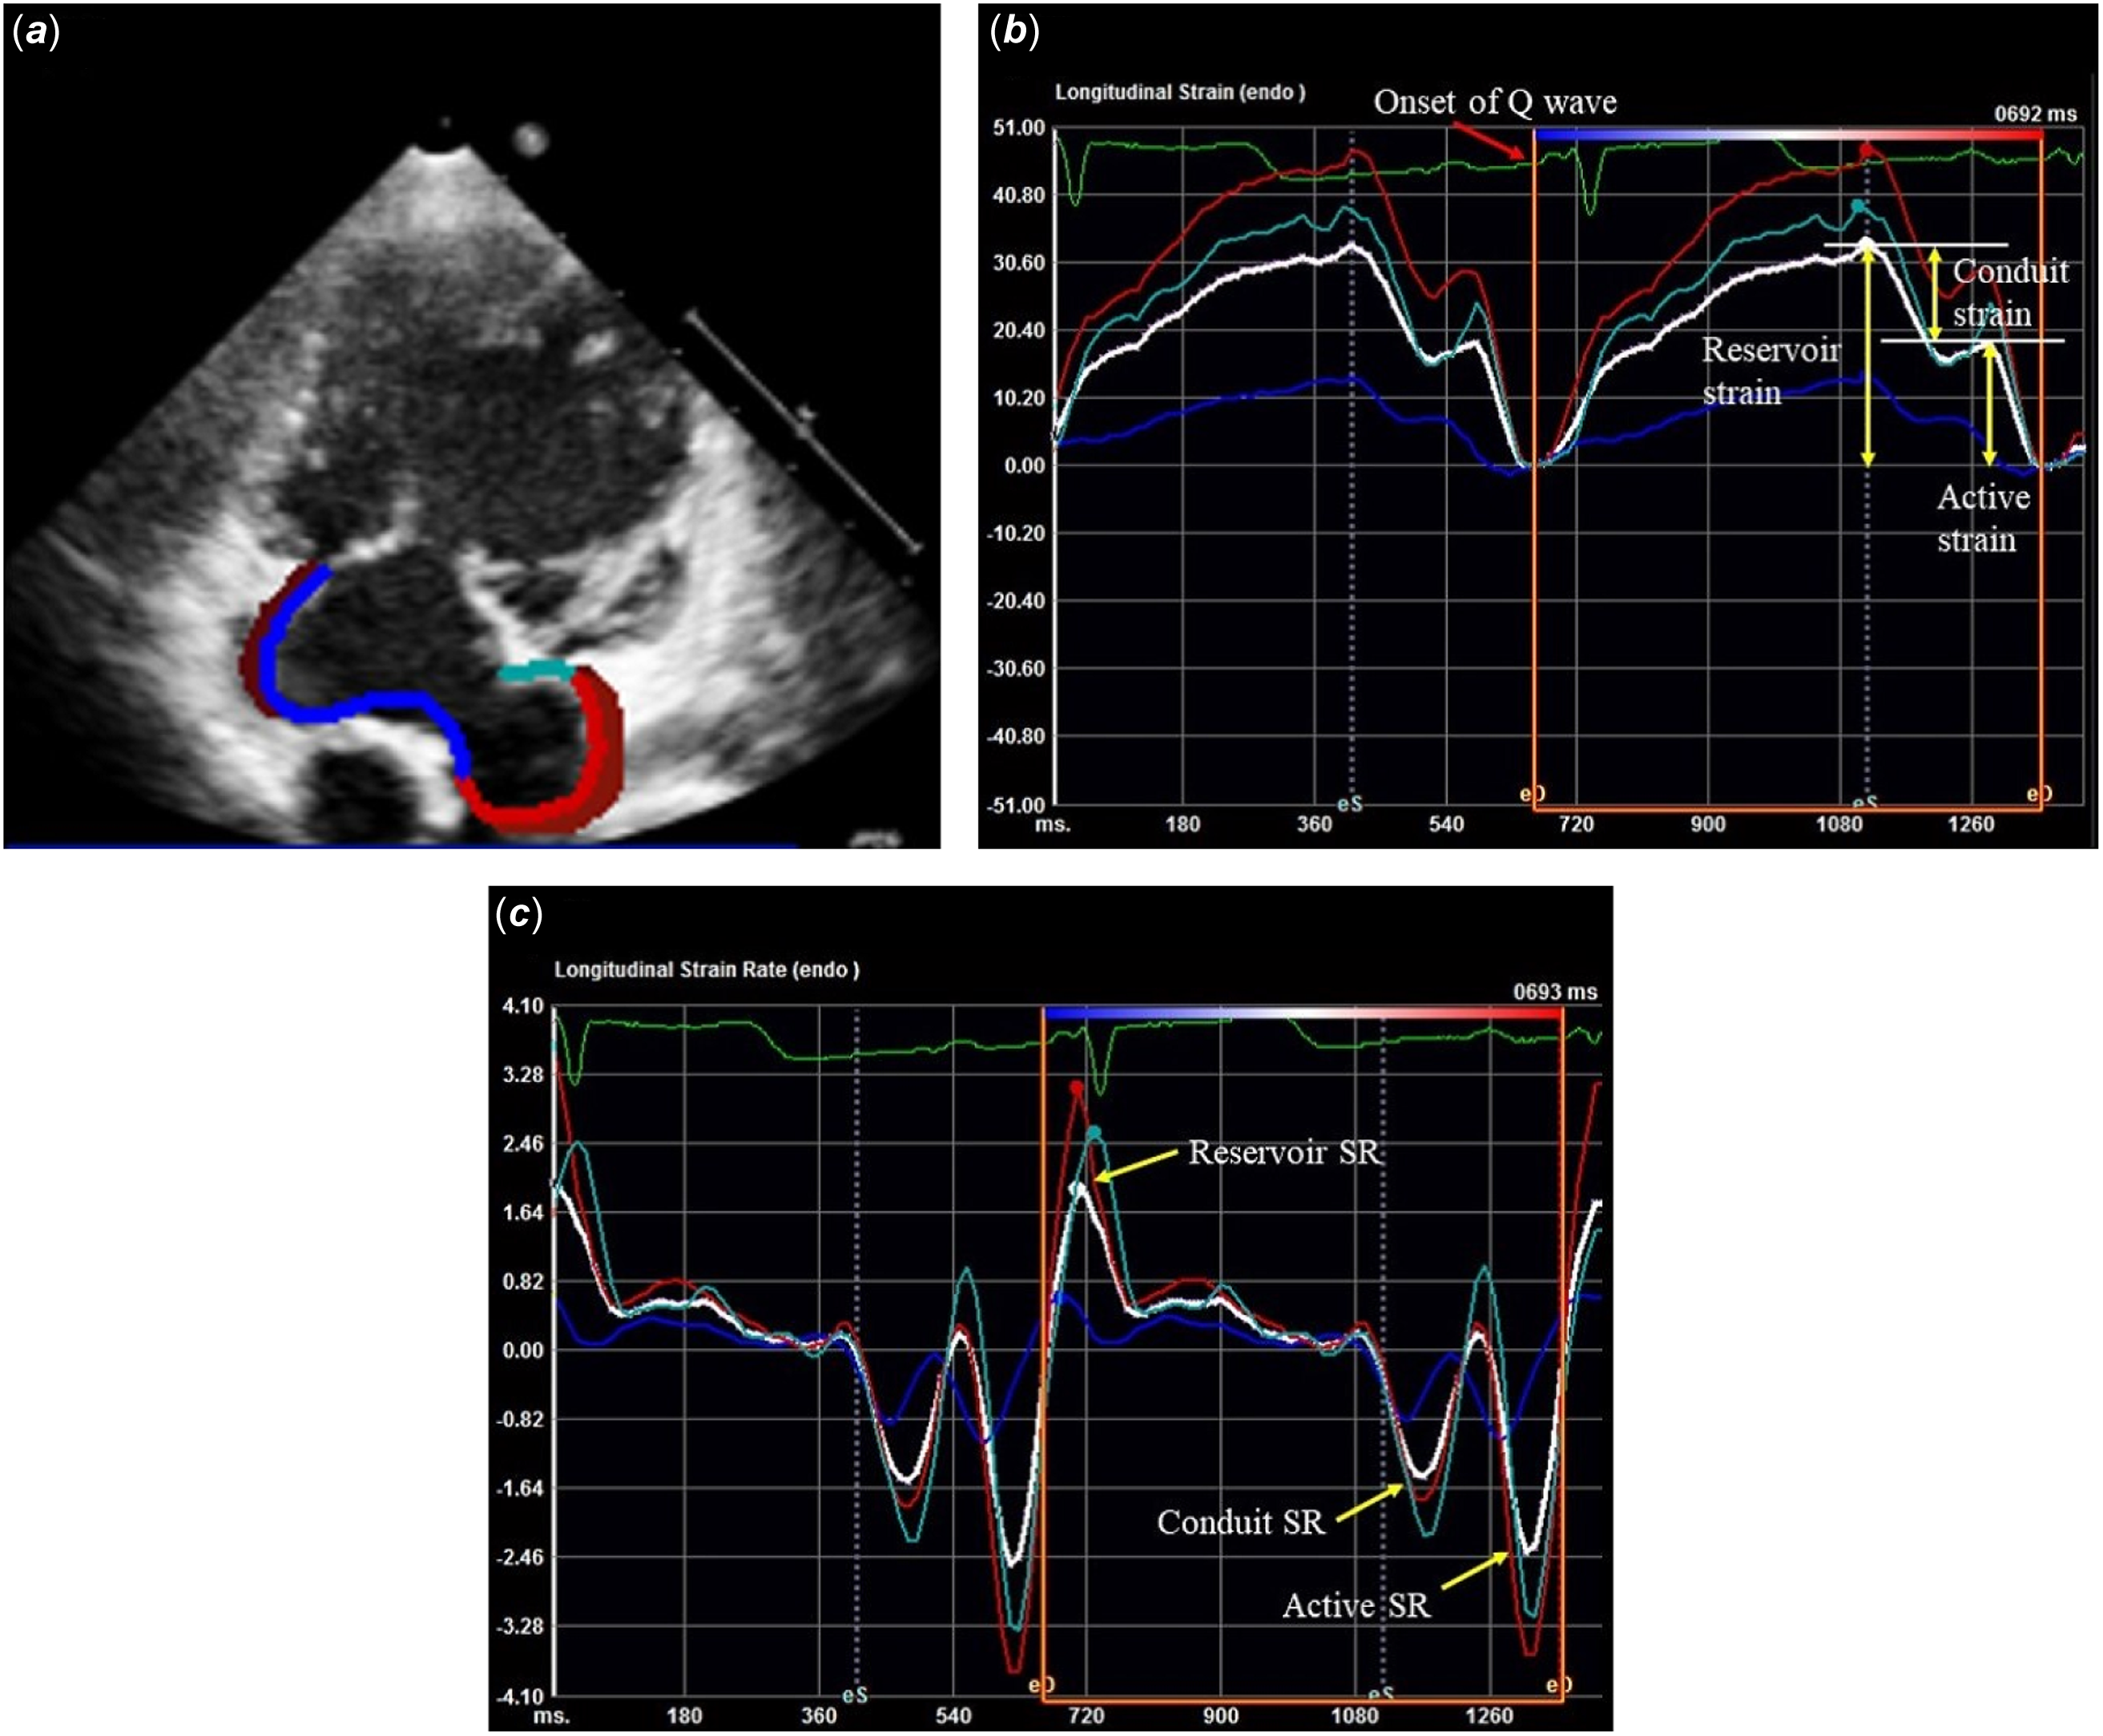
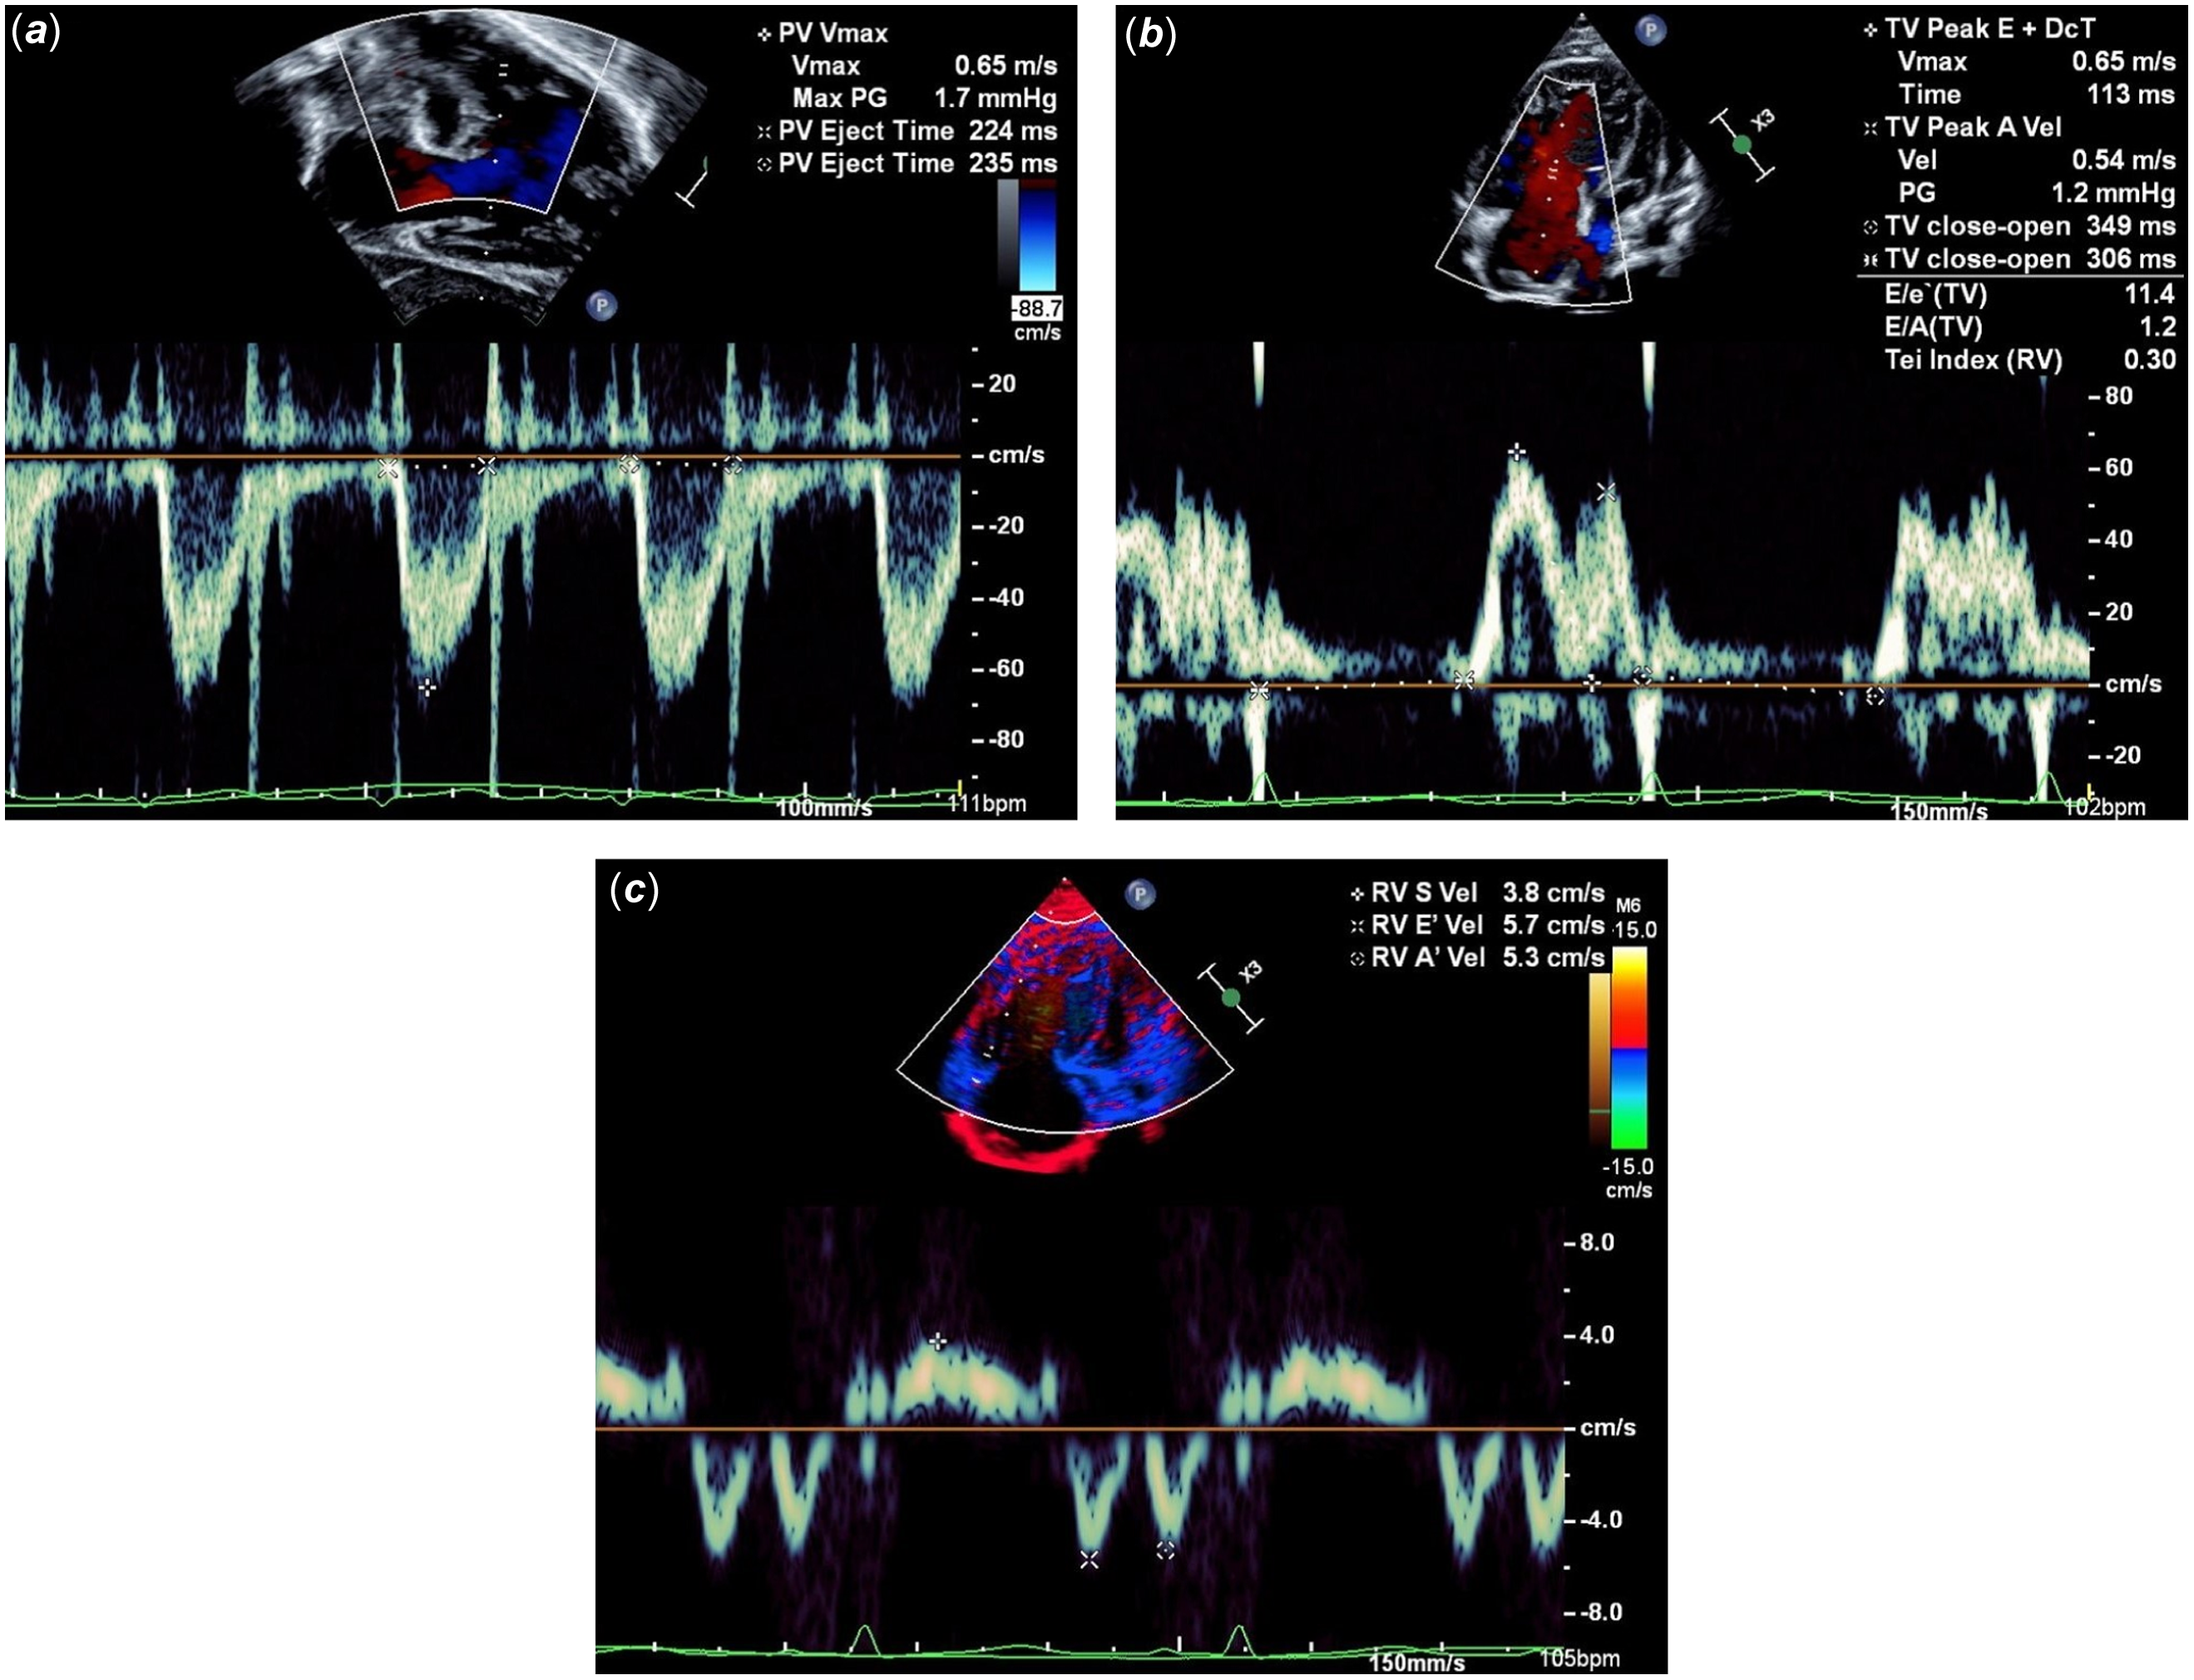
Patient baseline characteristics, including age, sex, body weight, body height, body surface area, duration of Fontan circulation, hypoplastic left heart syndrome subtype, protein-losing enteropathy, medications, haemoglobin, serum creatinine, and brain natriuretic peptide were collected from medical records within 5 days before cardiac catheterisation. Echocardiographic data were collected from medical records within 6 months before cardiac catheterisation. Echocardiographic studies were performed using Philips Epiq 7 (Philips Medical Systems, Andover, MA, USA) or Siemens ACUSON SC2000 (Siemens Medical Solutions, Mountain View, CA, USA). We collected echocardiographic data on the global longitudinal strain and strain rate of single right ventricle and atrium, measured using two-dimensional speckle tracking on the apical four-chamber view (Figure 1 a ). An average of global longitudinal strain and strain rate analyses were measured offline using two-dimensional cardiac performance analysis (TOMTEC, Munich, Germany). A single right ventricular endocardial border was manually traced. A region of interest comprising six segments dividing a single right ventricle was automatically calculated using the software and manually corrected as required (Figure 1 b ). In patients with hypoplastic left heart syndrome, most of the right ventricular systolic function is contributed by the free wall because the septal wall is often akinetic or hypokinetic. However, even in patients with preserved right ventricular free wall strain, reduced septal wall strain has been reported to be associated with poor clinical outcomes. Reference Forsha, Joseph, Kutty and Friedberg9 Therefore, in this study, global longitudinal strain was used as a measure of right ventricular function, without distinguishing between septal and free wall strain. Segments in which the myocardium was insufficiently visualised were excluded. The global longitudinal systolic strain rate, global longitudinal early diastolic strain rate, and global longitudinal late diastolic strain rate were obtained using the average value of six right ventricular segments (Figure 1 c ). The endocardium of the atrium traced from the atrioventricular junction on the free wall side to the ventricular septum side, atrial appendage, and Fontan conduit were excluded (Figure 2 a ). For the global strain of the atrium, the maximum positive strain (reservoir strain) was used as an indicator of reservoir function starting from the onset of the Q wave in the synchronised electrocardiogram. The second positive strain (active strain) was used as an indicator of booster function, whereas the difference between the reservoir strain and active strain (conduit strain) was used as an indicator of conduit function (Figure 2 b ). In the strain rate curve, we used the positive peak strain rate (reservoir strain rate) after the onset of the Q wave as an index of the reservoir function. Here, the first negative peak strain rate (conduit strain rate) represents the conduit function, and the second negative peak strain rate (active strain rate) represents atrial contractility (Figure 2 c ). The right ventricular fractional area change was measured using an apical four-chamber view. The early to late diastolic velocity ratio, deceleration time, and Tei index were measured using pulse Doppler (Figure 3 a , b ). The ventricular systolic to diastolic duration ratio, isovolumic relaxation time, and systolic, early diastolic, and late diastolic myocardial velocities were obtained on the free wall of a single right ventricle by tissue Doppler (Figure 3 c ).
(a) Longitudinal strain measurements in single right ventricle patients after Fontan procedure: tracing the right ventricular endocardium by two-dimensional speckle tracking. (b) Right ventricular strain (y-axis)–time (x-axis) curve. Colour-coded lines represent segmental strains, and the white line represents average strain. (c) Right ventricular strain rate (y-axis)–time (x-axis) curve. EDSR = global longitudinal early diastolic strain rate; GLS = global longitudinal strain; LDSR = global longitudinal late diastolic strain rate; SSR = global longitudinal systolic strain rate.
(a) Atrial strain measurements in single right ventricle patients after Fontan procedure: tracing of the endocardium of common atrial by two-dimensional speckle tracking. (b) Atrial global longitudinal strain (y-axis)–time (x-axis) curve: the white curve is representative of the average global longitudinal strain. The reservoir strain was measured as the maximum positive strain, the active strain was measured at the second positive strain, and the difference between reservoir and active strain defined conduit strain. (c) Atrial global longitudinal strain rate (y-axis)–time (x-axis) curve: the reservoir SR was measured as the peak SR, the conduit SR as the first negative peak SR, and the active SR as the second negative SR. SR = strain rate.
(a) Measurement of right ventricular ejection time was taken at the neo-aortic valve. (b) Measurement of E/A ratio, deceleration time, and right ventricular Tei index by pulse Doppler. E/E’ was calculated from the E wave by pulse Doppler and the E’ wave by tissue Doppler. Tei index was calculated from right ventricular ejection time and tricuspid valve close to open time by pulse Doppler. (c) Measurement of S’, E’, and A’ on the free wall of the single right ventricle by tissue Doppler. A’ = late diastolic myocardial velocity; E = early diastolic velocity; E’ = early diastolic myocardial velocity; E/A = early to late diastolic velocities ratio; E/E’ = early diastolic velocity to early diastolic myocardial velocity ratio.
Cardiac catheterisation was performed using fluid-filled catheters when the patient’s general condition remained stable, regardless of general anaesthesia. Cardiac catheterisation data were collected, including the cardiac index, right ventricular end-diastolic pressure, arterial oxygen saturation, mixed venous oxygen saturation, right ventricular systolic pressure, central venous pressure, pulmonary capillary wedge pressure, right ventricular end-diastolic volume, right ventricular end-systolic volume, right ventricular ejection fraction, pulmonary vascular resistance, systemic vascular resistance, time constant of isovolumic relaxation, peak positive rate of pressure, and peak negative rate of pressure. The inflection points immediately before the pressure surge associated with contraction at end expiration were used as a protocol to standardise the measurement of right ventricular end-diastolic pressure. When this was unknown, the pressure at the apex or lowest point of the QRS of the simultaneously recorded electrocardiogram was used. Because there can often be a time lag between electrical activity and pressure changes, we focused on the pressure waveform than on the electrocardiogram. The protocol to standardise the measurement of the time constant of isovolumic relaxation was calculated using a semilogarithmic model with true exponential decay starting at the peak negative rate of pressure increase and ending at 5 mmHg above the right ventricular end-diastolic pressure. Reference Weiss, Frederiksen and Weisfeldt10
Continuous variables are presented as mean ± standard deviation. Categorical variables were presented as frequencies and percentages. Pearson’s correlation coefficient was used to determine the relationship between the time constant of isovolumic relaxation or right ventricular end-diastolic pressure and the echocardiographic parameters. A partial correlation analysis was performed using age and heart rate as covariates. Univariate regression analysis and forward and backward stepwise multivariate linear regression analyses were performed to identify the echocardiographic predictors of the time constant of isovolumic relaxation. The selection of a priori variables was based on previous literature and included age and heart rate. Variables with p values <0.10 in univariate analysis were included in subsequent multivariate models. As patients with systolic dysfunction or significant tricuspid valve regurgitation were more likely to have diastolic dysfunction and Fontan failure, echocardiographic indices associated with the time constant of isovolumic relaxation were also evaluated in the exclusion group and compared between the inclusion and exclusion groups. Intra- and inter-observer variability of two-dimensional speckle tracking parameters was assessed using the intraclass correlation coefficient with a random-effects model. Ten patients were randomly selected, and intra-observer variability was measured repeatedly after 4 weeks by one observer. Inter-observer variability was also assessed by a second observer who was blinded to the first observer’s results. Intra- or inter-observer variability was considered acceptable if the intraclass correlation coefficient was greater than 0.80.
Statistical significance was set at p value <0.05. All statistical analyses were performed using EZR version 1.51 (Saitama Medical Center, Jichi Medical University, Saitama, Japan).
Results
A total of 112 post-Fontan operation patients with hypoplastic left heart syndrome underwent cardiac catheterisation at our hospital between 2009 and 2019. Based on the exclusion criteria, 39 patients were included in this study. The patient characteristics are summarised in Table 1. Mean age was 7.8 ± 4.3 years, and body surface area was 0.85 ± 0.34 m2. Mitral atresia/aortic atresia was the most common type, accounting for 46% of patients. The echocardiographic data are summarised in Table 2A. Right ventricular fractional area change was 44.3 ± 7.1%, and global longitudinal strain was -18.6 ± 4.1%. Cardiac catheterisation data are summarised in Table 2 B. Right ventricular end-diastolic pressure was 6.3 ± 1.9 mmHg, right ventricular ejection fraction was 54.7 ± 5.1%, and the time constant of isovolumic relaxation was 25.0 ± 9.3 msec. Pearson’s correlation coefficients for the echocardiographic parameters and the time constant of isovolumic relaxation are shown in Table 3A. Global longitudinal strain most strongly correlated with the time constant of isovolumic relaxation (r = 0.778, p < 0.001) and right ventricular end-diastolic pressure (r = 0.351, p = 0.029). Because the time constant of isovolumic relaxation and right ventricular end-diastolic pressure were significantly correlated with age and heart rate, partial correlation coefficients between the time constant of isovolumic relaxation or right ventricular end-diastolic pressure and echocardiographic parameters were evaluated after setting age and heart rate as covariates. The partial correlation matrices are listed in Table 3B. The results showed that global longitudinal strain was strongly correlated with the time constant of isovolumic relaxation (r = 0.707, p < 0.001). However, there was no significant correlation between right ventricular end-diastolic pressure and echocardiographic parameters. Univariate and multivariate regression analyses are presented in Table 4. In the stepwise multivariate regression analysis, only the global longitudinal strain was an independent predictor of the time constant of isovolumic relaxation (adjusted R 2 = 0.551). Of the 73 patients who met the exclusion criteria, 33 had systolic dysfunction or more than moderate tricuspid valve regurgitation, and two-dimensional speckle tracking was available for analysis. A comparison of the time constant of isovolumic relaxation and global longitudinal strain between these 33 patients and the 39 patients in the included group showed a significantly higher time constant of isovolumic relaxation and significantly lower global longitudinal strain in the 33 patients in the excluded group (Table 5). The intraclass correlation coefficient for the two-dimensional speckle tracking parameters was greater than 0.80 in the analysis of intra- and inter-observer variability.
Patient characteristic data

Data are n (%), mean ± SD.
AA = aortic atresia; ACE = angiotensin converting enzyme; ARB = angiotensin II receptor blocker; AS = aortic stenosis; BNP = brain natriuretic peptide; Hb = hacoefficient emoglobin; HLHS = hypoplastic left heart syndrome; MA = mitral atresia; MS = mitral stenosis; PLE = protein-losing enteropathy; SCr = serum creatinine.
A. Echocardiographic data and B. Cardiac catheterisation data

Data is mean ± SD.
CI = cardiac index; CVP = central venous pressure; DT = deceleration time; dP/dt = rate of pressure rise; E/A = early to late diastolic velocity ratio; EDSR = global longitudinal early diastolic strain rate; E/E’ = early diastolic velocity to early diastolic myocardial velocity ratio; FAC = fractional area change; GLS = global longitudinal strain; IVRT = isovolumetric relaxation time; LDSR = global longitudinal late diastolic strain rate; PCWP = pulmonary capillary wedge pressure; Rp = pulmonary vascular resistance; Rs = systemic vascular resistance; RV = right ventricle; RVEDP = right ventricular end-diastolic pressure; RVEDV = right ventricular end-diastolic volume; RVEF = right ventricular ejection fraction; RVSP = right ventricular systolic pressure; S/D = ventricular systolic to diastolic duration ratio; SR = strain rate; SSR = global longitudinal systolic strain rate; Tau = time constant of isovolumic relaxation.
(a) Pearson’s correlation coefficient and (b) Partial correlation matrix with age and HR as covariates between tau or EDP and echocardiographic parameters

DT = deceleration time; E/A = early to late diastolic velocity ratio; E/E’ = early diastolic velocity to early diastolic myocardial velocity ratio; EDSR = global longitudinal early diastolic strain rate; FAC = fractional area change; GLS = global longitudinal strain; HR = heart rate; IVRT = isovolumetric relaxation time; LDSR = global longitudinal late diastolic strain rate; RV = right ventricle; S/D = ventricular systolic to diastolic duration ratio; SR = strain rate; SSR = global longitudinal systolic strain rate.
Univariate and multivariate regression analysis to predict tau
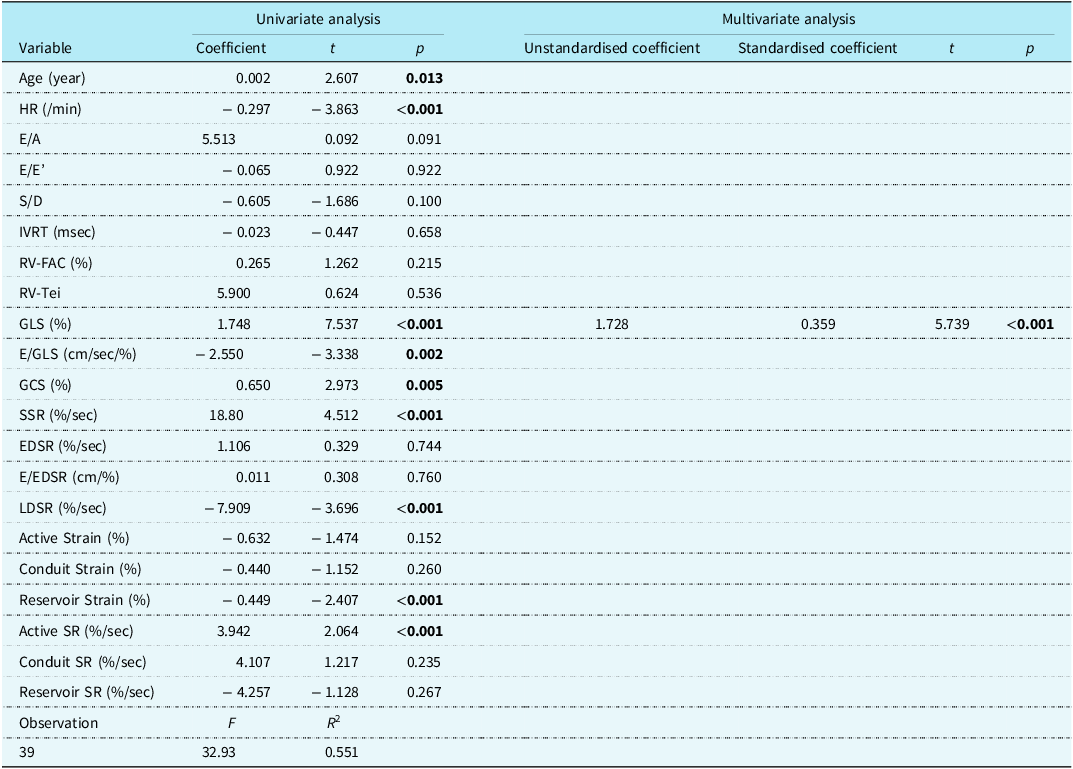
E/A = early to late diastolic velocity ratio; E/E’ = early diastolic velocity to early diastolic myocardial velocity ratio; EDSR = global longitudinal early diastolic strain rate; FAC = fractional area change; GLS = global longitudinal strain; IVRT = isovolumetric relaxation time; LDSR = global longitudinal late diastolic strain rate; RV = right ventricle; S/D = ventricular systolic to diastolic duration ratio; SR = strain rate; SSR = global longitudinal systolic strain rate; Tau = time constant of isovolumic relaxation.
Comparison of RVEF, GLS, and tau with excluded and included groups

Data is mean ± SD.
GLS = global longitudinal strain; RVEF = right ventricular ejection fraction; Tau = time constant of isovolumic relaxation.
Discussion
This study investigated the echocardiographic indices associated with the time constant of isovolumic relaxation, a marker of relaxation impairment in post-Fontan operation patients with a single right ventricle. The results are summarised as follows: (i) Global longitudinal strain was most strongly correlated with the time constant of isovolumic relaxation compared with other echocardiographic indices, even after excluding age and heart rate, and (ii) multivariate analysis showed that only global longitudinal strain was independently and significantly associated with the time constant of isovolumic relaxation.
Ventricular relaxation is a major component of the ventricular diastolic function. In diastolic dysfunction, impaired relaxation usually precedes impaired stiffness and leads to heart failure despite a preserved ejection fraction. Therefore, diagnosing relaxation impairment is important for the early recognition and management of diastolic dysfunction. Ventricular relaxation is mainly due to “elastic recoil” (which stores energy during systolic phase and releases it during relaxation) and “active relaxation” (which depends on calcium ion reacquisition from the cytosol by the endoplasmic reticulum driven by calcium adenosine triphosphatase). Reference Hayabuchi, Ono, Homma and Kagami11,Reference Erenberg and Banerjee12 Impaired relaxation can be assessed by the time constant of isovolumic relaxation measured via cardiac catheterisation. A recent retrospective cohort study reported that the time constant of isovolumic relaxation was prolonged in patients with a single ventricle and diastolic dysfunction Reference Goudar, Zak and Atz13 and correlated with early post-Fontan operation prognosis. Reference Border, Syed and Michelfelder14
Global longitudinal strain is a quantitative echocardiographic index used to assess longitudinal ventricular contractions. Normally, load-dependent myocardial fibrosis occurs predominantly on the endocardial side. Because the endocardium runs in the longitudinal direction, ventricular longitudinal function is impaired before circumferential function. Ventricular longitudinal contraction is largely responsible for maintaining elastic recoil, and left ventricular global longitudinal strain correlates with the time constant of isovolumic relaxation in patients with heart failure with preserved ejection fraction and normal structural heart. Reference Ito, Ishida and Makino15 In patients with hypoplastic left heart syndrome and preserved right ventricular ejection fraction, the global longitudinal strain/global circumferential strain ratio decreases post-Fontan operation, and the contraction pattern changes from longitudinal to circumferential dominance. Reference D’Souza, Wang and Calderon-Anyosa16 Another study reported that a decrease in global longitudinal strain preceded a decrease in right ventricular ejection fraction, suggesting that circumferential function compensates for longitudinal dysfunction. Reference Kanngiesser, Freitag-Wolf and Boroni Grazioli17 In post-Fontan operation patients with hypoplastic left heart syndrome, ventricular longitudinal dysfunction may also lead to impaired relaxation via elastic recoil. In this study, the global longitudinal strain was independently and strongly associated with the time constant of isovolumic relaxation, which may be a useful indicator for the early detection of relaxation impairment in patients with hypoplastic left heart syndrome and preserved ejection fraction.
The time constant of isovolumic relaxation was significantly higher in the excluded group, and global longitudinal strain was also significantly lower in this study. A higher time constant of isovolumic relaxation suggested that the excluded group had more diastolic dysfunction. However, the global longitudinal strain is an index associated with systolic function, and the lower global longitudinal strain in the excluded group may have been influenced by systolic dysfunction. Therefore, it is possible that global longitudinal strain can be used as an index of diastolic dysfunction, even in a group of patients with systolic dysfunction or more than moderate tricuspid valve regurgitation; however, its validation is a subject for future studies.
This study also investigated the association between echocardiographic indices and right ventricular end-diastolic pressure, which has often been used in previous studies as a marker of diastolic dysfunction. The results showed that global longitudinal strain was significantly correlated with right ventricular end-diastolic pressure; however, its correlation coefficient was lower than that of the time constant of isovolumic relaxation. Furthermore, partial correlation analysis showed that global longitudinal strain did not significantly correlate with right ventricular end-diastolic pressure. Right ventricular end-diastolic pressure is mainly associated with stiffness impairment and increases in late-stage diastolic dysfunction; hence, it is considered a less sensitive marker for the early detection of diastolic dysfunction. Additionally, right ventricular pressure is more strongly influenced by preload than the time constant of isovolumic relaxation. Although there are reports of potential diastolic dysfunction based on the degree of right ventricular end-diastolic pressure elevation by abdominal compression or rapid volume loading during cardiac catheterisation, Reference Kuwata, Saiki and Takanashi18,Reference Averin, Hirsch and Seckeler19 it is difficult to perform similar loading during outpatient follow-up echocardiography.
Moreover, the early diastolic velocity to early diastolic myocardial velocity ratio, isovolumic relaxation time, ventricular systolic to diastolic duration ratio, and global longitudinal early diastolic strain rate, which have been reported as echocardiographic indices of diastolic dysfunction in previous studies, Reference Chowdhury, Bultts and Buckley7,Reference Goudar, Zak and Atz13,Reference Khoo, Smallhorn and Kaneko20 showed weak or no correlation with the time constant of isovolumic relaxation in the present study. Moreover, no association with the time constant of isovolumic relaxation was found in the multivariate analysis. All the patients in this study had a right ventricular end-diastolic pressure ≤ 10 mmHg, which was lower than the population with diastolic impairment in the previous studies. Reference Husain, Gokhale and Nicholson21,Reference Cua, Moore-Clingenpeel and Husain22 This suggests that these indices may be less sensitive in detecting early relaxation impairment in diastolic dysfunction.
Study limitations
This study has several limitations. First, echocardiography and cardiac catheterisation were performed on different days, which may have affected our results. Second, a hydraulic catheter was used to measure the right ventricular end-diastolic pressure and the time constant of isovolumic relaxation. Micromanometers measure right ventricular end-diastolic pressure more accurately but are rarely used in clinical practice. Third, ventricular compliance requires recording the pressure–volume loop and assessing the end-diastolic pressure–volume relationship under multiple loading conditions, which were not performed in this study. Fourth, the sample size was too small to determine the cut-off value of global longitudinal strain to detect diastolic dysfunction.
Conclusions
This study showed that global longitudinal strain may be used as a surrogate marker of time constant of isovolumic relaxation, an invasive index of relaxation impairment, in post-Fontan operation patients with a single right ventricle, preserved ejection fraction, and no more than moderate tricuspid valve regurgitation. This study suggests that global longitudinal strain may be useful for diagnosing relaxation impairment in patients with a single right ventricle, which is difficult to detect early using conventional echocardiographic indices. However, the sample size of this study is not large enough to derive generalised conclusions, and it remains to be determined whether global longitudinal strain is equally useful in patients with reduced ejection fraction or more than moderate tricuspid valve regurgitation, so further validation is needed.
Acknowledgements
We greatly appreciate Dr Chisato Miyakoshi of Kobe City Medical Center General Hospital for his helpful advice on the statistical methods. We would also like to thank Editage (www.editage.com) for the English language editing.
Financial support
This research received no specific grant from any funding agency, commercial sector, or not-for-profit sector.
Competing interests
None.
Ethical standards
The authors assert that all procedures contributing to this work complied with the ethical guidelines for medical and health research involving human subjects and with the Declaration of Helsinki of 1975 (as revised in 2008). This study was approved by the Institutional Review Board of Shizuoka Children’s Hospital (R2-83).



