INTRODUCTION
Studies involving protein nutrition of goats in different physiological states under tropical conditions are scarce, with most of the data found in the literature coming from experiments conducted in temperate climates. Thus, more research should be conducted under tropical conditions. The supply of amino acids from microbial protein is essential for protein metabolism in ruminants, since a large proportion of the amino acids absorbed in the small intestine derives from microbial protein.
The amount of microbial protein that has to pass through the small intestine is determined by the efficiency and flow of microbial mass produced (Pessoa et al. Reference Pessoa, Leão, Ferreira, Valadares Filho, Valadares and Queiroz2009). The microbial growth rate depends on the substrate available for fermentation in the rumen, substrate composition and degradation rate, as well as factors inherent to the rumen environment (Ribeiro et al. Reference Ribeiro, Garcia, Pereira, Valadares Filho and Cecon2001). The microbial flow depends on the relationship between particle size, volume and rate of passage through the rumen. Assessing the protein metabolism of ruminants by monitoring the nitrogen (N) balance, urea concentration in the plasma and its excretion in the urine when protein foods are offered provides information that can be used to avoid losses caused by the supply of excessive protein or inappropriate synchrony in the use of energy and protein.
Soybean meal is a highly digestible protein source with a high nutritional value, whose rate of escape of amino acid N to the intestine is approximately 0·25 (Valadares Filho et al. Reference Valadares Filho, Machado, Chizzotti, Amaral, Magalhães, Rocha Junior and Capelle2010). Alfalfa hay can be used as a component of the concentrate given its higher proportion of cell content at the expense of cell wall components, compared to grasses, representing approximately 0·70 of protein degraded in the rumen.
The objective of the current experiment was to evaluate the effects of crude protein (CP) levels (100; 130; 160 and 190 g/kg of dry matter (DM)) in diets consisting of 200 g Tifton 85 hay/kg and pelleted concentrate obtained from the replacement of the alfalfa hay by soybean meal on the N balance, urea excretion and microbial protein synthesis in lactating goats.
MATERIALS AND METHODS
Location
The experiment was conducted in the goat farming sector of the State University of Southwest Bahia (UESB), campus Vitória da Conquista, located in the Southwest region of the State of Bahia, Brazil (14°53′S, 40°48′W, 870 m a.s.l.).
The average annual rainfall is 733·9 mm. During the months of the experiment, the average minimum and maximum temperatures were 9·7 and 31·3 °C, respectively.
Experimental material and procedures
The experimental procedures of this study were approved by the ethics commission of UESB, Itapetinga campus, protocol 124–2015.
Eight Saanen goats were used in the experiment, with body condition score of 2 (based on a scale of 0–5 points, where 0 = very thin and 5 = very fat), at 58 ± 7·4 days in lactation, producing 2 ± 0·2 kg of milk daily.
After being identified and treated for endoparasites, the goats were taken to individual pens (1·32 × 3·10 m2). At the beginning of the confinement period, their body weight (BW) was 43 ± 1·4 kg and the animals were weighed after each experimental period.
The goats were distributed into two 4 × 4 balanced Latin squares, composed of four 20-day periods; the first 15 days were used to acclimatize them to the diet and the subsequent 5 days were used for data collection. Four diets, containing 100, 130, 160 or 190 g CP/kg DM, were evaluated. In these diets, the replacement of alfalfa hay with soybean meal in the concentrate provided an increase in the concentration of CP. The concentrate was used in pelletized form, at quantities of 800 g/kg in diets containing 200 g/kg of shredded Tifton 85 hay (chopped to 5–8 cm). The diets were balanced according to the NRC (2007).
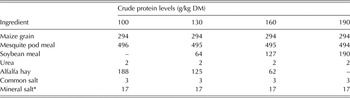
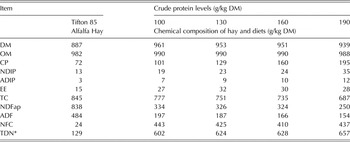
Tables 1 and 2 present the proportions of ingredients of concentrate diets and average DM, organic matter (OM), CP, neutral detergent insoluble protein (NDIP), acid detergent insoluble protein (ADIP), ether extract (EE), total carbohydrates (TC), neutral detergent fibre free of ash and protein (NDFap), acid detergent fibre (ADF), non-fibrous carbohydrate (NFC) and total digestible nutrients (TDN) contents of the Tifton 85 hay and experimental diets.
Composition of ingredients in the concentrate

DM, dry matter.
* Mineral salt composition: 24 g Ca/kg, 7·1 g P/kg, 2 g Mg/kg, 0·003 g Co/kg, 0·04 g Cu/kg, 0·004 g I/kg, 0·135 g Mn/kg, 2 g S/kg, 0·17 g Zn/kg.
Chemical composition and average dry matter (DM), organic matter (OM), crude protein (CP), neutral detergent insoluble protein (NDIP), acid detergent insoluble protein (ADIP), ether extract (EE), total carbohydrates (TC), neutral detergent fibre free of ash and protein (NDFap), acid detergent fibre (ADF) and non-fibrous carbohydrates (NFC) and total digestible nutrients (TDN) contents of the Tifton 85 grass hay and experimental diets

* Estimated according to National Research Council (2001).
The diets were supplied ad libitum daily at 07·30 and 15·00 h, in order to allow a leftover feed of approximately 0·10 of the total supplied. The voluntary feed intake was calculated as the difference between what was offered and the leftovers of each animal. Samples of the feed offered and leftovers were collected from the 16th to the 20th day of each experimental period and were then weighed. Subsequently, composite samples were taken daily, at 0·10 of their original weight, packed in plastic bags and stored at −20 °C.
In the fourth experimental period, faeces were collected directly from the rectal ampulla, after the morning and afternoon milking of the 17th and 18th days. Samples were packed and frozen separately by period of day and day of collection. At the end of each collection period, the samples of faeces were thawed, dried at 55 °C in a forced air circulation drying oven for 72 h and weighed, in order to obtain samples with weight equal to all faeces collected separately. The samples of leftovers were defrosted, homogenized and subjected to the procedures described in Silva & Queiroz (Reference Silva and Queiroz2002) in order to determine DM and the total N in the leftover feeds and faeces.
The milk was collected from the 16th to the 20th day of each experimental period and its composition was determined on the basis of the sample collected with 0·10 of the milk obtained manually in the afternoon of the 15th day and in the morning of the 16th day, forming a composite sample. The contents of total N and urea N were determined at the Laboratory of Lactation Physiology of the Escola Superior Luiz de Queiroz (ESALQ), in Piracicaba/SP, Brazil.
Spot urine samples were obtained from each animal on the 19th day of each experimental period, 4 h after the morning feeding, during spontaneous urination. Samples of 10 ml were diluted in 40 ml sulphuric acid (H2SO4) 0·036 N. The pH of samples was adjusted to values <3 in order to prevent bacterial destruction of the purine derivatives and precipitation of uric acid, then they were stored at −20 °C for later analysis of creatinine and purine derivatives, urea and total N.
In order to estimate ruminal microbial synthesis, purine derivatives (allantoin, uric acid, xanthine–hypoxanthine) were analysed in urine and allantoin samples in milk collected as previously described. Total excretion of purine derivatives was calculated as the sum of the quantities of allantoin, uric acid, xanthine–hypoxanthine present in the urine and allantoin samples of the milk, expressed as mm/day, according to the methods described by Chen & Gomes (Reference Chen and Gomes1992).
The purines absorbed (X, mm/day) were estimated from the excretion of purine derivatives (Y, mm/day) through an equation proposed by Belenguer et al. (Reference Belenguer, Yanez, Balcells, Baber and Gonzalez-Ronquillo2002) for goats, in which the excretion of purine derivatives (Y) is divided by the recovery rate of purines (0·76): X = Y/0·76.
In order to estimate the synthesis of microbial N compounds (MN), Belenguer et al. (Reference Belenguer, Yanez, Balcells, Baber and Gonzalez-Ronquillo2002) proposed the following equation: MN (g/d) = X/(0·92 × 1·97), assuming that 0·92 is the coefficient of true digestibility of the purine bases in the duodenum and 1·97 (mm of purine bases/g N) is the ratio between the purine bases (164 mm/g DM) and the N content (83·8 mg/g DM) in the microbial population extracted from the rumen of goats.
The balance of the N compounds was calculated as being the difference between the total N ingested and the total N excreted in the faeces, milk and urine.
Blood sampling was performed on the 19th day of the experimental period, 4 h after the morning feeding. Blood was collected from the jugular vein, using Vacutainer™ tubes (Becton, Dickinson & Company, NJ, USA) with ethylenediaminetetraacetic acid (with EDTA as anticoagulant, and then centrifuged at 3599 rpm for 10 min. Subsequently, the plasma was transferred to Eppendorf tubes and stored at −20 °C for later urea analysis. Urea values were converted into urea N by multiplying by the factor 0·4667, which corresponds to the urea N content.
Commercial kits from Bioclin® (Delft, the Netherlands) were used in order to quantify the creatinine and urea in the urine, and the urea in the plasma. The daily urine volume was estimated by multiplying the average excretion of creatinine by the average BW of each goat in each period, and then dividing it by the concentration of creatinine (mg/l) for the spot urine. The daily creatinine excretion value used was 24·6 mg/kg of BW, as described by Pereira et al. (Reference Pereira, Pereira, Santos, Santos, Del Rei and Almeida2008) for lactating Saanen goats.
The effect of treatments was evaluated and partitioned into linear and quadratic polynomial contrasts for N balance, concentration and excretion of urea, excretion of purine derivatives and microbial protein synthesis.
The procedure adopted was the MIXED from SAS software (Littell et al. Reference Littell, Milliken, Stroup and Wolfinger1996), with the following model:
 $$Y_{ijk} = \mu + S_i + G_{\,j(i)} \, + \,P_k + \,CP_l + e_{ijk} $$
where Y ijk is the observed value for the variable under study concerning the animal (j) that has received treatment (i) in the period (k); μ the overall mean; S i the square effect (i = 1–4); G j(i) the goat effect within the square (j = 1–8); P k the period effect (k = 1–4); CP l the effect of the CP levels (l = 100, 130, 160 and 190 g CP); and e ijkl the residual error.
RESULTS
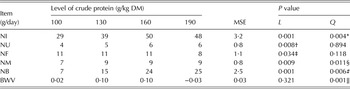
The N intake was affected quadratically (P < 0·01), with maximum estimated value at 49 g/day for the level of 189 g CP/kg DM in the diet, consistent with the highest level of CP offered by diet (Table 3). The N compounds in urine increased linearly (P < 0·01) as the levels of CP in the diet were elevated. Faecal N decreased linearly (P < 0·01), with an estimated decrease of 34 % in excretion for each 10 g CP added to the diet. The N balance was positive, with a quadratic response (P < 0·01), remaining constant with 160–190 g CP in the diet. However, BW decreased by 0·03 g/day (Table 3).
Mean nitrogen compounds ingested (NI), nitrogen excreted in urine (NU), nitrogen excreted in faeces (NF), nitrogen excreted in milk (NM), nitrogen balance (NB) and body weight variation (BWV) in lactating goats fed with diets containing differing levels of crude protein

MSE, mean standard error; L, linear; Q, quadratic; ns, not significant.
* Ŷ = −(52·2151 ± 12·5665) (P < 0·01) + (10·6544 ± 1·8032)X (P < 0·001) – (0·2816 ± 0·06191)X 2 (P < 0·001).
† Ŷ = −(9·1019 ± 1·0931) (P < 0·001) + (1·9345 ± 0·1568)X (P < 0·001).
‡ Ŷ = (13·9787 ± 0·9367) (P < 0·001) − (0·3405 ± 0·06294)X (P < 0·001).
§ Ŷ = −(7·9005 ± 5·9101)ns + (2·3070 ± 0·8480)X (P < 0·01) − (0·07394 ± 0·02912)X 2 (P < 0·05).
# Ŷ = −(31·5129 ± 2·0539) (P < 0·001) + (5·5821 ± 0·2947)X (P < 0·001) − (0·1335 ± 0·01012)X 2 (P < 0·001).
‖ Ŷ = (0·04375 ± 0·02818)ns + (0·01460 ± 0·004044)X (P < 0·001) − (0·00087 ± 0·000139)X 2 (P < 0·001).
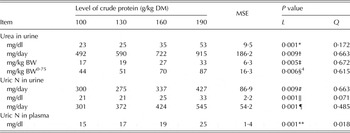
The urea concentrations in urine, milk and blood plasma increased as the CP levels in the diets were increased (P < 0·01) (Table 4).
Excretion and concentration of urea and ureic nitrogen (N) in urine, milk and plasma of lactating goats fed with diets containing levels of crude protein

BW, body weight; MSE, mean standard error; L, linear; Q, quadratic.
* Ŷ = (0·7257 ± 12·8116) + (2·1403 ± 0·8608)X (P < 0·05).
† Ŷ = (708·84 ± 49·7576) (P < 0·001).
‡ Ŷ = (22·6272 ± 1·7769) (P < 0·001).
§ Ŷ = (59·8894 ± 4·7567) (P < 0·001).
# Ŷ = (330·82 ± 23·2219) (P < 0·001).
‖ Ŷ = (6·0572 ± 0·7232) (P < 0·001) + (1·2267 ± 0·005449)X (P < 0·001).
¶ Ŷ = (367·66 ± 17·8200) (P < 0·001).
** Ŷ = (97·8666 ± 1·8832) (P < 0·001) + (0·7681 ± 0·1265)X (P < 0·001).
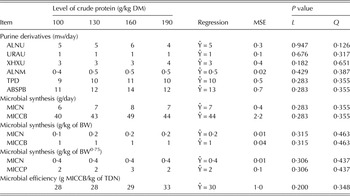
Excretion of purine derivatives and total purines (TPs), absorbed purines (AP), microbial nitrogen (MN) and microbial crude protein (MCP) expressed as g/kg of BW and g/kg of BW0·75 and the microbial efficiency were not affected by CP levels in the diets (Table 5).
Urinary excretions of allantoin in urine (ALNU), uric acid (URAU), xanthine and hypoxanthine (XHXU), allantoin in milk (ALNM), total purine derivatives (TPD), absorbed purine bases (ABSPB), microbial nitrogen (MICN), microbial crude protein (MICCB) and microbial efficiency as a function of the levels of crude protein in the diets

BW, body weight; MSE, mean standard error; L, linear; Q, quadratic.
The excretion of allantoin in urine was not influenced by protein levels in the diet, averaging 5 mm/day, and neither was excretion of uric acid, xanthine–hypoxanthine or allantoin in the milk, averaging 1, 3 and 0·5 mm/day, respectively. The excretion of allantoin in milk is related to milk production which, despite having a positive linear effect in the present study, did not increase sufficiently to promote differences in excretion. The TP derivatives were not influenced by the diets. The AP as well as N synthesis and microbial protein followed the same trend as TP derivatives excretions, and were not influenced by diet because these variables were obtained by an estimate of this excretion.
DISCUSSION
Nitrogen intake followed the same trend as DM intake, whose maximum was with 140·7 g/kg CP in the diet (Santos et al. Reference Santos, Pereira, da Cruz, de Figueiredo, Almeida, Novaes, de Souza, Alencar, Sousa and Pereira2015). As for the N compounds in urine, excretion increased 2 g/day for every 10 g CP added to the diet. High N concentrations in the urine indicate that the metabolizable protein was not used efficiently, mainly for milk production. This fact might be related to the increase in CP concentrations associated with the sources of protein offered to the animals because, according to Valadares Filho et al. (Reference Valadares Filho, Machado, Chizzotti, Amaral, Magalhães, Rocha Junior and Capelle2010), most of the soybean meal protein and alfalfa hay are present in fraction B1, with an estimate of 0·9 and 0·7 of CP, respectively. This fraction is rapidly degraded and is responsible for the high production of ruminal ammonia. Microorganisms do not always use this ruminal ammonia for microbial protein synthesis, mainly when there is no synchronicity between the use of N and carbohydrate, causing an increase in the loss of N compounds through urine, where the main component most changed is N from urea (Table 4). Even if there is a higher intake, the proportional increase in CP digestibility (Santos et al. Reference Santos, Pereira, Pedreira, Carvalho and Cruz2014) caused by the greater content of soybean meal resulted in the reduction of N excreted in the faeces.
For all diets, N balance was positive, indicating that the levels met the needs for metabolizable protein by animals, not therefore requiring N mobilization from their body reserves. Body weight decreased, suggesting that the energy of excess protein intake may not be due only the synthesis of urea ruminal ammonia but may be, a consequence of the oxidative metabolism of amino acids absorbed in excess of requirements, or other metabolic effects of the protein degraded.
The maximum variation in BW was 0·10 kg/day, which remained constant between 130 and 160 g CP, thus it may be inferred that at these levels there was greater efficiency in the use of protein and energy and consequently higher retention of body N.
The equations adjusted for N balance and variation in BW did not provide accurate estimates for the reason that the levels predicted were different from those actually measured. Such behaviour can best be observed by the equation for N balance, in which the level of 100 g CP was 70% lower than 130 g, 160 g was 28% higher than 130 and 190 g was 11% higher than 160 g.
The metabolic losses of urinary and faecal N for each protein level were calculated using the equations proposed by the NRC (2007). The estimated amounts of metabolic N lost in the urine were on average 3, and 9 g/day in the faeces, which amount to metabolic losses of 12 g/day.
After the subtraction of metabolic losses, the values of N for maintenance to be replenished by the feed were approximately 3, 4, 5 and 4 g/day, at CP levels of 100, 130, 160 and 190 g/kg, respectively. This left on average 26, 36, 46 and 44 g metabolizable N available/day, which corresponds to 0·9, 0·9, 0·9 and 0·9 of the ingested N. The metabolizable N for maintenance (including losses by skin flaking) was estimated on average at 20 g/day. Thus, approximately 23, 37, 39 and 15 g N/day, respectively, for intake levels of 29, 39, 50 and 48 g N/day, were available for milk production.
These results, associated with the positive balance of N, lead to the inference that there was a reduction in energy availability, not because of the substitution of alfalfa hay by soybean meal but probably because there was an excess of protein digested in relation to the NFC of the diets, whose values are similar.
By determining the total carbohydrate fractions of forage plants, Cabral et al. (Reference Cabral, Valadares Filho, Malafaia, Lana, Silva, Vieira and Pereira2000) reported, for alfalfa hay, 0·2, 0·5 and 0·3 of fractions C, B2 and NFC, respectively, for alfalfa hay, as a proportion of TC. On the other hand, Malafaia et al. (Reference Malafaia, Valadares Filho, Vieira, Silva and Pereira1998) observed mean values of 0·3 of fraction C, 0·1 of fraction B2 and 0·3 for NFC as a proportion of TC in soybean meal. Therefore, alfalfa hay has approximately 1·2 times less carbohydrate of fraction C and six times more carbohydrate of fraction B2 in relation to soybean meal. On the other hand, soybean meal has, on average, 1·1 times less NFC than alfalfa hay, which led to a reduction of neutral detergent fibre (NDF) in the diet with total replacement of alfalfa hay with soybean meal.
The concentrations of urea as well as its rate of increase were higher in the urine, confirming that this is its main excretion route, surpassing the recycling of dietary N in the form of urea via saliva and the ruminal wall, mainly when the level of CP in the diet exceeded 160 g/kg. As for the blood urea N, expressed as mg/dl, where data also varied quadratically, the linear model (P < 0·05) was the one that best fitted the behaviour of the data (Table 4). Although the blood urea came quickly into balance with the milk, ultimately, its concentrations were higher.
According to Fontaneli (Reference Fontaneli2001), the normal value of urea N in the milk of ruminants is 12 mg/dl; the author stated that several factors influence the urea N content in the milk and related this to the CP concentration of the diet; it was argued that protein values higher than 32 g/kg milk with urea N higher than 18 mg/dl, are the result of the excess of soluble or degradable protein in the rumen or deficiency of fermentable carbohydrates in the rumen. This statement is consistent with the results found in the present study, since the diets contained soybean meal and alfalfa hay – protein sources with high ruminal degradation – and urea, which is highly soluble, and increased the quantity of ammonia produced.
According to Van Soest (Reference Van Soest1994), the ammonia not used by ruminal microorganisms is absorbed by the rumen wall and transported to the liver, entering the urea cycle, where this ammonia can be either recycled or eliminated. Therefore, elevated concentrations of urea in the plasma and milk are positively correlated with the ingestion of N and associated with the highest rate of urinary excretion of urea.
According to Chizzotti et al. (Reference Chizzotti, Valadares Filho, Valadares, Chizzotti, Campos, Marcondes and Fonseca2006), the urea N in the serum can be used to obtain additional information about the protein nutrition of ruminants, by the metabolic response to a specific diet. Thus, it is possible to reduce and even avoid economic losses stemming from excessive protein supply in the diet, which can result in productive, reproductive and environmental problems.
Yu et al. (Reference Yu, Egan, Boon-ek and Leury2002) stated that excretions of allantoin, uric acid and xanthine–hypoxanthine can be influenced by dietary protein, energy source, DM intake, energy intake and protein intake. However, this was not observed, in the present study, since protein levels had no effect on these variables. This was probably because the offered diets presented a similar behaviour regarding the synchronization between protein and digestible energy, which contributed to the absence of effects of levels of CP on the microbial efficiency, where average TDN was 784 g/kg, although the intakes of DM and TDN varied quadratically (Santos et al. Reference Santos, Pereira, da Cruz, de Figueiredo, Almeida, Novaes, de Souza, Alencar, Sousa and Pereira2015).
The NRC (2001) recommends 130 g microbial protein/kg TDN when diets have over 400 g forage/kg for maximum efficiency. Thus, it is suggested that microbial growth was limited due to inappropriate synchronization between degradable protein in the rumen and fermentable carbohydrates. Diets with a roughage-to-concentrate ratio of 200:800 and having the physical form of concentrate used in the present study usually promote a high passage rate, which can reduce microbial activity. However, the effect of this increase in the passage rate, increasing the flow of microorganisms into the intestine, can be impaired by the decrease in chewing time and saliva production, whose primary function is to buffer the rumen and dilute the ruminal contents, which are essential to reduce microbial activity during the exponential growth phase. These factors can influence the microbial growth efficiency because it depends on the residence time of the microorganisms in the ruminal environment, so the energy spent on maintenance can be reduced as the passage rate of the microorganisms is increased.
CONCLUSIONS
The association of alfalfa hay with soybean meal for diets composed of 800 g pelleted concentrate/kg for lactating goats in the first third of the lactation period provides a positive balance in body N, with better results between 156 and 189 g CP/kg diet. However, avoidance of levels higher than 160 g CP/kg or ratios above 2:1 between soybean meal and alfalfa hay is recommended, as they may cause excessive loss of urea N and expenditure of energy for the elimination of the excess of protein. Microbial protein synthesis was not influenced, but the diets reduced both the efficiency of ruminal synthesis and the intestinal flow of microbial protein.
The authors would like to thank Research Support Foundation of the State of Bahia (FAPESB) for provision of financial support and the State University of Southwest of Bahia (UESB) for the scholarships awarded.