In recent years, the sustainability of US state and local public pensions has become a major concern in public finance. A central reason for this concern is the budgetary strain unfunded pension systems created for their sponsoring governments. When pension asset values fail to keep up with the growth in pension liabilities, contribution requirements increase and satisfying those obligations crowds out other spending priorities (Nation, Reference Nation2011; Anzia et al., Reference Anzia, Rubens, Finke, Kent, Tsai, Lynn and Shea2019). As such, the asset management practices and investment returns of public pension systems are major risks to the budgetary stability of state and local governments and to the long-term sustainability of public pension plans (Munnell et al., Reference Munnell, Aubry and Quinby2010).
To better understand the sustainability of US public pension systems, this study examines the long-term effect of low-return environments – where investment returns fall below their historical rates – on pension systems' unfunded liabilities and contribution costs.Footnote 1 In other words, we aim to understand how the unfunded liabilities and contribution costs of pension systems may change if lower-than-expected-investment returns persist over as many as 10 years. This topic is timely because most US public pension systems allocate significant portions of their assets to cyclical securities, especially equities, in order to improve funded ratiosFootnote 2 and reduce budgetary contributions and because capital market professionals increasingly expect we are entering a low-return environment that may last 10 years or more. In this article, we use a survey of capital market assumptions, over a 10-year investment horizon, to model the effects of low-return conditions on a simulated pension system and examine the moderating effects of different investment, amortization, and contribution practices.
This study aims to fill several gaps in public pension literature. First, most of the previous research focused on the marginal effects of various political, economic, and managerial institutions on the valuation of pension liabilities (e.g., Chaney et al., Reference Chaney, Copley and Stone2002; Eaton and Nofsinger, Reference Eaton and Nofsinger2004; Coggburn and Kearney, Reference Coggburn and Kearney2010; Novy-Marx and Rauh, Reference Novy-Marx and Rauh2011a; Wang and Peng, Reference Wang and Peng2016; Peng and Wang, Reference Peng and Wang2017). That literature provided limited insight into the interactive and dynamic effects of pension institutions. This research is among the first to incorporate capital market assumptions into stochastic simulations of pension costs and liabilities, with many interactive effects and over multiple years. Second, while it is well understood that market downturns reduce asset values, thereby increasing unfunded liabilities and employer contributions, we know little about how low-return environments may affect unfunded liabilities, contribution costs, and sponsoring governments' budgets in the long run. Third, most research on pension investments focuses on asset management, especially governing board composition, and its relationship with expected-rate-of-return assumptions (e.g., Weller and Wenger, Reference Weller and Wenger2009; Stalebrink et al., Reference Stalebrink, Kriz and Guo2010; Pennacchi and Rastad, Reference Pennacchi and Rastad2011; Farrell and Shoag, Reference Farrell and Shoag2016). Less is known about how allocation strategies affect contribution policies, asset growth and volatility, and budgetary risk.
These gaps lead to several research questions. What is the long-term impact of a low-return environment on state and local government pension costs and liabilities? How are these effects moderated by allocation decisions, amortization practices, and contribution policies? How does a low-return environment affect budgetary solvency over the long term? We answer these questions by simulating the impact of a low-return environment on a hypothetical public pension plan with demographic characteristics, benefit provisions, and actuarial assumptions set to the median values of the 170 state and local pension systemsFootnote 3 included in the Center for Retirement Research at Boston College's Public Plan Database (PPD). We run the hypothetical plan through multiple investment scenarios over a 10-year horizon to examine the long-term effect of low-return environments on funded ratios and actuarially determined contributions (ADC). We also examine how the effects vary under several amortization and contribution policies.
This research does not predict how likely or how soon a low-return environment will occur but informs researchers and decision-makers about a range of expected effects if actual market returns are lower than the most common asset return assumptions. As such, this study presents the results of prudent scenario analysis (i.e., stress testing a typical pension plan under plausible market conditions). The results suggest how plan sponsors will benefit from conducting a similar analysis to understand their own exposure to market risks under their own plan characteristics and policy options.
In the next section, we discuss low-return environments and their expected effects on public pension plans. In the third section, we introduce our simulation method. In the fourth section, we present our findings. In the last section, we summarize our findings and identify implications for the governance of US state and local government-sponsored pensions and for future pension scholarship.
1. Literature review
1.1 Low-return environment
There is a consensus among well-regarded financial market experts that we are at the start of a low-return environment, which is generally defined as an extended period of time (at least 5–10 years) where most, if not all, asset classes are expected to produce returns that fall below past performance (e.g., Goldman Sachs Asset Management, 2015; McKinsey and Company, 2016; Blanchett et al., Reference Blanchett, Finke and Pfau2017; Reilly and Byrne, Reference Reilly and Byrne2017; TIAA, 2017; Vanguard, 2017; Horizon Actuarial Services, 2018; Wang et al., Reference Wang, Chapman, Peterson and Spinney2018). A low-return environment differs from a bear market because it does not necessarily imply a market downturn, where assets lose value, but only that long-term returns underperform previous experience.
A survey of investment-advisor reports shows the average long-term expected returns for eight common asset classesFootnote 4 at their lowest levels in the past 5 years (Horizon Actuarial Services, 2016). According to McKinsey Global Institute (2016), the expected returns of US equity and fixed-income securities over the next 10–20 years will be lower than the returns from 1985 to 2014 and potentially fall short of 50- and 100-year averages, and that US markets are unlikely to achieve investment returns near the 30-year average even if the US economy experiences historical GDP growth rates. Diminishing returns are also predicted by an inverse linear relationship between cyclically adjusted price-to-earnings (CAPE) ratios and 10-year forward equity market returns (Manning-Naiper, 2016).
Predictions of a low-return environment are based on a confluence of economic and business conditions. These include: (i) slowing growth in productivity due to expectations that firms have already experienced most of the productivity gains from the digital economy and improved global supply chains; (ii) an aging population (Cembalast and Gould, Reference Cembalast and Gould2015; BNY Mellon, 2017); (iii) a long-term trend in reduced fixed-income yields; and (iv) a rise in global business competition, trade disputes, and geo-political uncertainty.
Of course, the importance of understanding the relationship between low-return environments and public pensions does not depend on the accuracy of these market forecasts. Recent forecasts may not materialize as predicted – either because they are too conservative or too optimistic. We should also expect future forecasters to predict a strong investment environment when low-returns are actually on the horizon. As such, the veracity of market forecasts is only part of the reason to examine the effects of low-return environments. Rather, given the uncertainty of asset returns and the salience of asset values to the solvency of pension systems and stability of budgetary contributions, analysis of low-return scenarios is a reasonable and prudent strategy for pension systems as an ongoing risk management strategy.
1.2 Low-return environment and public pension governance
There are several ways low-return environments may affect pension system governance. In this subsection, we focus on three of the most salient and interrelated effects.
One way that low-return environments may affect pension system governance is by motivating governing boards to change their investment strategies in search of higher returns. Andonov et al. (Reference Andonov, Bauer and Cremers2013) demonstrate that US public pensions already invested a larger share of their portfolios in riskier assets compared to both European public plans and US corporate plans. Boyd and Yin (Reference Boyd and Yin2017) show that public-pension plans' equity investments have increased continuously since the 1970s. In 2016, public plans invested approximately 70% of their assets in equity-like investments, compared to less than 55% in private plans (Boyd and Yin, Reference Boyd and Yin2017).
When long-term investment returns decline, or a decline is anticipated, pension asset managers are incentivized to reallocate assets to higher-risk/higher-return securities in order to increase pension asset balances. One downside of yield-seeking is the increased likelihood of investment loses. Another downside is that investing in riskier assets is likely to increase asset volatility in public pension plans. When investment returns fall, even if only due to natural cycles in asset values, sponsoring governments have to bear the often-substantial increases in pension contributions. As such, increasing the uncertainty of investment returns increases the likelihood that sponsors will need to use budgetary resources to cover shortfalls in asset values, crowding out other public service priorities.
Public pension systems use a variety of contribution policies to reduce the volatility of sponsors' contributions (Boyd and Yin, Reference Boyd and Yin2017). These policies are useful for stabilizing governments' expenditures but often contribute to lower pension asset values. For example, some contribution policies limit increases in employer contributions, which increase unfunded liabilities and leave plans with fewer assets to invest and thereby reduce returns to compensate for previous losses, adding to the pressure to increase investment returns (more on the role of contribution policies below).
A second way low-return environments may affect pension system governance is by straining the legitimacy of the discount rates pension systems use to value their liabilities. Following current governmental accounting standards in US state and local governments, pension systems select a discount rateFootnote 5 equal to their ‘long-term expected rate of return on pension plan investments’ (GASB, 2012); these pension systems then are expected to invest their assets in a manner that reflects their expected rate of return assumption. This practice is highly criticized by many financial economists and actuaries because, from their perspective, discount rates should reflect the nature of the benefit guarantee rather than the expected return on investments; and, since public pension benefits enjoy significant legal protections, critics conclude that discount rates should approach a risk-free rate of return (Novy-Marx and Rauh, Reference Novy-Marx and Rauh2009, Reference Novy-Marx and Rauh2011b).
There is also a concern that public pension systems opportunistically choose a higher discount rate to reduce contribution requirements, especially when sponsoring governments face fiscal and/or political pressure (Romano, Reference Romano1993; Chaney et al., Reference Chaney, Copley and Stone2002; Eaton and Nofsinger, Reference Eaton and Nofsinger2004; Chen and Matkin, Reference Chen and Matkin2017).
Most public pension systems use a discount rate between 7% and 8% (PPD, 2017), which is certainly higher than a riskless rate of return and is also higher than the rate of return many market experts believe is likely over the next 10 years. Of course, the difference between expected rates and actual rates does not change the true size of pension systems' future obligations, only the valuation of the present value of those obligations and the calculation of the ADC necessary to fund the liability. As plan participants approach retirement, the actual size of their liability becomes clearer and any discrepancy between the actual liability and the asset values set aside to pay those liabilities also becomes clearer. As such, the larger the discrepancy between expected rates of return and actual returns, the higher the contribution costs of pension plans and the worse the budgetary solvency of sponsoring governments. Because a low-return environment reduces asset values and justifies lower discount rates, which then increases liabilities, it increases the discrepancy between expected rates of return and actual returns.
A third way low-return environments may affect pension system governance is by focusing attention on various contribution policies that determine how aggressively a sponsor seeks to pay down its unfunded pension liabilities.
There are several ways governments can reduce their unfunded liabilities, though most strategies face significant legal, fiscal, and political challenges. For example, they can reduce benefits. However, it is politically difficult and legally prohibited in most situations to cut pension benefits for current participants. State statutes or constitutions explicitly protect the benefits accrued by plan participants and even benefits that will accrue from future service (Monahan, Reference Monahan2010). In addition, in states that permit collective bargaining, pension benefits are usually a central focus of the bargaining process (Steffen, Reference Steffen, Mitchell and Hustead2001). In addition, governments could utilize other funding sources to pay off unfunded pension liabilities. However, it is difficult to increase employee contributions because contracts with employees, among other concerns, also constrain these actions. And, it is also difficult to raise taxes or move revenues from other public programs because low-return environments usually accompany economic downturns when governments experience fiscal stress.
As such, the cost of larger unfunded liabilities is usually born by the sponsoring government's budget, though the effect varies by the contribution policies of specific pension plans. This study examines two types of contribution policies affected by low-return environments: the amortization of unfunded liabilities and the rules around changing annual contribution amounts.
1.2.1 Amortization of unfunded liabilities
Public pension systems are not expected to fully pay down their unfunded liabilities in a single year. Rather, pension systems amortize their unfunded liabilities over multiple years, effectively setting up a payment schedule to reduce their unfunded liabilities. There are several options for how pension systems can amortize their unfunded liabilities. One option is how many years over which to amortize the unfunded liability. Short amortization periods pay down a larger portion of the unfunded liability each year and thereby increase contribution costs. Most public pension plans amortize their unfunded liabilities over as many as 30–40 years (PPD, 2017). Another option is whether to use an open or closed amortization strategy. In an open amortization strategy, amortization period is a fixed number of years (e.g., 30 years) and the unfunded liability is re-amortized each year over that number of years. In a closed amortization approach, the amortization period reduces by 1 year, each year, with the intention to pay off the entire unfunded liability by the end of the amortization period. Another option we consider is whether to amortize on level dollar or level percent of payroll. So long as pension systems assume their payrolls will increase over time (even if only as a matter of inflation), the annual payments in the level-percent amortization are always higher in the later years than earlier years.
1.2.2 Limits on the growth in annual contributions
The ADC is the annual contribution amount a pension system's actuary calculates in order to fully cover a pension plan's normal cost and the amortized portion of their unfunded liability (i.e., the UAAL cost). Many plan sponsors seek to pay their full ADC, either as a matter of law, policy, or practice, but there is no federal regulation to mandate pension sponsors to contribute full ADC. Generally accepted accounting principles (GAAP) in the USA only stipulate that pension systems report their ADC on their annual audited financial reports. Some plan sponsors impose a contribution growth cap by legislation, policy, or practice. In those cases, if the ADC exceeds a certain dollar value or increases faster than a specified growth rate, legislative institutions or budgetary decisions limit sponsoring governments' contributions to levels that are less than their full ADC. Caps may take the form of limits to increases in dollar value or growth rates.
These contribution policies, coupled with the changes of investment environment, influence pension costs and liabilities for the sponsoring governments. The next section describes the simulation model we use to examine the interactive effects of these contribution policies with the investment environment on pension costs and liabilities for a hypothetical pension plan and its sponsoring government.
2. Simulation method
We use a simulation approach to examine the effect of a low-return environment on public pension systems. The simulation involves three stages: (i) generating a distribution of plan participants (including active, vested-terminated, and retiree participants); (ii) calculating the plan's actuarial liabilities, benefit payments, normal costs, and covered payroll; and (iii) simulating asset returns, liabilities, and required contributions over a 10-year horizon under different investment and contribution scenarios. Each stage is described below.
2.1 Stage 1: simulate the participant population
The first stage of building the hypothetical pension plan is to create a group of plan participantsFootnote 6: active, vested-terminated, and retirees. In order to focus on the effects of investment returns, actuarial practices, and contribution policies, and not on changes in a plan's demographic profile over time, the hypothetical plan is constructed to maintain a stable demographic profile. This is done by using the RP-2014 mortality table and conditional termination rates from Winklevoss (Reference Winklevoss1993) in order to create a ‘steady state’ distribution, such that the count of participants in each demographic group is consistent from year to year.
The following parameters are used to construct the distribution:
• Entry ages: 25–50-years old
• Mean age: 45-years old
• Retirement age: 65-years old
• Maximum age: 100-years old
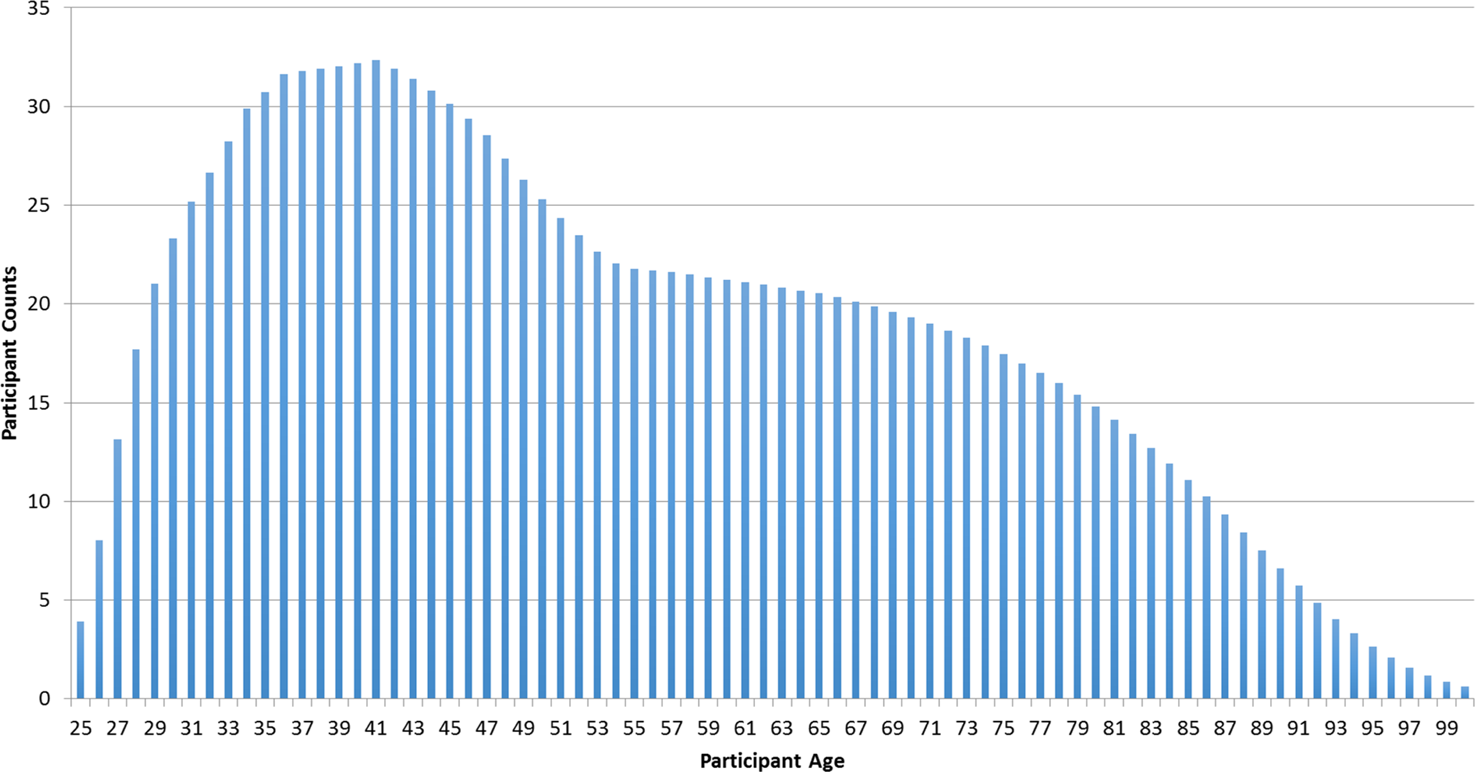
The total size of the hypothetical pension plan is the sum of the weighted representation of each demographic group. An example demographic group is employees who are currently 40-year old and were hired when they were 30-years old – this group comprises 0.2085% of the total participants. We standardize our distribution at 1,000 participants, so there are 2.085 active employees in our hypothetical plan who are currently 40-years old and were hired when they were 30-years old. Figure 1 is a histogram of the age distribution for active participants and the retirees who remained active until the retirement age of 65.
Distribution of active participants and retirees.
Note: The figure shows the age distribution for active participants and the retirees who remained active until the retirement age of 65. Participant Age (x-axis) represents all of the possible current ages for active participants and retirees. Participant Counts (y-axis) is the weighted count of the active participants and retirees in each age group. The total number of active participants is approximately 1,000. The total number of participants does not affect the plan's funded ratio or actuarially determined contribution as share of payroll. This is a steady-state distribution, such that the count of participants in each demographic group is consistent from year to year.

Based on the distribution of active participants, we calculate the number of vested-terminated participants. There are 8,190 demographic groups for terminated participants, although each of the groups has very low weights. For example, the weight is 0.035 for terminated participants with entry age of 26, termination age of 50, and current age of 56.
2.2 Stage 2: simulate pension liabilities
We simulate a public pension plan in which the plan characteristics, benefit provisions, and actuarial assumptions closely match with the median values of the 170 state and local plans in the Public Plan Database (PPD) (2017). The plan characteristics, benefit provisions, and actuarial assumptions are listed belowFootnote 7:
• Benefit multiplier: 2%
• The final average salary in the last 5 service years is used for benefit calculation
• Retirement benefits are paid as life annuities
• Cost-of-living adjustments for retirees: 2%
• Vesting period: 5 years
• Discount rate: 7.5%
• Inflation rate: 2%
• Real salary growth rate: 3%
• Actuarial cost method: Entry Age Normal (EAN)
• Morality rate table: RP-2014
• Employee turnover rates follow 2003 Society of Actuaries (SOA) Pension Plan Turnover Study
• The entry salary for a participant who is 25-years old in the first year of our analysis (i.e., entry age = 25 and current age = 25) is $1;
• We assume inflationary adjustments for entry salaries from the $1 base salary so that when entry age = 25 and current age = 26, the entry salary is $1 discounted by 1 year; and so that when entry age = 26 and current age = 26, the entry salary is $1 inflated by 1 year
• Asset smoothing period: 3 years
Based on the above assumptions for our hypothetical plan, we follow Winklevoss (Reference Winklevoss1993) to calculate actuarial accrued liabilities, present value of future benefits, normal costs, and required contributions. Because the population distribution is constructed in a steady-state condition, the annual change in liabilities and contribution costs is equal to inflation.
2.3 Stage 3: simulate pension assets
Horizon Actuarial Services conducts an annual survey of capital market assumptions (CMAs) for asset classes in which pension plans commonly invest. In 2018, the survey received 35 responses from investment advisorsFootnote 8 providing information on projected returns and volatilities for sixteen asset classes over 10-year and 20-year horizons. We use the 10-year capital market assumptions for our simulation. The expected return, standard deviation, and correlation assumptions are shown in Appendix A and B.
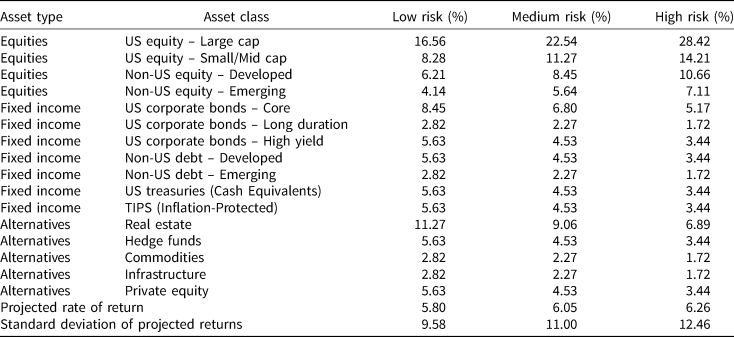
Horizon Actuarial Services also constructs a hypothetical asset allocation for a multiemployer pension plan. Table 1 shows the 16 asset classes included in the Horizon survey. To obtain the return assumptions for the typical public pension plan, we start with Horizon Actuarial's hypothetical allocation, then adjust those allocations based on the actual allocation of public pension plans using investment allocation data for 170 state and local pension plans from the PPD (PPD, 2017). Recognizing different levels of risk in actual plans, we construct three allocation strategies. Among the 170 plans in PPD, the 10th, 50th, and 90th percentiles of allocation in equities are 35.2%, 47.9%, and 60.4%, respectively. As such, we simulate asset allocations as Low risk, Medium risk, and High risk (as shown in Table 1) to match actual equity allocations, while the allocations among the sub-categories of equities, fixed incomes, and alternatives align with the baseline hypothetical allocation in Horizon survey report (2018). Then, based on capital market assumptions presented in the Appendices, we calculate the projected rate of return and standard deviation of the returns for these allocations in 10 years,Footnote 9 as shown in Table 1. Investment returns to each allocation are assumed to follow a normal distribution with the projected return and standard deviation shown in Table 1.
Hypothetical asset allocation and projected returns.

Note: The table shows three hypothetical asset allocations for the typical pension system. Low risk, Medium risk, and High risk asset allocations are based on the fact that the 10th, 50th, and 90th percentiles of allocation in equities of 170 state and local pension plans in Public Pension Data (PPD) is 35.2%, 47.9%, and 60.4%, respectively. The allocations among the sub-categories of equities, fixed incomes, and alternatives follow the baseline hypothetical allocation in Horizon survey report (2018).
In the next section, we present the results of a 10-year simulation for low-risk, medium-risk, and high-risk allocations for the typical pension system. At the beginning of the simulation, the typical pension system is 80% funded with an ADC between 19.2% and 26.3% of payroll.Footnote 10 We conducted a total of 144,000 simulations – 1,000 runs of 144 permutations of four allocation strategies, three contribution policies, three amortization periods, open or closed amortization, and level-dollar or level-percent amortized.
3. Simulation results
The results of our simulations are summarized in Figures 2–4. We present the funded ratio and ADC of the hypothetical pension system at the end of year 10 with different investment strategies (low risk, medium risk, and high risk), amortization policies (aggressive, moderate, and conservative – described below), and contribution policies (fixed amount, fixed percent, and full ADC).
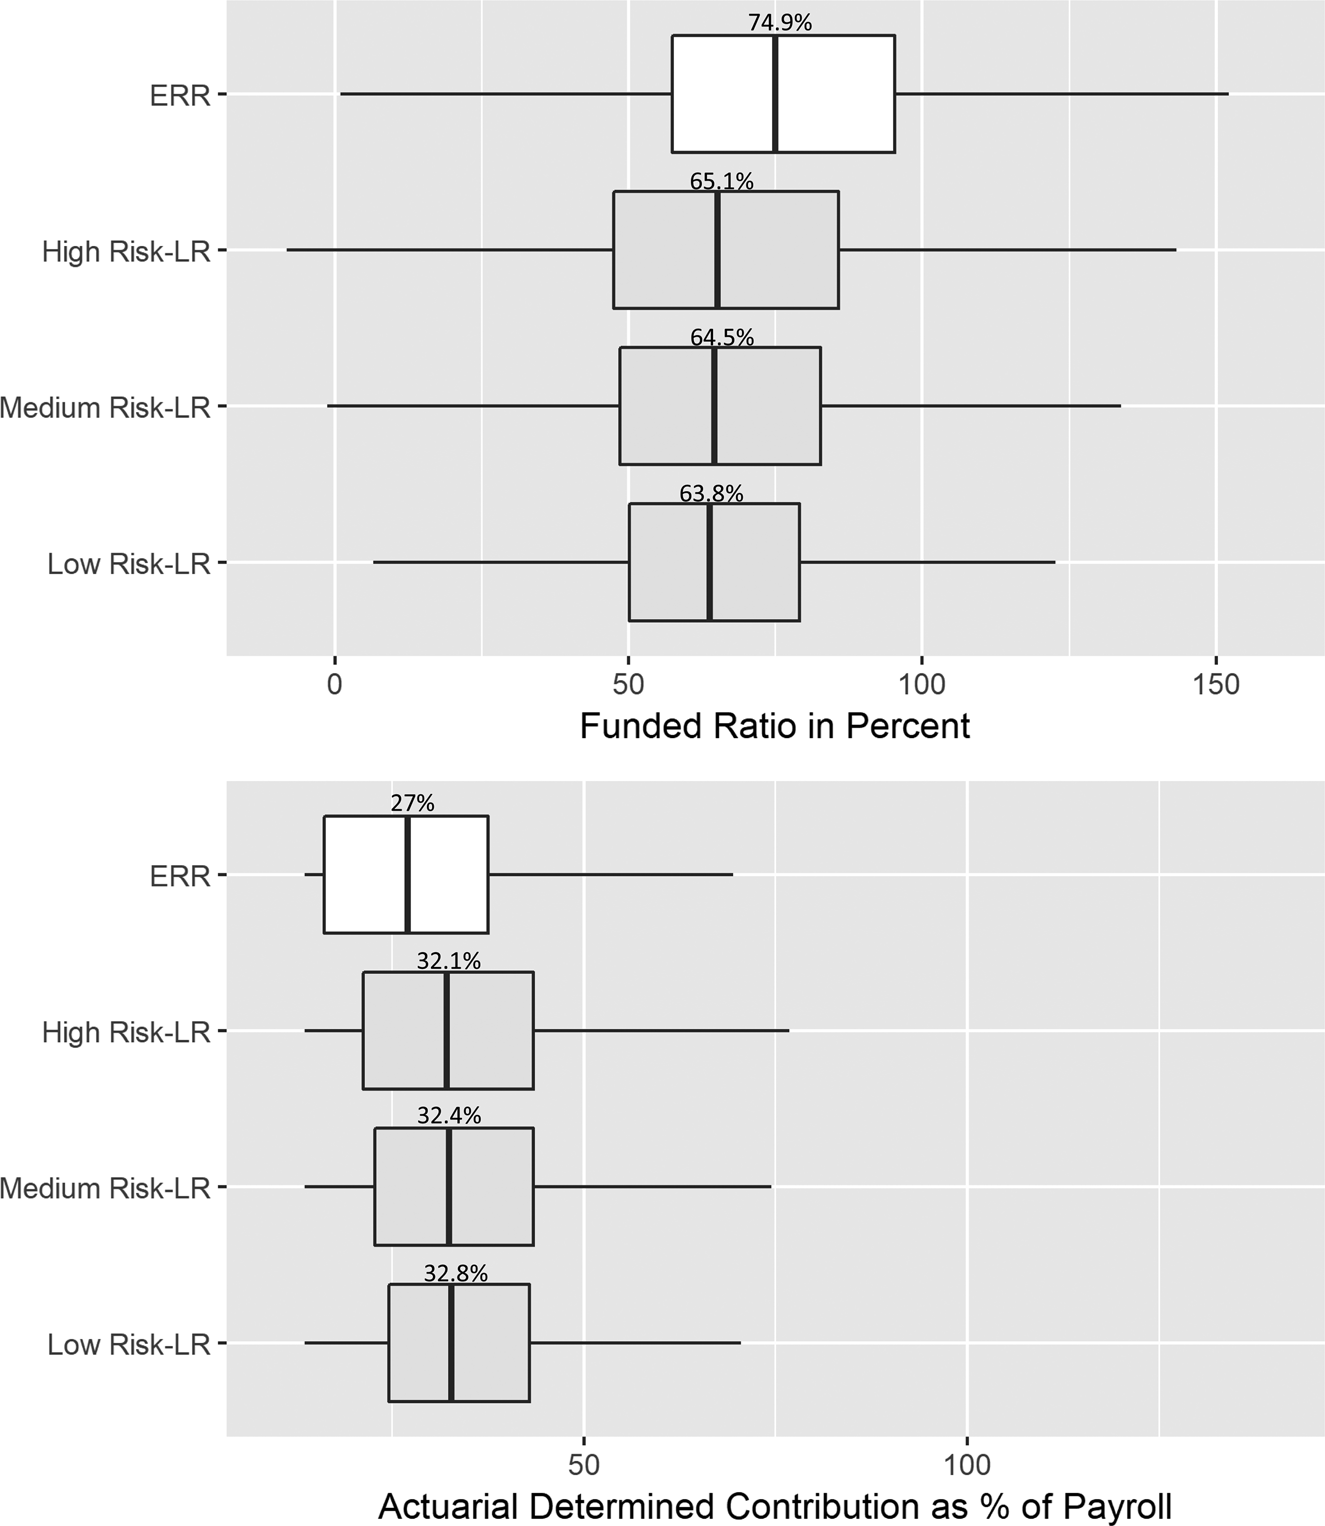
Funded ratio and ADC under different investment strategies.
Note: The figures present the simulated funded ratio in percent and actuarial determined contribution as percent of payroll under different investment strategies – High Risk, Medium Risk, and Low Risk. ERR stands for the expected-rate-of-return scenario and the LR indicates the low-return environment scenario. The vertical line in the center of each boxplot indicates the median value. The rectangular boxes indicate the interquartile ranges (IQR), from the first quartile to the third. The horizontal lines extending from the boxes are equal to 1.5 × IQR below the first quartile and above the third quartile.

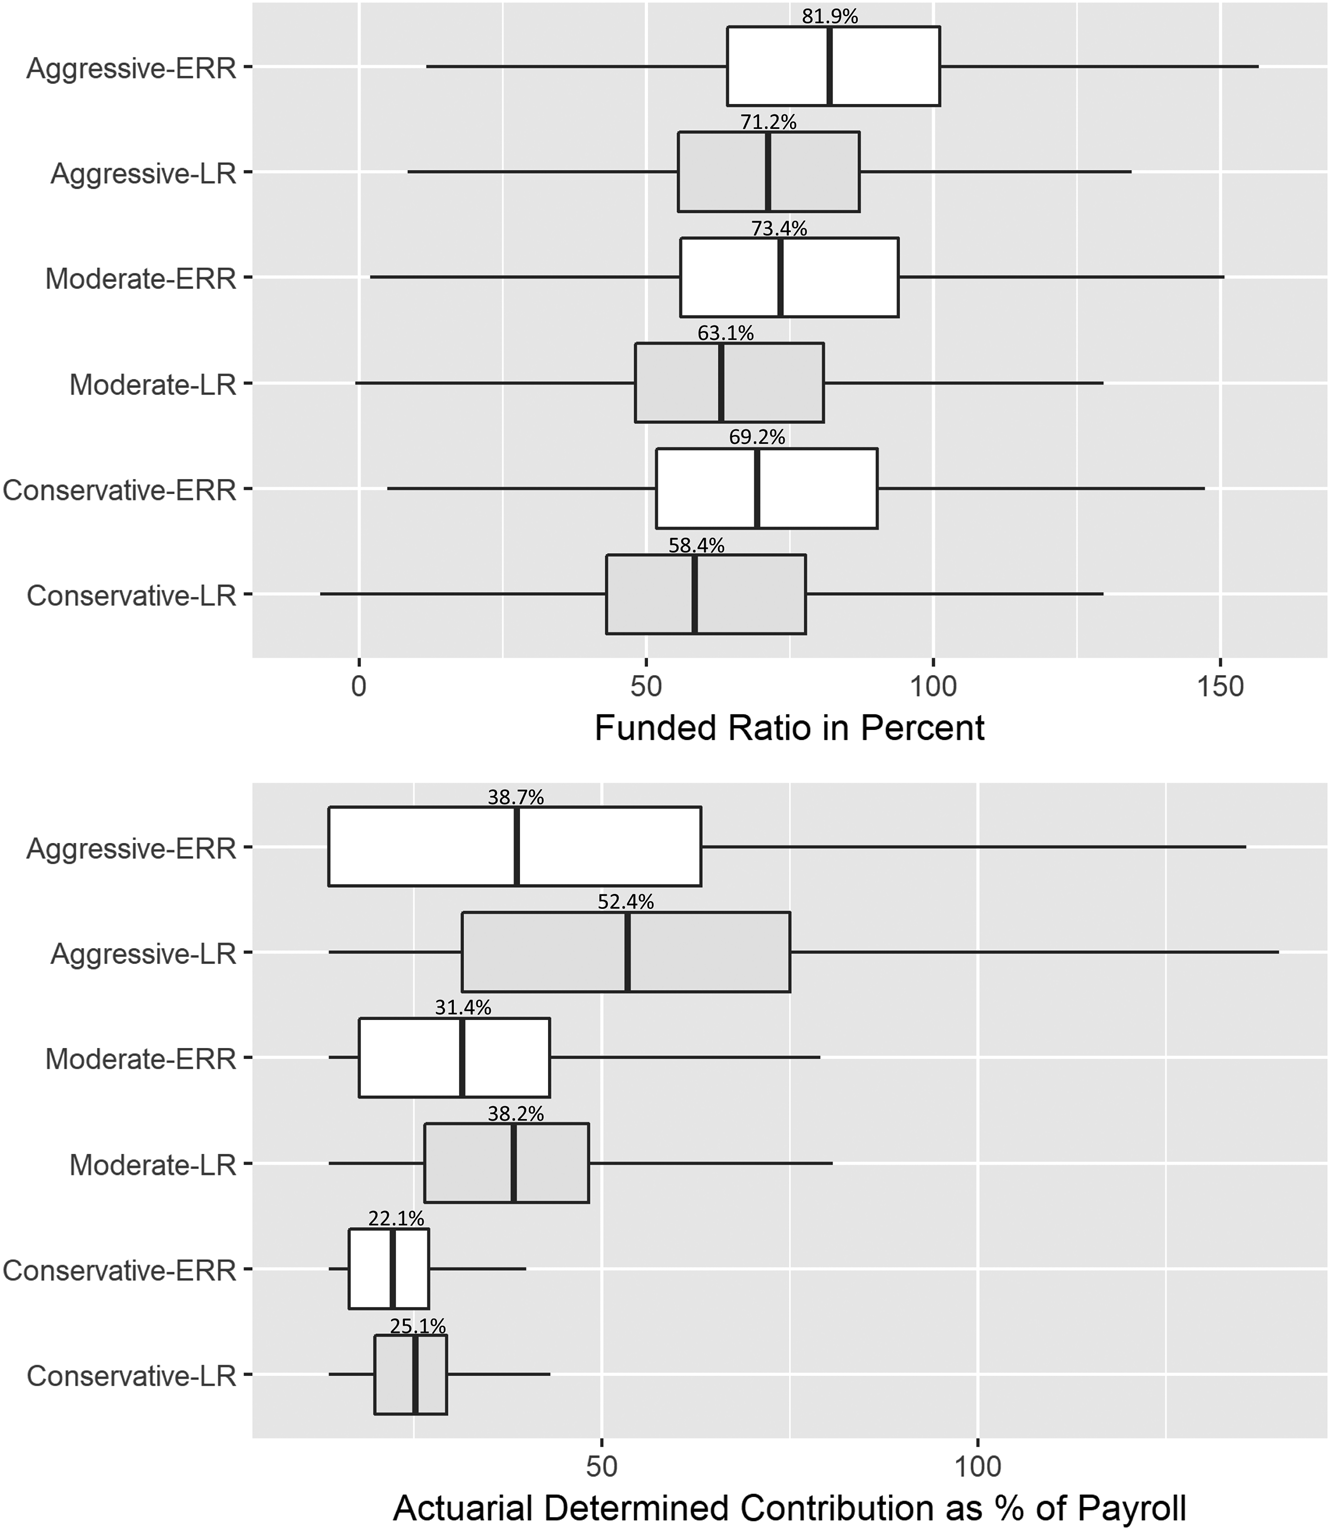
Funded ratio and ADC under different amortization policies.
Note: The figures present the simulated funded ratio in percent and actuarial determined contribution as percent of payroll under different amortization policies – Aggressive (15 years, closed, level dollar), Moderate (20 years, closed, level percent) and Conservative (30 years, open, level percent) amortization policies. ERR stands for the expected-rate-of-return scenario and the LR indicates the low-return environment scenario. The vertical line in the center of each boxplot indicates the median value. The rectangular boxes indicate the interquartile ranges (IQR), from the first quartile to the third. The horizontal lines extending from the boxes are equal to 1.5 × IQR below the first quartile and above the third quartile.

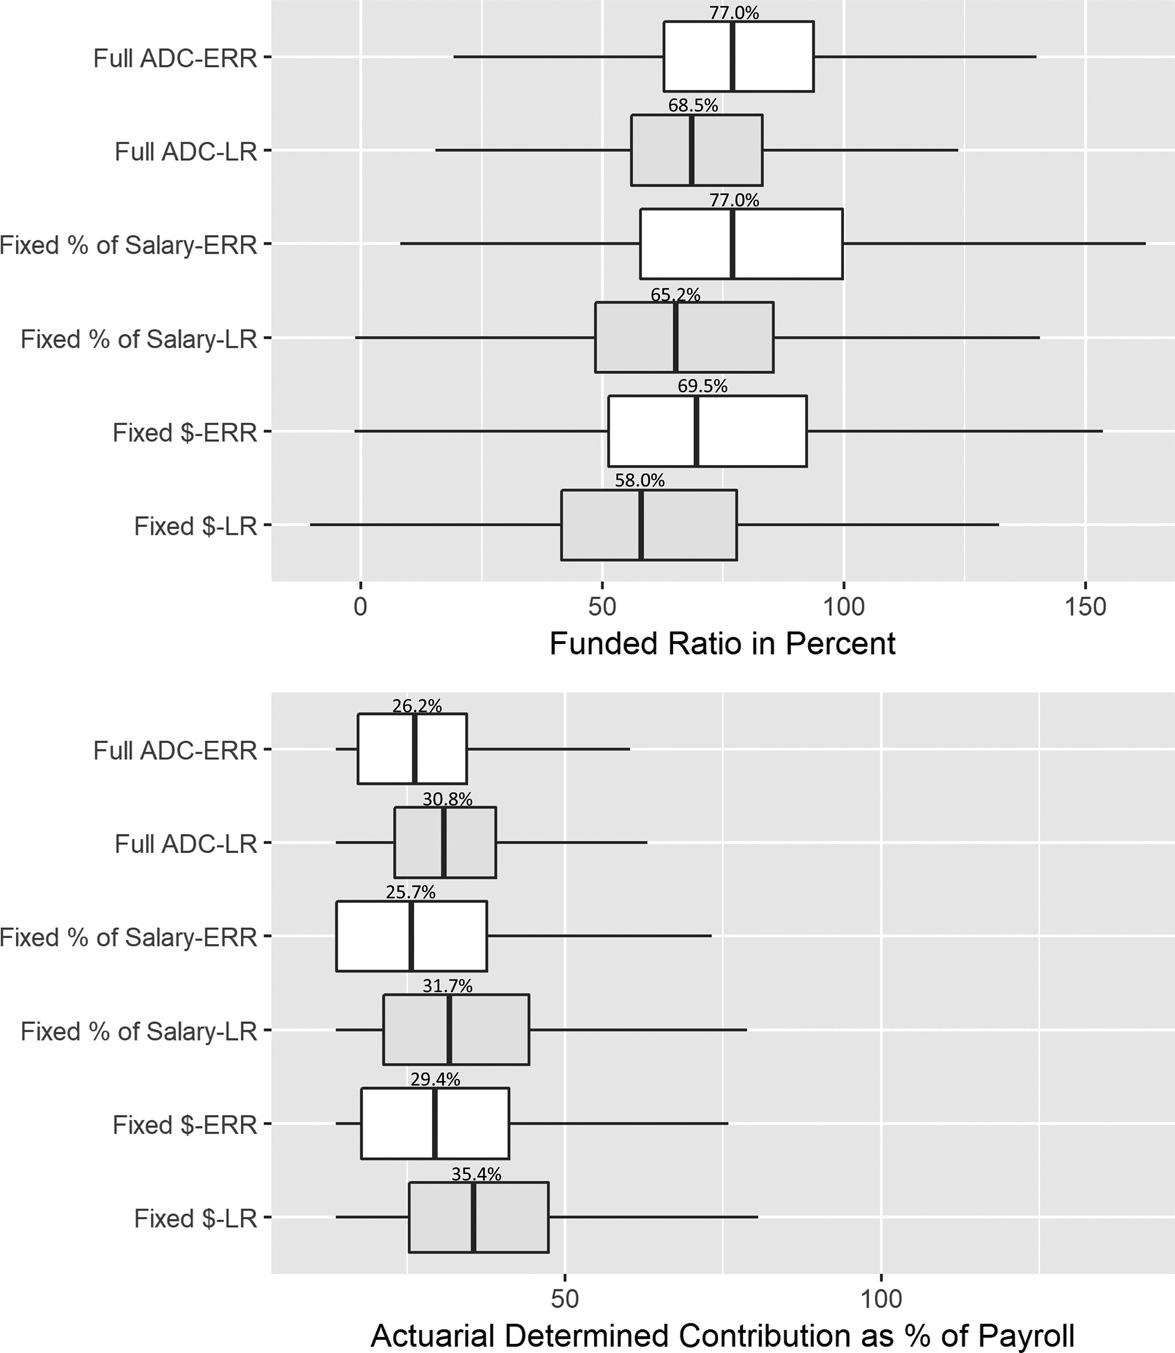
Funded ratio and ADC under different contribution policies.
Note: The figures present the simulated funded ratio in percent and actuarial determined contribution as percent of payroll under different contribution policies – fully pay ADC (Full ADC), fixed percent (Fixed % of Salary; 25% of salary), and fixed amount (Fixed $; equal to the ADC value at the beginning of the simulation period). ERR stands for the expected-rate-of-return scenario and the LR indicates the low-return environment scenario. The vertical line in the center of each boxplot indicates the median value. The rectangular boxes indicate the interquartile ranges (IQR), from the first quartile to the third. The horizontal lines extending from the boxes are equal to 1.5 × IQR below the first quartile and above the third quartile.

We present boxplot graphs in Figures 2–4 to illustrate the distribution of simulated results. The central vertical line in the boxplot shows the median of the simulation results. The rectangle box shows the interquartile range (IQR) from the first quartile (the left side of the box) to the third quartile (the right side of the box). The horizontal line shows 1.5 × IQR below the first quartile and 1.5 × IQR above the third quartile. In the discussion of the results, we compare the median values under different policies and use IQR to describe the variation of the results under each policy condition.
Figure 2 shows the funded ratio and ADC under different investment strategies. For comparison, ‘ERR’ (the expected rate of return) is the scenario when the mean return is set to 7.5% and the standard deviation is set to 11%. This scenario represents the distribution of potential funded ratios and ADCs if a low-return environment is not experienced. In the other three scenarios, where the boxes are filled in grey, we use the low-return (‘LR’) capital market assumptions discussed above and assume that the hypothetical plan takes either a high-risk (60.4% in equities), medium-risk (47.9% in equities), or low-risk (35.2% in equities) investment strategy. The upper and lower graphs in Figure 1 show the results for the funded ratio and ADC calculations, respectively.
In the ERR scenario, the median funded ratio is likely to reach 74.9%, and median ADC is likely to reach 27% of the payroll at the end of year 10. Note that these distributions and moments include all the permutations of contribution policies and amortization practices. This result demonstrates that even when the investment scenario turns out the same as most pension systems expect, our simulation still shows that the typical pension plan will have a funded ratio that is less than the sufficient ratio suggested by the Government Accountability Office (2007). Also, the ADC is likely to double the size of the initial normal cost. The insufficient funding ratio and the high amortization cost in ADC are due to the volatility in asset growth and the process of amortizing unfunded liabilities to future years.
Under the LR scenarios, the median funded ratio decreases between 63% and 65%, and median ADC increases to around 32% of payroll at the end of year 10. The investment strategies pension systems may adopt, regardless of the risk level, only make minimal differences in the simulated median funded ratios and ADCs, though the range is larger for the high risk scenario. In other words, the choice of investment strategies has a minimal effect on the typical plan performance in a low-return environment, providing a questionable return on the added risk of higher risk scenarios. This is possibly due to the decrease of returns across most, if not all, asset classes.
Figure 3 shows the funded ratios and ADC under different amortization policies. We compare three amortization policies: aggressive, moderate, and conservative. Aggressive amortization (15 years, closed, level dollar) aims to pay down UAAL sooner; conservative amortization (30 years, open, level percent) aims to postpone UAAL to the future; and moderate (20 years, closed, level percent) falls somewhere in between. We compare these three amortization policies under ERR (shown in white-filled boxplot) and LR scenarios (shown in grey-filled boxplots). The upper graph in Figure 3 shows the simulated funded ratio, and the lower graph shows ADC, both at the end of year 10.
Figure 3 shows that the low-return environment will reduce the median funded ratio in year 10 by about 10% regardless of which amortization policy the pension plan uses. In terms of ADC, pension plans with aggressive amortization policy will experience more significant impact under the low-return environment than plans using other amortization policies because aggressive amortization intends to pay off UAAL within 15 years when the investment environment happens to experience low returns. With conservative amortization, most unfunded liabilities are postponed to future years, when high returns are still assumed. Figure 3 also shows the tradeoff between keeping up the funded ratio and reducing the ADC. Using aggressive amortization, the median funded ratio reaches 81.9% under the ERR scenario and 71.2% in the low-return scenario, but the median ADC increases to 38.7% of payroll under the ERR scenario and 52.4% in the low-return scenario. Aggressive amortization also leads to a greater variation (IQR) in possible ADC's at the end of year 10.
Figure 4 shows the simulated funded ratios and ADC under different contribution policies: fully pay ADC, fixed amount, or fixed percent. Fully paying the ADC amount suggested by the actuary will make sure that pension plans cover their normal cost and UAAL cost. As mentioned above, although the ADC is always calculated, some pension plans do not pay their full ADC. Instead, they may pay a fixed dollar amount or a fixed percent of payroll, in order to stabilize pension contributions across years. We set the fixed amount to be equal to the ADC value at the beginning of the simulation period – there are six possible values depending on the amortization period (15, 20, or 30 years) and the amortization approach (level dollar or level percent of salary). We set the fixed percent to be 25% of payroll. Regardless of the contribution policy, we calculate the ADC for each run and present the distribution of results in Figure 4 for comparison.
The results presented in Figure 4 show that fully paying ADC is effective to increase the funded ratio, reduce the ADC, and lower the variation of possible results. Comparing the ERR and LR scenarios, plans that fully pay their ADC will experience less impact (a decrease of 8.5% in the median funded ratio and an increase of 4.6% in the median ADC) whereas pension plans with fixed percent or fixed dollar contribution will likely be affected more by the low-return environment.
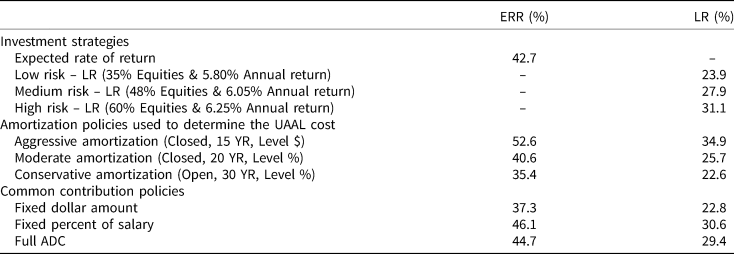
In Table 2, we show the probability of a plan reaching the 80% funded ratio at the end of year 10 under the different policy approaches discussed above. We choose the 80% funded ratio as the benchmark because many pension researchers and observers consider 80% as an adequate funding levelFootnote 11, although other observers, such as American Academy of Actuaries (2012) and Government Finance Officers Association (2016), disagree and suggest that 100% or more should be the target funded ratio. Table 2 shows that, compared to the ERR scenario, in the low-return environment, the probability of reaching the 80% funded ratio decreases by more than 10%. High-risk investment, aggressive amortization, and a fixed-percent contribution will lead to the highest probability of solvency. On the other end, low-risk investment, conservative amortization, and fixed-amount ADC will make it less likely to achieve sufficient funding.
Probability of the funded ratio reaching 80% under different policies

Note: This table presents the probability of the funded ratio reaching 80% under different investment strategies, amortization policy, and contribution policies. ERR stands for the expected-rate-of-return scenario and the LR indicates the low-return environment scenario.
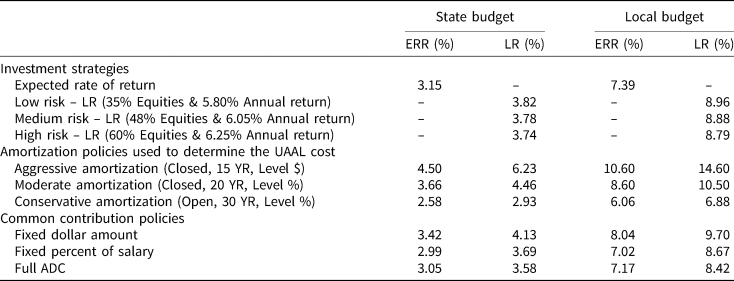
In Table 3, we compare the simulated ADC at the end of year 10 with a typical state government budget and typical local government budget. We estimate the size of state and local budgets by using the US Census data on government payrolls and total revenues.Footnote 12 The estimates of ADC as a percent of local budgets are much larger than state budgets because payrolls tend to be a much larger portion of local government budgets. Table 3 shows that, in the ERR scenario, the median ADC at the end of year 10 will be 3.15% of a state budget or 7.39% of a local budget. Under a low-return environment, the median ADC will increase by around 0.6% of the state budget or 1.5% of the local budget. Given the large size of state budgets (most are well over $10 billion), a 0.6% increase in the ADC represents diverting as much as $100–200 million in state resources to pension contributions – even approaching $1 billion in the states with the largest budgets. Governments can reduce the impact of a low-return environment on ADC by using high-risk investment, conservative amortization, and fully paying ADC.
ADC as percent of state and local budgets

Note: This table presents the simulated ADC as percent of state and local government budgets under different investment strategies, amortization policy, and contribution policies. State and local budgets are calculated as dividing pension system's total payroll by the median ratio of total payroll to total revenues of state and local governments, respectively. ERR stands for the expected-rate-of-return scenario and the LR indicates the low-return environment scenario.
4. Conclusion
In this research, we build a typical public pension plan and simulate its assets, liabilities, and contribution requirements over a 10 year horizon. Using capital market assumptions produced by investment experts, we assume that the future long-term rate of return is lower than the typical pension plan's assumed rate of return. We then calculate this plan's funded ratios and ADC in the low-return environment according to different investment strategies, amortization policies, and contribution policies. We also simulate the probability of the plan's funded ratio reaching above 80% in different policy scenarios and compare this plan's ADC with an average state or local budget as a way to examine the budgetary implications.
If the investment returns in the next 10 years turn out to be the same as the expected rate of return (7.5%), our simulation shows that the median funded ratio of a public plan (i.e., 80% funded with a medium-risk investment strategy) will reach 74.9% and its median ADC will reach 27% of payroll at the end of year 10. There is 42.7% probability that the typical public plan will achieve the 80% funding status. The current funding policies will not be able to bring public pension systems to full funding, which is due to the long amortization period and asset smoothing that many systems use to reduce contribution volatility but postpone unfunded liabilities to the future.
In the 10-year low-return environment, a public plan will reach a median funded ratio of 64.5% and increase its median ADC to 32.4% of the payroll at the end of year 10. There is only a 27.9% probability for that pension system to reach the 80% funded ratio, and the size of the required contribution is compared to 3.78% of a typical state budget and 8.88% of a typical local budget.
Based on the simulation, several policy recommendations can be made in response to the low-return environment. For investment policies, we show that using different investment strategies will not make a significant difference in the median value of possible results because returns are expected to be low in all asset classes. Our simulation shows that high-risk investment will perform marginally better in a low-return environment, with a highest probability (31.1%) of reaching 80% funded ratio and lowest ADC compared to the other two investment policies with lower risks. However, the variation of the results is greater for systems with a high-risk investment strategy. Besides, pension systems with high risks will experience substantial losses during downturn years, which is what the system administrators want to avoid. High risks will also bring in high volatility in contributions and possibly high investment fees. For systems with high risks, it is important to adopt appropriate risk management tools to assess, disclose, and mitigate their risks.
For amortization policies, plans have to consider the tradeoff between long-term solvency and short-term budgetary burdens. Plans could use conservative amortization policy to lower ADC, but the risk of being underfunded will substantially increase. For the purpose of maintaining the long-term solvency, aggressive amortization policy is recommended, but when to adopt aggressive amortization depends on whether the plan sponsors are ready to increase their contributions. Our simulation also shows a plan that uses aggressive amortization will experience a more significant impact from the low-return environment than plans using conservative amortization policies. This is because the aggressive amortization policy intends to pay off the unfunded liability in 15-years, when the actual returns are different than expected in the next 10 years. With conservative amortization, the impact of low returns in the next 10 years is alleviated over a longer time if returns are better in the later years.
Regarding contribution policies, fully paying ADC is still the best way to keep up the funded ratio and reduce the ADC. Fixed percent or fixed dollar contributions provide more stable contributions, but costs and liabilities will increase in the long term, especially in the low-return environment. We suggest that at least the contribution amount should be adjusted according to ADC in order to maintain the long-term solvency of the pension plan.
The goal of this study is to establish a simulation model for analysis of how investment environment affects pension performance when different pension policies are used. To achieve this goal, we use some simplifications to construct a typical pension plan. The simulation results only represent the outcomes for a plan with median characteristics. In addition, to better present the key findings, we simplify the possible interactions among investment, amortization, and contribution policies. Simplifications might constrain the generalization of the findings. Besides, our simulation does not directly reflect the practices of specific pension plans.
The results offer important implications for future studies and practices in public pension management. First, low-return environment happens, although we do not know when. Pension systems should expect future low returns and analyze the risks that they are taking if low returns occur. Risk management and reporting are important aspects of public pension management. Second, by recognizing the risks associated with possible low returns, pension systems can develop strategies to mitigate risks. Strategies to mitigate the investment risk include redesigning investment strategies, which might come at the cost of lower returns. Strategies to mitigate the contribution risk include setting up reserve funds for pension contributions. Third, risks can also be shared with employees. Introducing defined contribution features to the plans (Liljenquist, Reference Liljenquist2013) or developing contingent benefits (Miller, Reference Miller2012) are ways to share the risks. The above options to manage, reduce, and share the risks of expected future low returns can be studied and incorporated into future pension system reforms.
Appendix A–Asset class return assumptions

Appendix B–Asset class correlation assumptions