I. INTRODUCTION
Applications of piezoelectric materials in sensors, actuators, transducers, and energy harvesting are constantly growing.Reference Dong, Scott and Wu1,Reference Anton and Sodano2 One of the key examples is lead zirconium titanateReference Chang, Dommer, Chang and Lin3 which is found in both bulk and thin film shapes.Reference Wang and Santiago-Aviles4,Reference Jaffe, Cook and Jaffe5 However, due to the brittleness and stiffness of ceramics, bulk and thin film forms of PZT do not lend themselves easily to flexible applications. On the other hand, nanofibers may offer substantial decrease in device dimensions and better tolerance to bending stresses, thus facilitating applications involving mechanical perturbations.Reference Chang, Dommer, Chang and Lin3,Reference Chen, Xu, Yao and Shi6,Reference Xu, Shi and Kim7
Electrospinning is an attractive method for preparation of nanofibers due to its low cost, simplicity, and flexibility. The method is well established industrially for polymer fibers, but less so for ceramic fibers in general and for PZT fibers in particular. The spinning parameters, such as electric field and solution viscosity, are of great importance for preparation of fibers with desired morphology.Reference Angammana and Jayaram8–Reference Ramakrishna, Fujihara, Teo, Lim and Ma10 The effects of solvent/polymer concentrations and thermal treatment on PZT fiber diameter were described in various recent publicationsReference Wang and Santiago-Aviles4,Reference Alkoy Mensur, Dagdeviren and Papila11–Reference Lee Yong, Park, Lee, Kang, Oh and Cho13 ; however, the interplay between the electric field and fiber morphology has not yet been reported.
One of the interesting effects observed in electrospinning of high viscosity solutions is branching, where secondary fibers are ejected from a primary, larger fiber. This effect gives rise to a multimodal fiber diameter distribution. Control over this phenomenon is of great importance when specific diameter distribution mode is desired. The most comprehensive work on branching theory and experiments were done by Yarin et al.Reference Yarin, Kataphinan and Reneker14 The branching effect has been demonstrated mostly on polymer fibersReference Zargarian and Haddadi-Asl15–Reference Deitzel, Kleinmeyer, Hirvonen and Beck Tan17 by changing the voltage at a constant tip to collector distance (TCD), thus the charge and the electric field in the above work were changed simultaneously. None of the published papers demonstrate how branching is affected by changing the electric field at a constant potential under which conditions the charge on the fiber is maintained at a nearly constant level. Therefore, the previous reports cannot separate the effect of electric field on branching from the effect of the surface charge on the fiber.
In this work, we mapped the fiber diameter as a function of the electric field by changing the high voltage (HV) potential and the TCD at different precursor concentrations, thereby decoupling the two effects. We show that without changing the surface charge the branching effect can be induced via the external electric field.
II. EXPERIMENTAL
The main equipment for spinning included a HV supply up to 40 kV (SL40PN60/10003; Spellman Corporate, Hauppage, NY), a standard syringe pump and needle (internal diameter 0.6 mm) for the spinneret electrode, an aluminum disk (20 cm in diameter) for the collecting electrode. Sol viscosity was measured using a spindle viscometer (Brookfield Digital Viscometer, model DV-II, Middleboro, MA). Fiber morphology was studied using a high resolution scanning electron microscope (HRSEM; ULTRA plus, Zeiss, Zurich, Switzerland) after deposition directly on silicon wafers attached to the aluminum collector. This mode of collection was used to facilitate the thermal treatment and microscopic characterization without removal from the substrate. Sintering of the collected fiber mats was done with CM Rapid Temperature Furnace (Bloomfield, NJ) in air.
The chemicals used included titanium (IV) isopropoxide (98%), zirconium (IV) n-propoxide (72–77%) in 1-propanol, lead bis(2-ethylhexanoate) (41.7% Pb) from Strem Chemicals, Inc., Newburyport, MA, and polyvinylpyrrolidone (PVP, Mw = 1,300,000, Alfa Aesar) were used to prepare precursor of PZT. The solvents were ethanol absolute (Carlo Erba Reagents) and glacial acetic acid (Gadot).
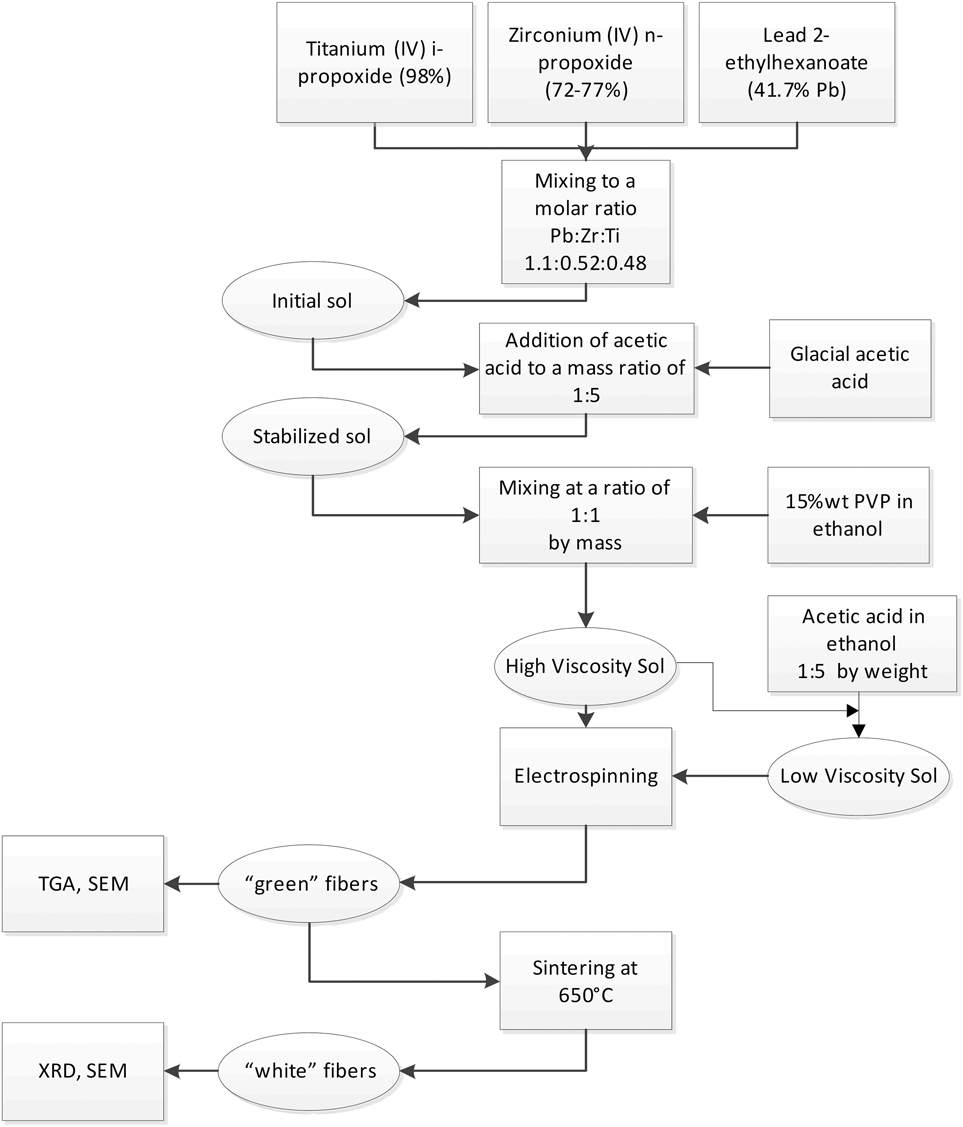
The sol precursor preparation is presented in Fig. 1 and Table I. The metal precursor–polymer–solvent system used in preparation of the sol is different from published reports on electrospinning of PZT fibers. Typically, Ti and Zr alkoxides are mixed with lead acetate trihydrate with addition of a polymer dissolved in alcoholic solvent.Reference Alkoy Mensur, Dagdeviren and Papila11,Reference Dharmaraj, Kim and Kim18–Reference Khajelakzay and Taheri-Nassaj20 We specifically used the lead bis(2-ethylhexanoate) to avoid adding water to the system, which degrades the stability of the sol causing precipitation and gelation. The use of two solvents in the sol also affects the drying rate and mechanism as shown elsewhere.Reference Etin, Shter, Gelman and Grader21,Reference Fuks, Shter, Mann-Lahav and Grader22 The above unique combination reported herein provided the desired stability, viscosity, and drying rate during electrospinning.
General flow chart for preparation and characterization of PZT nanofibers.

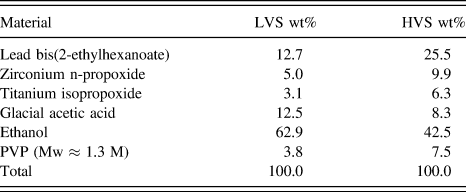
The composition of the LVSs and HVSs.
The procedure included mixing of initial metal-organic components, addition of glacial acetic acid, and mixing with ethanol solution of PVP. Lead bis(2-ethylhexanoate) was added to reach 10% molar PbO excess to account for losses during sintering procedure due to the high volatility of its oxides. This effect is expected to be more severe in fibers than in films or bulk due to the higher surface to volume ratio. Glacial acetic acid was added to stabilize the sol before further processing. All the operations shown in Fig. 1 prior to electrospinning are conducted under dry nitrogen atmosphere in a glove box.
The obtained precursor is used in electrospinning in two forms: a high viscosity sol (called HVS) and a low viscosity sol (called LVS). The composition of the low and high viscosity sols is shown in Table I. Fibers obtained after electrospinning were dried, heated at 1 °C/min to 650 °C, and sintered for 30–120 min.
Phase evolution was studied by x-ray diffraction (XRD; Diffractometer D5000; Siemens, Munich, Germany). Thermal analysis was conducted with simultaneous thermogravimetric (TGA) and differential thermal analysis (DTA) (TG-92; Setaram, Caluire, France) with a heating rate of 5 °C min−1 up to 600 °C in air.
The diameter of sintered fibers was measured by image analysis of HRSEM micrographs of fibers deposited on silicon wafers. The fiber diameter distribution was calculated by statistical analysis of at least 30 data points at each experimental condition.
III. RESULTS AND DISCUSSION
A. Effect of precursor dilution on the fiber drying and morphology
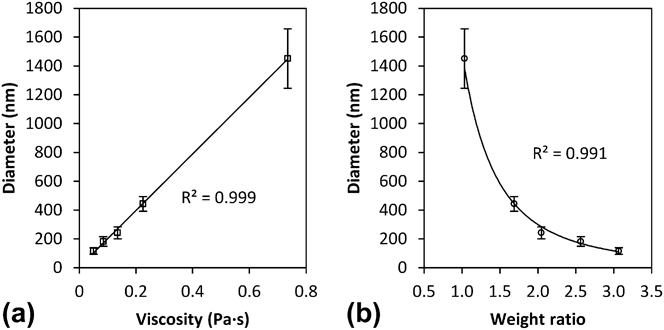
As previously demonstrated,Reference Ki, Baek, Gang, Lee, Um and Park23–Reference Zhao, Li, Yuan, Li, Zhang and Sheng27 the viscosity of the precursor significantly influences the fiber diameter: in general, increasing of viscosity leads to larger diameters. In this work, we diluted the sol with a mixture of ethanol and acetic acid in a 5:1 ratio. This ratio is similar to the ratio of solvents in the precursor before dilution. The viscosity was set to the 0.12–0.8 Pa s range, strongly influencing the diameters of the fibers as shown in Fig. 2(a). Low and high sol viscosities yielded sintered fibers with diameters of ∼100 nm and 1400 nm, respectively. The effect of weight ratio of solvent to nonsolvent components in the precursor sol on the sintered fiber diameter is presented in Fig. 2(b).
Dependence of sintered fibers' diameters on (a) the viscosity and (b) the weight ratio (%) of solvent to nonsolvent components in the precursor solution. The spinning parameters were: potential 13.8 kV, distance 15 cm, feed 0.5 mL h-1.
This dependence is matched with power-law curves typical for polymer solutions.Reference Deitzel, Kleinmeyer, Harris and Beck Tan28 Further dilution of precursor beyond a ratio of 3 leads to unstable electrospinning giving rise to spraying. The results are in good agreement with earlier publications on this effect.Reference Ki, Baek, Gang, Lee, Um and Park23–Reference Zhao, Li, Yuan, Li, Zhang and Sheng27,Reference Thompson, Chase, Yarin and Reneker29
B. Drying model
Sufficient drying is important to prevent fiber's coalescence upon deposition on the collector, and for maintaining the fiber's uniform cross section. A model developed by Wu et al.Reference Wu, Salkovskiy and Dzenis30 for drying of polymeric fibers during electrospinning was used here to compare drying rate of fibers prepared from low and high viscosity sols. The model assumes (a) no temperature gradients, (b) axisymmetric mass transfer, (c) no chemical reactions, (d) no additional stretching during drying. The last assumption is an approximation not stated in the work of Wu et al.Reference Wu, Salkovskiy and Dzenis30 This approximation can be rationalized by the fact that the stretching of the fibers due to the repelling forces of the surface charges is initially much faster than the drying. These trends occur since the initial charge density is at a maximum while the surface area (and hence the drying) is at a minimum. The stretching rapidly decreases while evaporation rate is greatly increased due to the high surface area. Clearly, the separation of the stretching and drying stages greatly simplifies the model and calculations.
The partial differential equation [Eq. (1)] describes the concentration change in time at each point.
 $${\left( {{{\partial C} \over {\partial t}}} \right)_{i}} = {{D{{\bar V}_1}} \over {1 - {{\bar V}_1}C}}\left( {{{\partial C} \over {\partial r}}} \right)_{i}^{2} + {1 \over r}{\partial \over {\partial r}}{\left( {Dr{{\partial C} \over {\partial r}}} \right)_{r}}\quad {\rm{.}}$$
The initial conditions include solvent concentration, C 0, and fiber radius, R 0, at t = 0. The boundary conditions are the condition of axial symmetry at r = 0 [Eq. (2)], the solvent evaporation flux to the surrounding equals its diffusion rate to the fiber surface [Eq. (3)], and the mass balance condition is that the radius shrinkage equals the volume loss as a result of solvent evaporation [Eq. (4)].
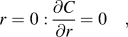 $$r = 0:{{\partial C} \over {\partial r}} = 0\quad {\rm{,}}$$
 $$r = R\left( t \right):{D \over {1 - {{\bar V}_1}C}}{{\partial C} \over {\partial r}} = - {{{k_{\rm{g}}}{M_1}\left( {{P_{\rm{s}}} - {P_\infty }} \right)} \over {{R_{\rm{g}}}T}}\quad {\rm{,}}$$
 $$r = R\left( t \right):{{{\mathop{\rm d}\nolimits} R\left( t \right)} \over {{\mathop{\rm d}\nolimits} t}} = - {{{k_{\rm{g}}}{M_1}{{\bar V}_1}\left( {{P_{\rm{s}}} - {P_\infty }} \right)} \over {{R_{\rm{g}}}T}}\quad {\rm{,}}$$
Where C – solvent concentration (g/cm3), D – polymer/solvent mutual diffusivity (cm2/s),  ${\bar V_1}$ – specific volume (cm3/g), r – radius (cm), C 0 – initial solvent concentration (g/cm3), k g – solvent mass transfer coefficient at the fiber surface, R 0 – total initial fiber radius (cm), R(t) – total radius of the fiber as a function of time (cm), R g – gas constant (J/mol K), T – absolute temperature (K), P s – equivalent solvent pressure on the fiber surface (Pa),
 ${P_\infty }$ – solvent pressure far from the fiber, M 1 – solvents average molecular weight (g/mol), t – time (s).
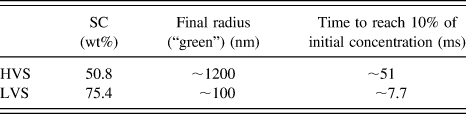
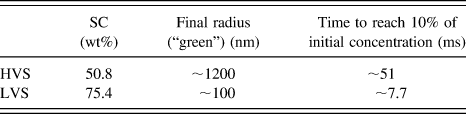
The results of simulation are shown in Figs. 3(a) and 3(b) where the solvent content (SC) in the fibers (g/cm3) versus their radius was calculated for different drying times. The initial (t = 0 s) SC was 51 and 75 wt% for HVS and LVS, respectively. The radius of the dried fibers (at SC = 0) was calculated based on the solid content (PZT components and the polymer). These values matched the radii of the “green” fibers inferred from the radii of the sintered fibers (Fig. 2) using the experimentally found diameter shrinkage of 43%.
Calculated concentration profiles of solvent in fibers at different times as a function of the radius: (a) HVS, (b) LVS. The dried diameters match the experimentally found sintered diameters and the 43% shrinkage in diameter during sintering.
The final results of these calculations are shown in Fig. 4, where the time for complete fiber drying is compared at log–log plot. The results are summarized in Table II. As can be seen, even though the LVS has considerably more solvent than the HVS, the calculated drying time is dramatically shorter for LVS than the HVS. The simulation of drying proves that despite higher amount of solvents in the LVS, the dramatic reduction in radius due to the much larger initial stretching allows faster solvent evaporation as a result of much greater increase in surface to volume ratio in the thinner fibers.
Comparison of the “green” diameter versus drying time of high and low viscosity sols.
Summarized results of drying simulation at different solvent concentrations.
C. Thermal behavior and phase evolution
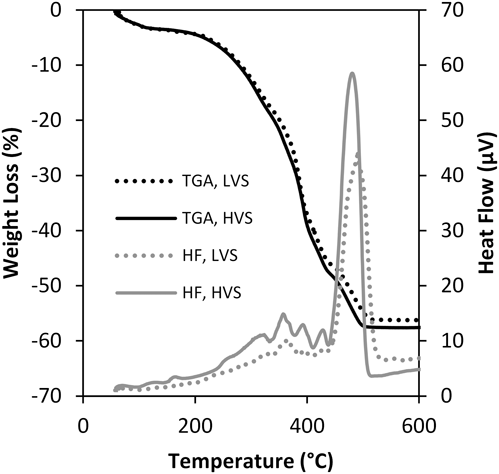
To develop an optimal thermal treatment procedure, including organic burnout and sintering, the thermal behavior and phase evolution at elevated temperature were analyzed. The dry green fibers were tested using simultaneous thermal gravimetric and differential thermal analysis in flowing air. Typical results are shown in Fig. 5. The initial mass loss of ∼4.5% in the range of RT–200 °C is mostly due to residual solvents evaporation. Polymer and propoxides oxidative decomposition starts above 200 °C and continues up to 450 °C along with small exothermic peaks. These effects are due to overlapping endothermic decomposition and exothermic oxidation processes. A strong exothermic peak at 450 °C is due to complete oxidation of the heavy organics and carbon residues. At this stage, about 20% organics from initial weight burn out. There is no significant difference between the thermal behavior of mats obtained from LVS and HVS. The total mass loss of about 58% is consistent with theoretical calculation based on initial composition.
TGA/DTA in air of “green” fibers obtained from HVS and LVS.
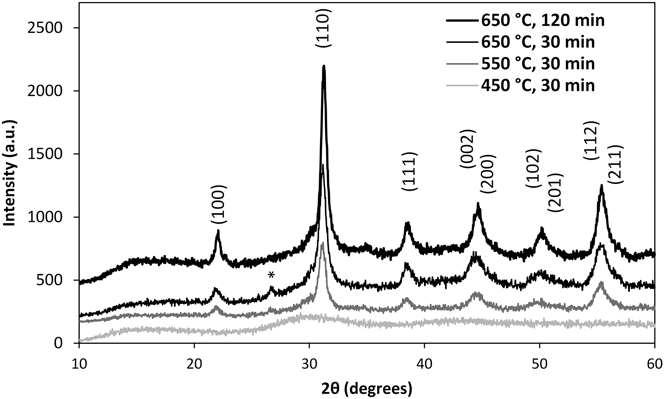
Phase evolution of PZT was investigated using patterns of x-ray diffractions for samples heated at a rate of 60 °C/h to 3 different temperatures with soak time of 0.5 and 2 h. These temperatures were selected from the thermogram as shown in Fig. 5: at 450 °C, 550 °C, and 650 °C, before and after the main exothermic peak. At the highest temperature, the organics burnout is completed. After 2 h at 650 °C, the only peaks detected are due to randomly oriented PZT phase. The small unresolved peak at 2θ ∼ 27°–28° may be due to the excess lead in the sample or to pyrochlore which were observed elsewhere.Reference Etin, Shter, Grader and Reisner31 As can be seen in Fig. 6, this phase disappears after 2 h of sintering, consistent with PbO evaporation.
XRD of fibers obtained for different sintering temperatures and times in air. The (*) denotes unresolved peak due to PbO or pyrochlore phases that disappear after the prolonged sintering.
D. Voltage effect on fiber diameter
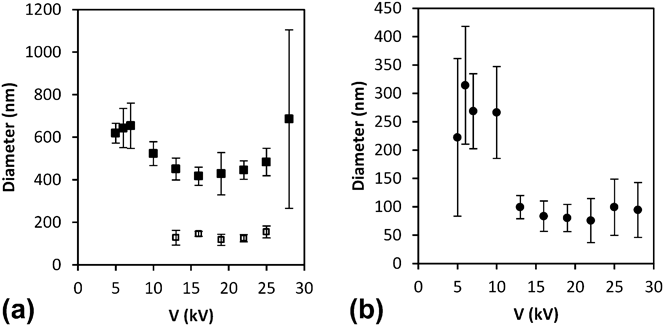
The effect of applied potential on the sintered fiber diameter was studied for HVS and LVS PZT precursor's solutions. While changing the voltage, a TCD of 16 cm and a feed rate of 0.5 mL h−1 were kept constant. The data from the two solutions are shown in Figs. 7(a) and 7(b). The results for the HVS [Fig. 7(a)] can be divided into 3 distinct regions: (1) below a potential of 10 kV, a single mode of large fiber diameter distribution is obtained and no clear trend of voltage influence on diameters is observed; (2) in a range from 13 to 25 kV, a bimodal diameter distribution is observed – the sintered diameter of large fibers is reduced from ∼650 to 450 nm, while the average diameter of the small fibers is about 125 nm; (3) at high potentials (>25 kV), fibers with a random and wide distribution of diameters were obtained [Fig. 8(c)]. When a bimodal distribution is obtained (in region 2), the diameters of both thin and thick fibers' populations are nearly constant within the standard deviation of the data. The bimodal distribution can be associated with the removal of the excess surface charge by a branching mechanism,Reference Yarin, Kataphinan and Reneker14 leaving a similar amount of charge on the main fiber at different potentials in the range of 13–25 kV.
Dependence of sintered fibers' diameters on the applied voltage: (a) HVS, filled squares – average diameter of the thick fiber population, empty squares – average diameter of the thin fiber population; (b) LVS. The TCD was 16 cm and sol feed rate was 0.5 mL h−1.
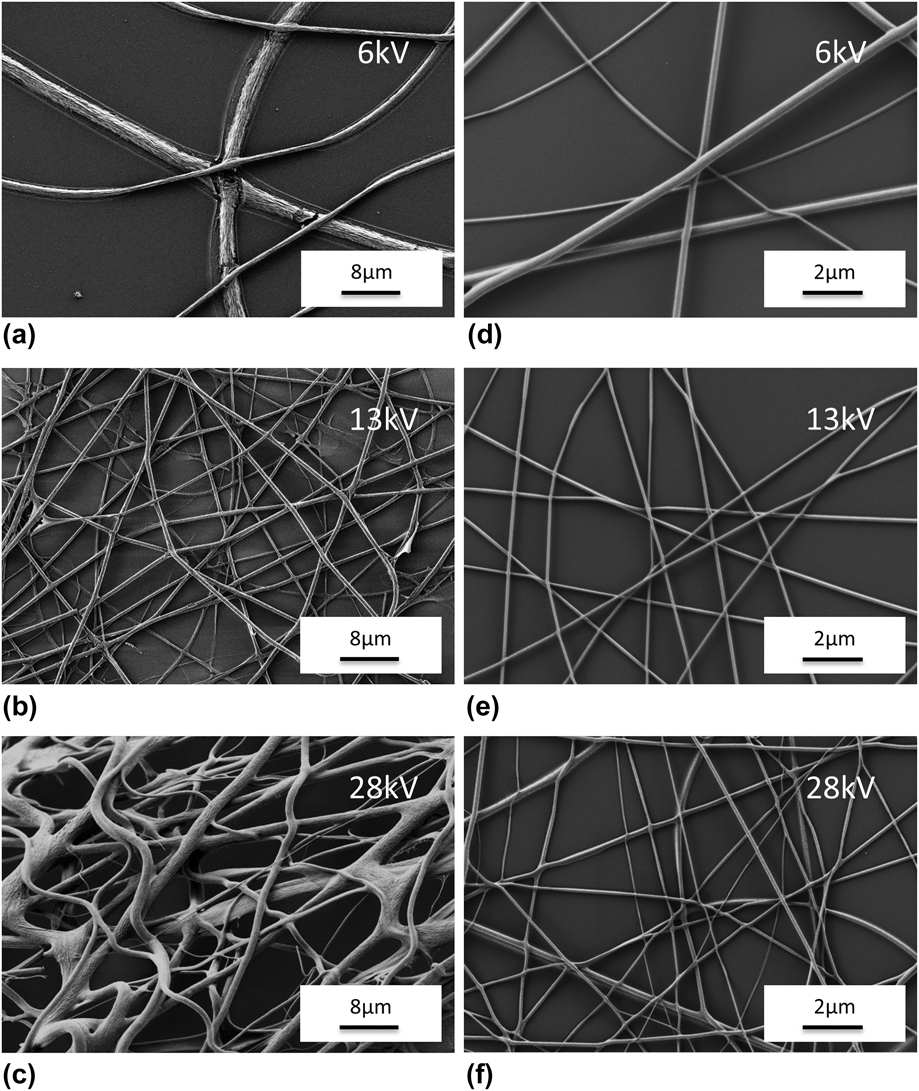
HRSEM pictures of sintered fibers obtained at low, medium, and high voltage regions (6, 13, 28 kV) for HVSs (a, b, c) and LVSs (d, e, f) at TCD = 16 cm.
The results with a LVS [Fig. 7(b)] can be divided into two main regions: (1) at low potentials below 13 kV, fibers with a large average diameter and a wide distribution are obtained regardless of the voltage; (2) at a high potential of 13–28 kV, fibers with small diameters and a narrow size distribution were obtained also independent of voltage. The main findings in the LVS case are that a single mode of fiber diameter was observed in the whole investigated voltage range and that the sharp transition in diameter occurs at the exact same voltage as in the HVS case. The constant diameter in the second region may be explained by the interplay of two parameters: the flight time to the collector and the surface charge on the fiber. On the one hand, the increased voltage gives rise to a larger surface charge that is expected to induce more stretching of the fiber (to reduce the surface charge density). On the other hand, the larger electric field increases the velocity of the fibers toward the collector. The net effect is that the fibers reach the collector before they are fully stretched and hence the final fiber diameter remains constant in this region. As can be seen in Figs. 8(d)–8(f), the surface of fibers from LVS is much smoother while their diameters are considerably smaller than the HVS analog shown in Figs. 8(a)–8(c).
Another important feature shown in Fig. 8 is the shape of junction points between intersecting fibers. In the fibers made from an HVS at a low potential of 6 kV [Fig. 8(a)], the junction points are fused and show a large contact area with cracks. In contrast, the junction points of fibers made from the LVS [Fig. 8(d)] are not as tightly bonded and do not show any cracks. In the medium potential region [Figs. 8(b) and 8(e)], the diameters are much smaller and also no obvious breaks at junction points are observed in both solutions. In the HVS, we obtain two distinct groups of fibers with different diameters, however, the fibers of the LVS show a very narrow size distribution. As discussed earlier (Fig. 7), at the highest potential of 28 kV [Figs. 8(c) and 8(f)], the spinning becomes very unstable causing a wide distribution of diameters in both cases.
E. Effect of TCD on fiber's diameter and morphology
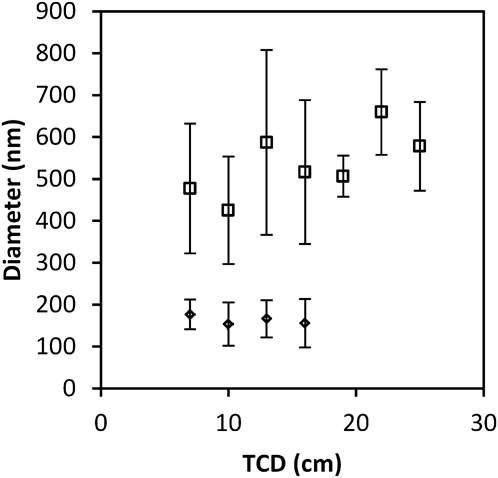
The TCD was varied between 7 and 25 cm while keeping the voltage on spinneret at 13.8 kV and the feed rate at 0.5 mL h−1. In these experiments, we observed a bimodal population of fibers with average diameters of ∼540 nm and 160 nm, respectively. As can be seen in Fig. 9, the TCD has relatively small influence on the diameter of two PZT fiber populations as was previously observed in polyvinyl alcohol (PVA)Reference Zhang, Yuan, Wu, Han and Sheng32 and other polymer solutions.Reference Chowdhury and Stylios9,Reference Ki, Baek, Gang, Lee, Um and Park23 The statistical analysis of the two fibers populations shows that the standard deviation (SD) of the thick fibers is larger and more erratic than the corresponding SD of the smaller fibers. In addition, Fig. 9 shows that above a TCD of 16 cm only the larger fiber diameter mode is observed. The bimodal distribution behavior was reported previously for many polymer solutions.Reference Zargarian and Haddadi-Asl15,Reference Demir, Yilgor and Erman24,Reference Henriques, Vidinha, Botequim, Borges and Silva25,Reference Deitzel, Kleinmeyer, Harris and Beck Tan28,Reference Frenot and Chronakis33 It was found that bi- and even tri-modal distribution may be observed in high viscosity solutions. The bimodal effect is observed here for PZT fibers for the first time. The segregation of diameter distribution is primarily associated with splaying or branching effect that results from formation of secondary fibers which carry the excess surface charge of the jet.Reference Yarin, Kataphinan and Reneker14,Reference Koombhongse, Liu and Reneker16
Distribution analysis of sintered fibers' diameters obtained at different TCDs at a potential of 13.8 kV.
F. Effect of electric field
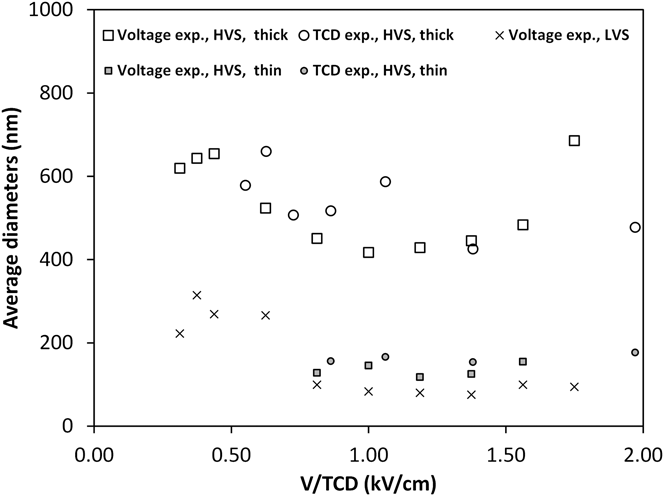
To normalize the effect of the TCD and voltage changes on the fiber diameter, the electric field between the needle and the collector plate, V/TCD,Reference Yarin, Kataphinan and Reneker14,Reference Zhou, Wu, Gao, Jiang, Zhao and Fong34 was calculated and shown in Fig. 10. The field is set either by changing the voltage at a constant distance of 16 cm (squares for HVS and x for LVS), or by changing the TCD at a constant voltage of 16 kV (circles). In general, both TCD and voltage experiments described previously follow the same pattern when the data are normalized. Below an electric field of 0.8 V/cm, only large fibers are found. In this region, increasing the electric field of HVS reduces the fiber diameter from about 650 to 450 nm. The corresponding diameter of fibers from the LVS sol is reduced from 275 to 90 nm. In the electric field range of 0.8–1.6 V/cm, two fiber modes are observed (in the HVS) but the average diameters in either small or large mode are relatively stable in both types of experiments. Above an electric field of 1.6 kV/cm, increasing the voltage causes a significant rise in the fiber diameter due to unstable spinning operation mentioned earlier. As can be seen in Fig. 9, the variation in electric field does not have any effect on the average diameter of the small fiber population.
The average sintered fiber diameter versus the electric field. Squares and circles denote voltage and TCD variations in HVSs. Open and filled shapes mark the thick and thin fiber fractions in HVS. The x represents the LVS.
According to the study by Yarin et al.,Reference Yarin, Kataphinan and Reneker14 the branching is related to the formation of ripples on the fiber surface. The high curvature of the surface is promoted by the electric field created by the surface charge and allows formation of the secondary fibers. This effect had been demonstrated on polymer fibers.Reference Reneker and Yarin35 The above work was done by changing the voltage (hence the surface charge) and therefore, the charge and external electric field are not decoupled. Thus, it is not clear whether the branching effect is due to the charge on the fiber surface only or due to the electric field in which the fibers are being drawn. We believe that our experimental results shown in Fig. 9 resolve this interesting issue. At a TCD below 16 cm (under constant potential of 13.8 kV) or above an electric field of 0.86 kV/cm (Fig. 10), a bimodal distribution is found. Yet, when the TCD increases above 16 cm at this same voltage, a sharp transition to a single mode of large fiber diameter is observed. The charge on the fibers in these two cases is constant, and the only variable is the electric field. Therefore, it is clear that the external field is inducing the branching at a given surface charge.
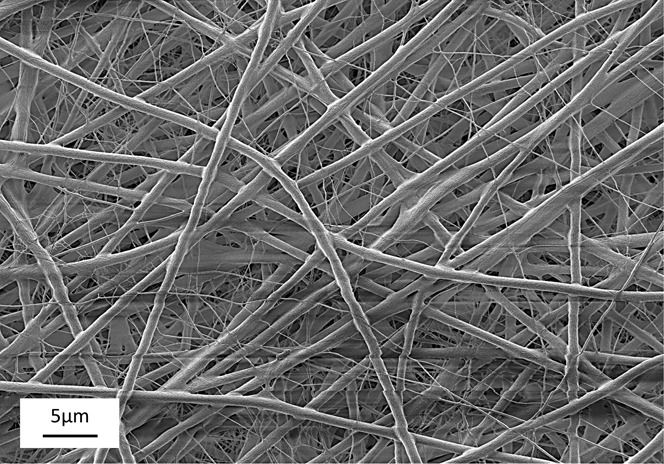
An example of the branching effect in ceramic PZT nanofibers obtained in this work is shown in Fig. 11. The figure was obtained by sintering a fiber mat that was removed from a metal plate after electrospinning. The average diameter of the large and small fibers is 800 nm and 150 nm, respectively. The results are in good agreement with the diameters obtained from other experiments.
Bimodal distribution of sintered PZT fibers obtained from HVS due to branching effect during electrospinning at V = 20 kV and TCD = 20 cm.
In contrast to the effect of viscosity, the electric field variation (especially via TCD changes) allows the formation of a single mode of fibers with a larger diameter. Thus, depending on the application requirements, fibers with a single distribution mode can be synthesized in a wide range of diameters. The double mode fiber distribution may be useful in preparation of ceramic catalyst supports from materials such as alumina, mullite, and cordierite. The better mechanical strength of the thick fiber population can form the supporting backbone, while the thin fibers can increase the useful specific surface area without substantial loss of rigidity.
IV. SUMMARY AND CONCLUSIONS
Nanofibers of PbZr0.52Ti0.48O3 with a diameter in the range of 100–800 nm were prepared by electrospinning of liquid precursor sols with different viscosities. The drying rate of HVSs and LVSs was modeled. The order of magnitude faster drying of the fibers from LVS is due to the larger surface to volume ratio of the LVS fibers. The electric field during spinning was changed by varying the voltage at a constant TCD and by changing the TCD at a constant voltage. In the LVS case, we found a sharp step-like transition from a large to a small fiber diameter regime at an electric field of 0.8 kV/cm. In the HVS case, a transition from a single to a bimodal distribution was found at the same electric field. The bimodal distribution was explained by branching effect. By decoupling the charge and electric field effects, it was shown that branching is induced by the external electric field. In summary, this paper improves our basic understanding of how to control the diameter of PZT nanofibers in a wide range, allowing selection of either a single or bimodal fiber distribution.
ACKNOWLEDGMENTS
Dr. Reisner Michael for the x-ray work and Peselev Dima for assistance in HRSEM analysis. The authors acknowledge the generous support of the Nancy and Stephen Grand Technion Energy Program (GTEP) and the Committee for Planning and Budgeting of the Council for Higher Education under the framework of the KAMEA Program.