1 Introduction
Many risks that government policies seek to limit involve low probability events that are not precisely understood, whether it is the risk of death from terrorism or the risk of cancer from environmental pollution exposure. In many risk regulation contexts, studies suggest that there is some risk of serious adverse outcomes, but do not provide specific probabilities. Government regulatory efforts ought to address risks based on a benefit-cost assessment of prospective policies, but restrictive legislative mandates often limit an agency’s discretion. For example, in the case of drinking water regulations, the Environmental Protection Agency (EPA) is directed to focus on the following aspirational goal for maximum contaminant levels: “Each maximum contaminant level goal established under this subsection shall be set at the level at which no known or anticipated adverse effects on the health of persons occur and which allows an adequate margin of safety.”Footnote 1 Notwithstanding this stringent directive, the Safe Drinking Water Act does envision recognition of both the benefits and costs when setting maximum contaminant levels.
Drinking water safety has attained national prominence for the presence of lead in drinking water in Flint, Michigan (Davey, Reference Davey2015, New York Times), and the presence of arsenic in drinking water, particularly in the West (Burnette and Hahn Reference Burnett and Hahn2001a, Reference Burnett and Hahnb; Viscusi et al., Reference Viscusi, Huber and Bell2014). However, efficiency and distributional impacts of drinking water standards continue to provoke long-term policy concerns (Raucher et al., Reference Raucher, Rubin, Crawford-Brown and Lawson2011; Cory & Taylor, Reference Cory and Taylor2017; Belzer, Reference Belzerin press), particularly for low-income consumers and small public water systems. Whether EPA can formulate optimal policies may depend in part on the pressures exerted on the agency. How the public perceives and values these risks may be among the factors that influence which hazards are on the agency’s agenda and the extent to which government will choose to regulate the risks, if at all.
This article focuses on the public’s perception and valuation of a set of three different low probability environmental risks linked to drinking water—bisphenol A (BPA) in plastic bottles, the herbicide atrazine in drinking water, and trace amounts of prescription drugs in public water supplies. Each of these risks has received national media coverage. How the public perceives and values these risks are critical determinants of the rationality of individual decisions and the nature and extent of public pressures for government intervention. Private willingness-to-pay values for reducing these risks could potentially provide guidance to government agencies for the assessment of the benefits of reducing these risks. Whether such monetization of the risk reduction effects using survey results such as those reported here is a sensible depends on whether the monetization arises from sound, reasoned responses consistent with expressed risk valuations for other hazards. We provide evidence that these values arise from behavioral anomalies that would question their use in benefit assessments (Robinson & Hammitt, Reference Robinson and Hammitt2011; Mannix & Dudley, Reference Mannix and Dudley2015; Viscusi & Gayer, Reference Viscusi and Gayer2016; Kniesner, Reference Kniesner2019).
To examine risk beliefs and valuations for these hazards, we rely on three separate waves of surveys using large nationally representative samples from a Web-based panel. While the specific components of the surveys differ, they each address willingness-to-pay valuations for risk reductions in drinking water in similar ways. After introducing the survey methodology in Sections 2 and 3–5 report on the results for BPA, atrazine, and prescription drugs, respectively. The findings yield a variety of consistent patterns across these hazards. First, the factors that influence risk beliefs generally have impacts in the expected directions. Thus, prior experiences with water-related risks inflate risk beliefs, as do revealed preferences based on past protective behavior. Additionally, risk beliefs are appropriately higher for people who view themselves as facing relatively high risks of illness from water-related hazards, among those afraid to drink tap water, view themselves as environmentalists, or have revealed concern with these risks by installing water filters in the home. These results corroborate the reasonableness of the general patterns of risk beliefs and respondents’ attention to the survey task but do not address whether the overall magnitudes of the risks have been estimated accurately. Further, valuations of risk reductions are positively correlated with risk perceptions that are conditional on broader risk experiences, thus reinforcing their impact. For example, people express greater willingness to pay (WTP) for safer water if they believe that they are personally at risk from the particular hazard, are unsure if they are personally at high risk, or consider themselves to be environmentalists. However, the WTP levels that respondents express are unduly large given the magnitude of the hazards. We propose that these excessive valuations reflect the cognitive challenges of formulating reliable valuations when dealing with risks that combine low probabilities with substantial ambiguity regarding the magnitude of the risk (Dudley et al., Reference Dudley, Mannix, Perez and Carrigan2019; Viscusi et al., Reference Viscusi, Huber and Bell2019).
Because the impetus for this analysis of publicized risks is linked to the publicity that the risks received, the article also explores the impact of publicity on respondents’ valuations. In textbook economic analyses of risk beliefs, the provision of information generally is portrayed as having a favorable role. Acquiring accurate information about a risk should lead people to revise their prior risk beliefs to be more aligned with the actual risk levels. However, this favorable result often presupposes that the information provision conveys an objective estimate of the current scientific evidence, which is then processed in a manner that is reflective of the underlying quantitative risk levels. If the information simply provides a general alert that a particular type of risk is present, greater publicity could lead to either more or less accurate risk beliefs.
Whether publicity regarding low probability drinking water risks stimulates overestimation or underestimation of the risk is unclear a priori. If the publicity alerts consumers to a risk that they otherwise did not know existed, one would expect that such publicity to raise risk beliefs, consistent with observed patterns of risk beliefs (Kahneman & Tversky, Reference Kahneman and Tversky1979; Fischhoff et al., Reference Fischhoff, Lichtenstein, Slovic, Derby and Keeney1981) and alarmist responses to situations of risk ambiguity (Viscusi, Reference Viscusi1997). While initial media coverage may boost valuations by making the risk more salient, repetition of that coverage coupled with information about the magnitude of the threat might also dampen these beliefs, especially if the message of the risk is not reinforced by explicit harms that the public experiences. The BPA and atrazine estimates explore the impact of news awareness on risk beliefs and valuations of risk reduction. The media-related analysis for prescription drugs takes a different approach by exploiting the time period between multiple survey waves to assess the effect of the cumulative press coverage. Media coverage of these hazards sometimes limits valuation, but the observed WTP values for elimination of each of the three hazards remain inordinately large. Whether these values are dampened with greater coverage or not, we suggest the high WTP values that reflect the actual attitudes of the public toward small undefined risks are inappropriate for benefit assessment by the government.
2 Survey design
Three different surveys exploring the publicized risks were administered by Knowledge Networks (now GfK Knowledge Panel) to adults age 18 and over. The samples are derived from a probability sampling approach for the U.S. population. The firm provided panel members with computers and internet access if needed, so that the resulting panel is nationally representative. The survey firm administered the survey to a random sample of members of the panel, with a unit response rate of over 70% across these studies. Conditional on taking the survey, the item response rate was close to 100%. Table A1 summarizes the sample characteristics for the three samples, each of which included different respondents. The demographics of the samples align quite closely with Census measures of the U.S. population. The BPA sample consists of 2,797 respondents who were surveyed from May 2008 to October 2009. The atrazine sample consisted of 812 respondents surveyed in October 2009. The prescription drug surveys included 4,462 people who were surveyed from May 2008 to October 2009.
The dataset includes a detailed set of personal characteristic variables, which were coded as follows: age, gender (female as a dummy variable, d.v.), race (black d.v.), ethnicity (Hispanic d.v.), years of education, household income (annual income divided by 10,000), the top coded income category (annual income of $175,000 or above d.v.), whether the respondents view themselves as environmentalists (considers self environmentalist d.v.), and whether the respondent lives in a metropolitan statistical area (MSA category d.v.). The surveys also included questions for the respondent’s exposure to drinking water risks, including whether the respondent’s household is on a well (well user d.v.), whether the respondent drinks tap water (drinks tap water d.v.), number of glasses of tap water that the respondent drinks per day (glasses of water per day d.v.), a top coded category of seven or more glasses per day (top glasses category (7+) d.v.), whether the household uses a water filter (filter use d.v.), and whether the respondent drinks some bottled water (bottled water use d.v.). For risk beliefs regarding drinking water generally, the surveys inquired whether the respondents consider their own water risk to be high (considers own water risk high d.v.), whether the respondent has ever been afraid to drink tap water (ever afraid to drink tap water d.v.), and whether the respondent has ever been sick from drinking water (ever sick from drinking water d.v.). The BPA and atrazine surveys included a question for whether the respondent had seen publicity about the particular risk (aware of story d.v.). The prescription drugs in drinking water analysis included a variable (national news stories, cumulative d.v.) which used Dow Jones Factiva data. For the BPA and atrazine risks, the survey included a risk belief question that inquired whether the respondents believe that they are personally affected by the risk (risk affects me d.v.), are not sure if the risk affects them (not sure if risk affects me d.v.), or do not believe that they are affected by the risk (risk does not affect me d.v.). The BPA survey also included a question for whether the respondents believed that their water bottles contained BPA (my water bottles have BPA d.v.), were not sure if their water bottles were made with BPA (my water bottles not sure d.v.), or did not think that their water bottles were made with BPA (my water bottles have no BPA). As will be discussed below, each survey also included a question eliciting the respondent’s willingness to pay to eliminate the risk.
3 Survey 1: Perception and valuation of water from bottles containing BPA
The BPA sample consists of 2,797 bottled water users surveyed between May 2008 and October 2009. The survey began by telling respondents the overall nature of the risk with the following statement. “The United States and Canadian governments may declare some plastic water bottles as toxic. These bottles can release a chemical called BPA into the water inside. This chemical has been shown to cause urinary tract problems and affect hormone levels in laboratory animals even at low levels of exposure.” This statement is consistent with the tone of the media coverage of this risk. It provides information about the threat but little information about its magnitude. Then the survey asked respondents if they were aware of this story and asked them if they believed this kind of plastic posed a health risk to them: “Do you believe this kind of plastics poses a health risk to you? Yes, No, Not Sure.” In addition to other risk-related questions regarding their purchase of bottles containing this kind of plastic, the survey included the following WTP question: “If you learned that your plastic water bottles might cause health risks, would you be willing to pay [$X] more per month on bottled water for a brand that guaranteed that it did not have such risks? Yes, No.” The monthly WTP to remove the BPA risks amount was randomized across respondents with values $1, $5, $10, $15, or $20. The survey also inquired whether the respondent bought water that comes in this kind of bottle.
3.1 BPA risk beliefs
Table 1 summarizes the risk belief questions with the percent of respondents in each risk belief category. The information in the first row of Table 1 for BPA indicates that 28% of all respondents believed that they were personally exposed to BPA risks, that is, risk affects me. The more prominent response categories are the 52% of respondents in the not sure if risk affects me category, and the 20% of respondents in the risk does not affect me group. It is noteworthy that almost half of the sample is unsure if they had a risk exposure. Will this risk ambiguity group be more similar in their risk valuations to those who perceive a threat or to the sample members who do not believe that they are at risk?
Percentage of respondents in each risk belief category, BPA risk.

Abbreviation: BPA, bisphenol A.
The second and third rows of Table 1 provide the distribution of risk beliefs with respondent awareness of the media coverage of BPA. Awareness shifts the distribution of risk beliefs away from the intermediate ambiguity risk exposure category and toward the risk belief and risk disbelief categories for those who are aware of the news stories regarding BPA risks. Compared to respondents who were not already aware of the media coverage of BPA risks, respondents who were already aware of the news coverage were 9% more likely to believe the risk affects me, 4% more likely to believe that BPA risk does not affect me, and 13% less likely to be in the intermediate group who are not sure if risk affects me. This result is important because it shows that more information can reduce ambiguity while increasing confidence in either polarized belief. We will show in the other studies that risk ambiguity and response to ambiguity play a reduced role for the better-informed respondents.
The ambiguity of their assessment of risk exposure is of particular interest given the empirical evidence indicating the presence of ambiguity aversion for people who are considering ambiguous probabilities of a gain (Ellsberg, Reference Ellsberg1961). Similarly, there is evidence that people are averse to ambiguous environmental risks that pose a small probability of a loss (Viscusi & Magat, Reference Viscusi and Magat1992; Viscusi & Chesson, Reference Viscusi and Chesson1999). Being unsure of whether there is any risk exposure is consequently not equivalent to denying any personal risk. Whereas valuing risk is typically modeled by multiplying a specified probability by a positive constant, the incorporation of risk ambiguity in expected utility models is more complex. Incorporating risk ambiguity into neoclassical models introduces new terms in the expected utility model to capture the role of perceived effects of risk ambiguity on individual well-being.
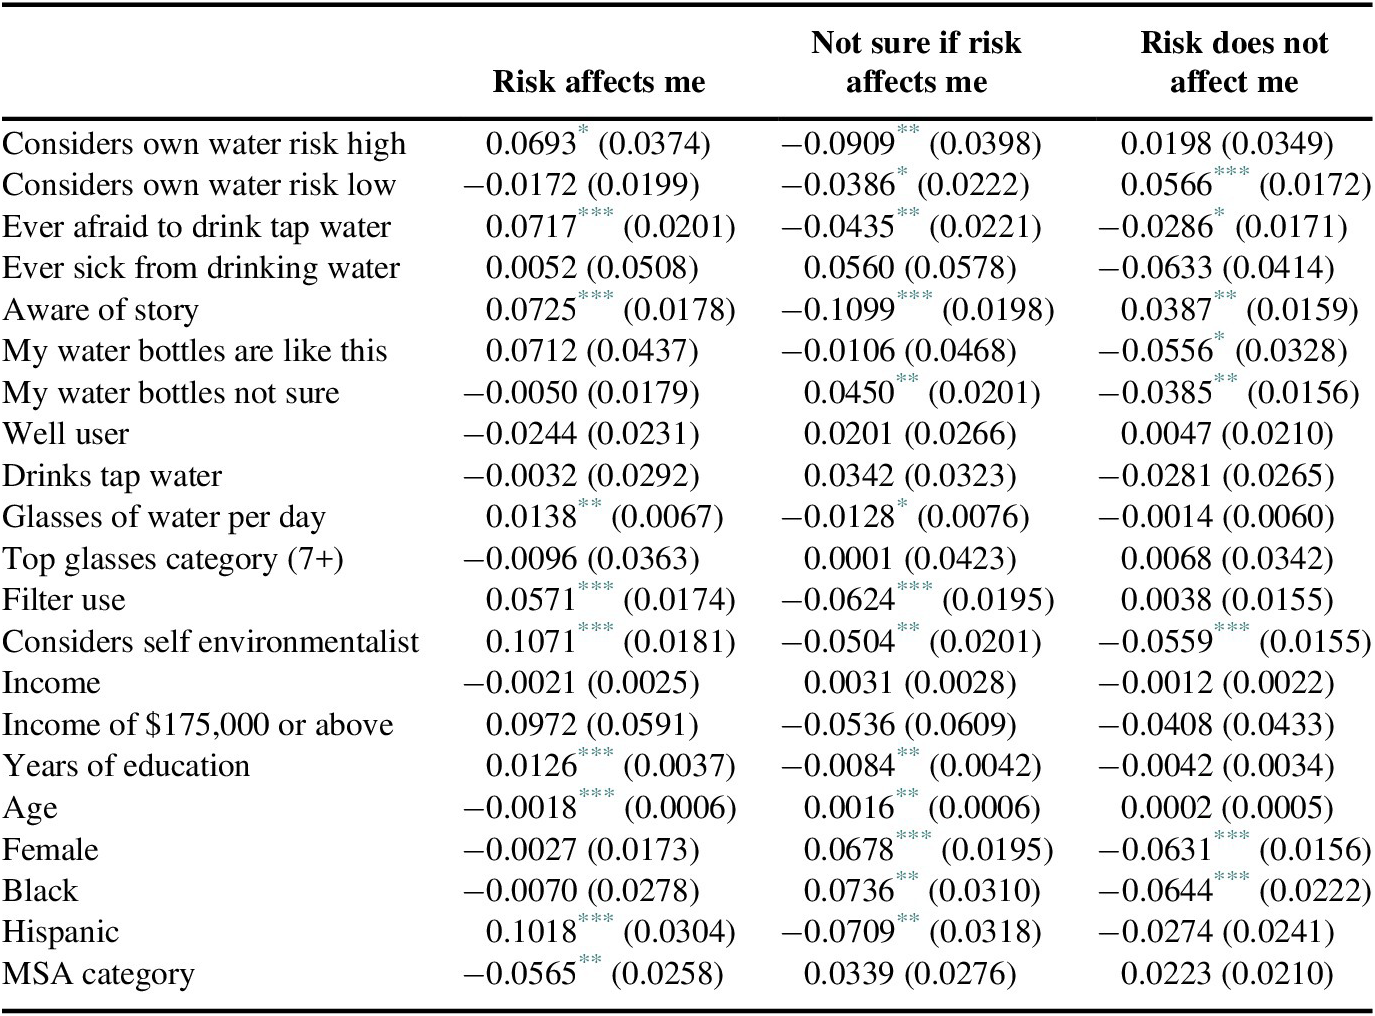
Separate regression analyses predict the three risk belief measures with various personal background and characteristic variables. The three columns in Table 2 are probit regression results for the 0–1 variables for whether the risk affects me, not sure if risk affects me, or believe risk does not affect me. In each instance, the other two risk belief categories were assigned a 0 value.
Probit regression estimates of the impact of respondent characteristics on beliefs about personal risk of BPA.

Note: Probit regression, reporting marginal effects. Standard errors in parentheses.
Abbreviation: MSA, metropolitan statistical area.
* Significant at 10%.
** Significant at 5%.
*** Significant at 1%.
The estimates generally accord with positive expectations. Having risk beliefs regarding their own water risks generally reduces the likelihood of indicating the ambiguous response of not sure if risk affects me. Those who regard their own water risk as high are more likely to think that the BPA risks affect them, while those who regard their own water risks as low are more likely to indicate that the BPA risks do not affect them. People who indicate that they have ever been afraid to drink tap water similarly are more fearful of BPA risks, indicating that they believe that the risk affects them and are less likely to be in the intermediate ambiguous group or to indicate that BPA risks do not affect them.
Being aware of story has an interesting effect in that it reduces the responses in the intermediate ambiguity category and boosts the responses in the risk affects me and risk does not affect me groups. Thus, previous awareness of the risk can significantly increase either confidence in personal exposure or confidence in lack of exposure. Whether that awareness is grounded in knowledge about the level of the risks, or simply acts to reduce the intermediate ambiguous response, is not clear. The respondent’s use of bottles containing BPA is influential in some of the regressions, as those whose bottles contain BPA are less likely to say risk does not affect me, and those who are unsure whether their bottles contain BPA are both more likely to be in the not sure if risk affects me group and less likely to respond that risk does not affect me. Being a well user is unrelated to the risks posed by putting liquids in plastic bottles containing BPA, and this variable has no statistically significant role.
Several water usage and personal characteristic variables also are significant and reasonable. Respondents who drink more water measured by glasses of water per day are appropriately more likely to believe that they are exposed to the risk and less likely to be in the ambiguous group. People who are attuned to environmental risks either because the respondent considers self environmentalist or has revealed a concern for water quality through filter use in the home are more likely to perceive a BPA risk and less likely to be unsure of such a risk. Education (years of education) has statistical significance in two instances, with the main impact being that better educated respondents have more definitive views, they are less likely to be unsure and more likely to believe that they face a risk. Whether the education coefficients reflect the amount of risk information about BPA risks or the sensitivity to these particular risk exposures is unclear. In the subsequent analyses of BPA and other hazards, years of education does not play a statistically significant role with respect to differences in risk belief or valuations of the risk.
3.2 Willingness to pay to avoid BPA risk
Having established the factors that account for perceived beliefs about the personal relevance of the BPA risk we now turn to the amount respondents were willing to pay to eliminate it. Figure 1 indicates the percentage of respondents who were willing to pay each of the specified amounts to eliminate the risk. This declining pattern in Figure 1 is the valuation analog of a scope test in which the WTP declines with the extent of the risk reduction. In this instance, the percentage of respondents who are willing to pay to eliminate the risk declines as the specified WTP amount increases.
Percentage accepting higher annual cost increases to remove risks from toxic plastics in water bottles.

About 80% of respondents would be willing to pay if the cost is only a charge of $12 annually, but this percentage drops to 41% if the charge is $240. The declining pattern is indicative that the respondents are more averse to greater expenses, consistent with basic rationality, but this pattern does not imply that respondents are making plausible risk-money tradeoffs for these small risks.
The WTP question in the survey does not elicit a specific WTP amount. Consider a respondent who faces an annual cost increase of $60. If the response is Yes, the underlying WTP value for the person is in the range ($60, ∞). For respondents who answer No to the WTP question, their value is in the range ($0, $60). The intervals for the survey amounts ($12, $60, $120, $180, and $240) are defined analogously. We estimate the WTP value for the individual based on these responses using interval regression. The nominal dollar options presented to respondents, and therefore the expected valuations, would be about 17% higher in 2019 dollars.
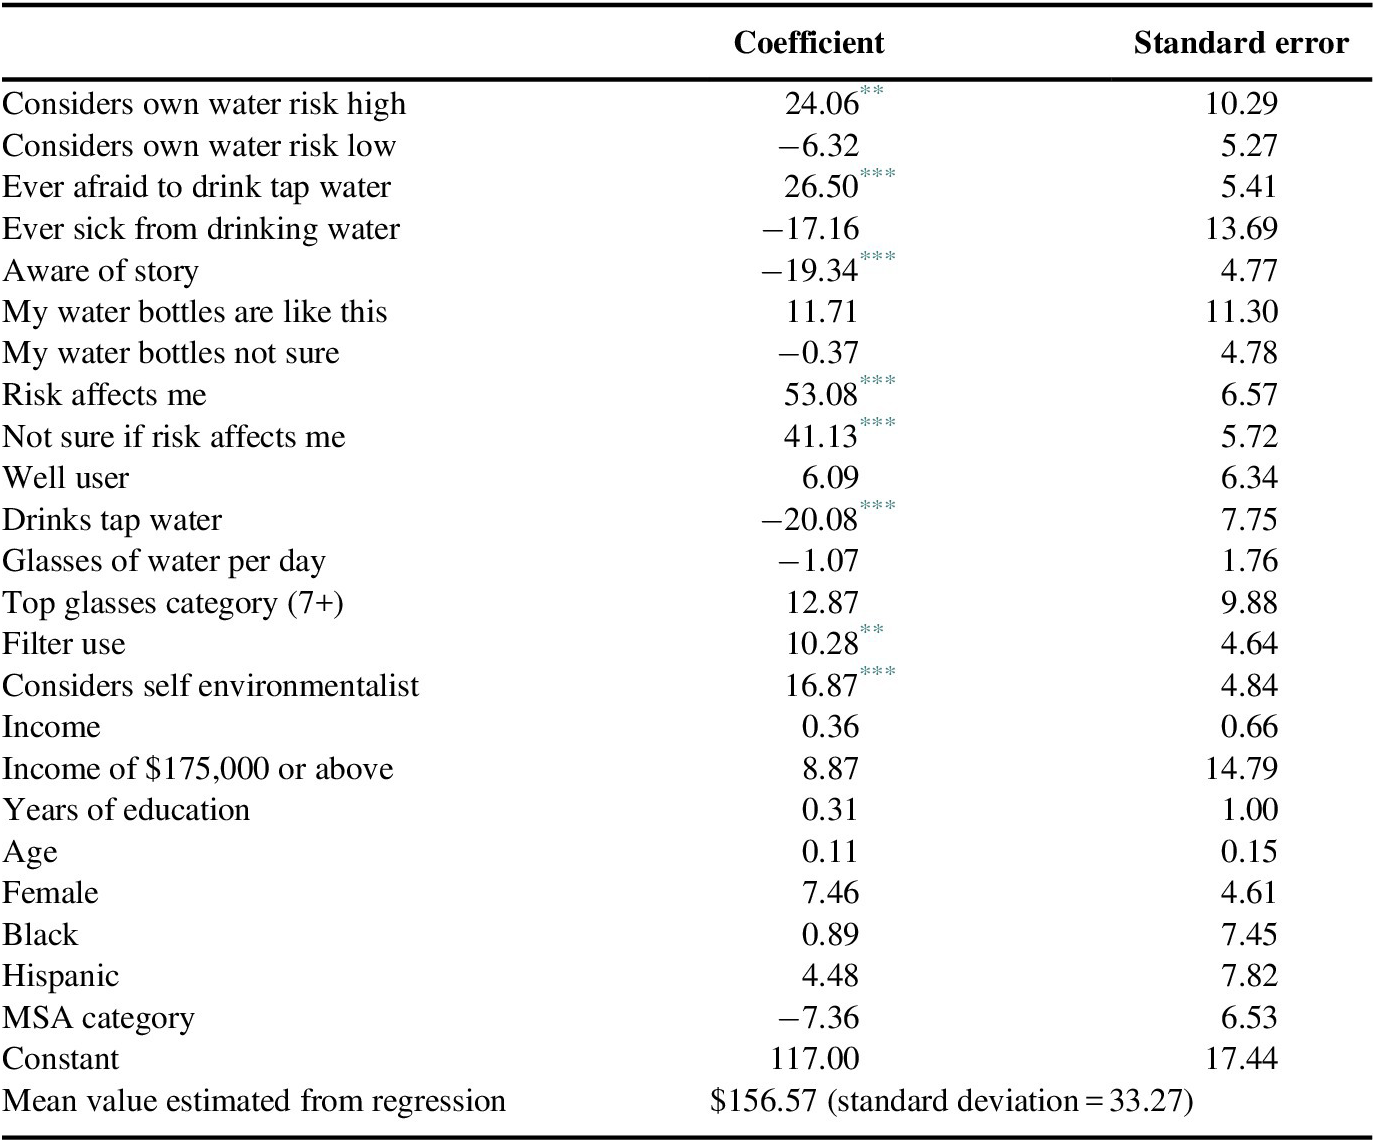
Table 3 presents the WTP interval regression results for BPA, where the reported coefficients correspond to dollar values. The average stated WTP amounts are quite large relative to the magnitude of the risk. The average WTP for the sample is $157 annually in 2009 dollars.
Interval regression on the willingness to pay to remove BPA in water bottles.

Abbreviation: MSA, metropolitan statistical area.
* Significant at 10%.
** Significant at 5%.
*** Significant at 1%.
The coefficients in Table 3 indicate that people who consider own water risk high or are in the ever afraid to drink tap water group have a greater WTP. Relative to those who indicate risk does not affect me, those who are not sure if risk affects me are willing to pay $41 more and those who believe risk affects me are willing to pay $53 more annually to avoid the risk. The $12 difference in the coefficients is statistically significant at the 0.05 level (χ 2 = 4.50).
While most of the personal characteristic variables do not play any statistically significant role, two variables that are reflective of water quality preference variables are influential. The WTP values are greater for those who consider self environmentalist or who indicate filter use in their home. Filter use may be positively correlated with the household’s valuation of water safety and risks in general. For analogous reasons, bottled water drinkers reveal a relatively high valuation of avoiding risk through their bottled water purchases instead of tap water consumption. Coupling bottled water drinking with drinking tap water would reflect a less pronounced fear of risks. Bottled water drinkers who also drinks tap water are less willing to pay, by $20, than those who do not drink from the tap. Their experience with tap water and the willingness to substitute tap water for bottled water may reflect a lower general aversion to risks, such as the threat posed by BPA.
How reasonable are these WTP assessments? The scientific evidence regarding whether BPA poses any nonzero risk and the level of any such BPA risk is quite limited. BPA policies enacted to date consequently have been viewed as a “precautionary measure” rather than being driven by risk levels that are above the potential health effects level (U.S. Environmental Protection Agency, 2017). The emphasis of policy efforts to date has been on exposures to children. In 2008, Canada banned the use of BPA in baby bottles. In 2012, the Food and Drug Administration banned the use of BPA in baby bottles and sippy cups. There have also been regulations enacted by 12 states and the District of Columbia, which have banned the use of BPA, mostly in children’s products such as pacifiers and food or drink containers. Because of their concern with the uncertainty regarding the potential risk levels, government policies have reflected ambiguity aversion not unlike that of the survey respondents, but the extent of the intervention has been quite limited, and certainly less than would justify a payment of $157 per year for U.S. households.
4 Perception and valuation of atrazine risks in drinking water
A companion survey addressed the risks posed by the herbicide atrazine in drinking water. The survey, which was administered in October 2009 to 812 respondents, had many parallels with the BPA survey in that it informed respondents of the general nature of the risk, inquired about their awareness of the risk, and elicited information regarding their willingness to pay to eliminate the risk.
The survey introduced the atrazine risk with the following information: “Between 2003 and 2008, tests in Illinois, Indiana, Kansas, and Ohio found high concentrations of the weed killer atrazine in drinking water. Atrazine is believed to interfere with the body’s natural production of hormones and has caused birth defects in laboratory tests on animals. The chemical can be removed with the use of a filter.” In addition to ascertaining if respondents were aware of the story d.v., the survey included the three risk belief measures: risk affects me d.v., risk does not affect me d.v., and not sure if risk affects me d.v. Respondents then considered the following WTP question: “If you could purchase a filter that would cost [$X] per year that would ensure that this chemical is not in your drinking water, what would you think of such a system?” Respondents were asked whether they would pay one of the following costs for a filter: $25, $50, $75, or $100. They could also answer that they already used a filter instead of accepting or declining the question. Figure 2 shows that the fraction of the sample who expressed any particular WTP amount declined as the amount increased, which a result consistent with respondents attending to the survey task.
Atrazine in drinking water, percent accepting treatment by annual cost of drinking water filter.

The atrazine risk was not familiar to most respondents. Only 7% of the sample indicated that they were aware of the news stories about atrazine risks. Table 4 shows the overall risk belief percentages regarding exposure to atrazine in the first row. The second row presents these statistics conditional on being aware of the media coverage of the atrazine risk, and the third row presents statistics for those who are not aware of the media coverage. The distribution is similar to those for BPA with 16% indicating that the risk affects me, 48% indicating not sure if risk affects me, and 36% indicating the risk does not affect me. As was also the case with BPA risks, the intermediate category of people who are uncertain of their possible risk exposure constitutes the largest group and about half of the sample.
Percentage of respondents in each risk belief category, atrazine risk.

Compared to those not aware of this news story, those aware of the media coverage shift away from the intermediate category to the two extremes, as 8% more respondents indicate that the risk affects me, 9% more respondents indicate that the risk does not affect me, and 17% fewer respondents are in the intermediate group who are not sure if risk affects me (t = 2.49, significant at the 0.05 level). As was also the case for the BPA results, familiarity with the media coverage moves respondents out of the intermediate ambiguity response, but increases the frequency of responses for both of the more definitive categories of risk exposure.
Table 5 reports the three sets of regression results for whether the respondent believed the atrazine risk affects me, was not sure if risk affects me, and believe risk does not affect me.
Probit regression estimates of the impact of respondent characteristics on personal risk perceptions for atrazine.

Note: Probit regression, reporting marginal effects. Standard errors in parentheses.
Abbreviation: MSA, metropolitan statistical area.
* Significant at 10%.
** Significant at 5%.
*** Significant at 1%.
General fears of water-related risks are principal drivers of whether the respondent also believes that atrazine poses a threat. Risk beliefs are substantially higher for respondents who considers their own water risk high, as this variable increases the probability that there is a belief in a personal risk from atrazine by 0.25 and decreases the likelihood that they are unclear if they are vulnerable to the risk by 0.24. If the respondent is in the opposite group that considers their own water risk low, there likewise is a drop of being in the intermediate ambiguity category of not sure if risk affects me by 0.19, but in this instance, there is an increase in the risk does not affect me response by 0.20. Respondents who were ever afraid to drink tap water also were more likely to indicate that susceptibility, with an added increase in the probability that the respondent perceives a personal risk of 0.09 and a decrease of 0.08 in believing risk does not affect me. Respondents who were ever sick from drinking water are more fearful than the population at large as they have a 0.22 lower probability of believing risk does not affect me.
Controlling for the other variables included in Table 5, information about the atrazine risks received from the media decreases the likelihood that the respondent is in the intermediate category of not sure if risk affects me, but only at the 0.10 level. Similarly, living in one of the states where the news reports and the survey text indicate as principal venues for the risk exposure marginally reduces the likelihood of being in the intermediate category and significantly increase the subject’s belief that risk affects me.
Respondents who are in the well user category tend to have more precise beliefs regarding their risk exposure, with a 0.08 higher probability of risk affects me, a 0.09 higher probability of risk does not affect me, and a 0.17 lower probability of being in the intermediate risk exposure ambiguity category. The principal demographic factors that are statistically significant in any of the risk exposure regressions in Table 5 are that black respondents are more likely to perceive that the risk personally applies, while older respondents are less likely to do so.
4.1 Willingness to pay to remove atrazine risk
The atrazine interval regressions are shown in Table 6, and have an average annual WTP of $97. Although a household who considers own water risk high in general is more likely to perceive a personal risk from atrazine, this variable does not have an additional impact on the WTP value. However, having been ever afraid to drink tap water does boost the WTP value by a substantial $16. Those who already have filter use add an average of $35, which may reflect a willingness to upgrade the filters that these respondents already use at an average cost of $28 per year. Some household water filters can only remove dirt, sand, and sediment, so a treatment system that also removed chemicals such as atrazine could be an upgrade. Those who are bottled water user add $10, and considers self environmentalist add $9, (p < 0.10).
Interval regression of willingness to pay to eliminate atrazine risks.

Abbreviation: MSA, metropolitan statistical area.
* Significant at 10%.
** Significant at 5%.
*** Significant at 1%.
People who indicate that the risk affects me are willing to pay $41 more than those who believe that risk does not affect me, while those who are not sure if risk affects me pay $25 more. Thus, aversion to risk ambiguity continues to play a role. These risk ambiguity responses are more than half the magnitude of the valuations for respondents who indicate that risk affects me (χ 2 = 4.43, p < 0.05), so there is a substantial premium for ambiguous risk beliefs relative to the omitted category of respondents for whom risk does not affect me.
Well users have a lower willingness to pay to remove atrazine from water even though they sometimes believe that it poses an actual threat. They may anticipate that these payments are privately incurred costs. In contrast, those on public water supplies may assume that the costs are socialized so that they will not be paying the full amount.
Being willing to pay on the order of $100 annually to eliminate either perceived or ambiguous risk exposures is larger than expected given the magnitude of the risk. The scientific evidence regarding the extent of the risk does not indicate a major threat. Both the World Health Organization (2003) and the U.S. Environmental Protection Agency (2018) have prepared detailed assessments of the risk. Thus far, the policy actions have been limited, perhaps in part because there are few policy instruments that can be deployed to eliminate atrazine risks short of banning the chemical from use by cancelling its registration or imposing maximum contamination limits that could be infeasible for water systems to meet. The EPA continues to review the registration of this herbicide, and it monitors 150 drinking water systems for possible atrazine contamination based on historical evidence of its use.
5 Perception and valuation of risks from prescription drugs in drinking water
The third survey examined response to the possibility of trace amounts of prescription drugs in drinking water. The surveys were implemented in four waves from May 2008 to October 2009, with a total sample size of 4,462. The survey included a question pertaining to WTP values but did not include questions about personal risk beliefs concerning prescription drugs in drinking water. However, the survey did include the more general water risk questions pertaining to whether the respondent considers own water risk high, ever afraid to drink tap water, and ever sick from drinking water.
Although this survey did not include information on whether respondents had seen media coverage about trace amounts of prescription drugs in drinking water, for this study it is feasible to construct a media exposure variable to measure the level of media coverage over time. To capture the role of media coverage, we constructed a variable to reflect the emerging national news coverage of these risks over time using Dow Jones Factiva data. Factiva is a searchable database of over 30,000 news sources worldwide. We specified print (not web-only news) stories in the USA. The extent of the news coverage increased over that time, as the cumulative number of national news stories on that risk was 109 in May 2008, 220 in August 2008, 258 in December 2008, and 296 in October 2009. The count of these stories at the time of each respondent’s survey is the variable, cumulative news stories.
The survey introduced the prescription drug risks in drinking water with the following survey text: “Recent tests conducted by a national news organization found small amounts of prescription drugs in drinking water used by over 40 million Americans. These drugs included painkillers, birth control hormones, and antibiotics. Scientists do not know whether the small doses of these chemicals could cause serious health risks. Certain water treatments using either ultraviolet light or ozone can break down these drugs, but the treatments can be expensive.”
As was also the case for the BPA and atrazine surveys, the WTP question was tailored to whether the respondent obtained their water from a well. For those who do not rely on well water, their WTP question took the following form: “If an increase in your water bill of [$X] per year for treatment that would ensure that there are no drugs in your drinking water, what would you think of such an increase?” The question for households on well water was analogous. The respondent had to indicate whether or not they would be in favor of purchasing such a treatment, seeing one of $50, $100, $150, and $200 per-year costs. Figure 3 shows the percentage of the population willing to incur these amounts. The declining percentage who are willing to pay the stated amount declines as the value of $X increases, consistent with the pattern one would expect if respondents were attending to the survey task.
Prescription drugs in drinking water, percent accepting treatment by annual cost.

Table 7 presents the interval regressions estimates for the WTP for treatment of prescription drugs in drinking water, predicting an average value of $146.
Interval regression of willingness to pay to eliminate risks of trace amounts of prescription drugs in drinking water.

Abbreviation: MSA, metropolitan statistical area.
* Significant at 10%.
** Significant at 5%.
*** Significant at 1%.
Prominent contributors to the differences in the WTP values are, as in the previous analyses, whether the respondent considers own water risk high and whether the respondent is ever afraid to drink tap water, each of which has a significant positive effect on WTP values. The average premium paid by each of these groups, beyond the sample estimate of $146 annually, increases by around $22 for the former and $17 for the latter.
The rising level of information that the public has about the prescription drug residues in drinking water has a statistically significant negative effect on valuations. The mean effect of this variable is to decrease the annual WTP amounts over the survey period from $150 from May to August 2008 to $144 from December 2008 to October 2009. Greater publicity regarding this risk has a modest negative effect on the WTP values to eliminate the risk, suggesting that familiarity with the risk enables respondents to put the magnitude of the risk in better perspective. The coefficient calculates to a maximum estimated difference of $15, from the 109 news stories available at the first survey to the 296 available at the last.
Variables that are strongly correlated with likely concern with water quality have a positive influence on the WTP amounts. The WTP values are greater for respondents who indicate that they currently have filter use, bottled water use, or who considers self environmentalist. Each of these variables is likely to be positively correlated with the respondent’s unwillingness to incur risks. Drinking bottled water may reflect such preferences and does not guarantee an absence of risk exposure because most respondents who report drinking bottled water also drink tap water. The average additional WTP amounts for these group is $10 for filter use, $8 for bottled water use, and $22 if considers self environmentalist.
As in the case of the atrazine results, well users have significantly lower WTP values. The prospect of incurring privately borne costs may dampen their willingness to bear such expenses. Those on public water systems may assume that they will not bear the full costs, leading to a disparity in the private and social costs.
Several personal characteristic variables also have a statistically significant role in the valuation of prescription drug risks. There are significant positive effects on WTP of years of education and being female, black, and/or Hispanic.
The mean annual WTP amount in excess of $140 to eliminate the prescription drug risks seems quite high relative to the current assessed magnitude of the risk. To date, this public response to the risk has not led to major policy interventions. Chlorination and other standard treatment methods remove about half of the drugs, leading the World Health Organization (2011) to conclude that additional treatment methods were not warranted. These more vigorous treatment processes, such as oxidation technologies, are considerably more expensive than current treatment approaches.
6 Conclusion
The survey results regarding the publicized drinking water risks yield three principal implications. First, the valuations for those who perceive exposures to the risk are mostly out of line with reasonable risk-cost tradeoffs, especially considering the fact that the percentage of the population who believe that they are exposed to risks from BPA or atrazine were small. Among those who perceived risk exposures, the average annual valuations for eliminating these risks were $177 for BPA, $97 for atrazine, and $146 for prescription drugs in water.Footnote 2 To put these valuations in perspective, if we use an average value of statistical life of $10 million (Viscusi, Reference Viscusi2018), the annual WTP amounts on the order of $150 would be appropriate if the exposures corresponded to an annual risk of death of 1/65,000, which far exceeds the scientific estimates of these risks. Respondents who believe that they are exposed to the risk behave in a manner that is consistent with overestimation of the magnitude of the risk or an inability to sensibly construct a WTP amount for these very small risks.
The second principal implication of the results is that risk ambiguity aversion plays a pivotal role in affecting the implications of publicized risks. For BPA and atrazine, about half of all respondents were unsure of their risk exposure. Nevertheless, this group was willing to pay substantial amounts to eliminate the risk, or more than half of the WTP values for those who believe that they are exposed to the risk. Thus, while the alarmist responses of the segment of the population who believe that they are exposed to the risk are greater, the role of ambiguity aversion and its attendant effect on WTP values is more prevalent and of greater overall consequence for these two publicized risks.
The third principal implication of the findings is that publicity concerning the risks can sometimes serve a constructive role, but may sometimes create additional alarm. Alerting people to risks does not fully assuage potential concerns, but if the media coverage also puts the minimal level of the threat in perspective, it can simultaneously inform the public and avoid provoking an excessive reaction. People who were more likely to be aware of BPA risks due to media coverage were less likely to indicate that they were personally at risk, and they also had lower WTP values to eliminate the risk. Publicity for atrazine had a more limited role. There was no statistically significant effect of awareness of media coverage for atrazine risks on WTP values to eliminate atrazine risks, and the only significant impact was to reduce the likelihood that the respondent was not sure of possible atrazine exposure. The findings for prescription drug residues are instructive in that the empirical results track the evolving risk beliefs as the level of media coverage increased. It is possible that repeated coverage of a risk in media without reinforcement from actual experience could dampen the willingness to pay to resolve the risk. Thus, repeated media coverage potentially could both alert the public to the presence of the particular hazard while at the same time it could reduce undue alarmist response.
The implications of the WTP estimates for benefit assessment are less clear. Some economists believe that policies should be grounded in actual risk levels and others believe policies should be governed by the revealed preferences of the citizenry even if they are not well-founded (see Portney, Reference Portney1992 for discussion of these divergent approaches). However, given the inconsistency of these seemingly inordinate WTP values with valuations of other health risks, such as mortality risks, we believe that it is inappropriate to use such estimates for purposes of benefit assessment. Adopting such a policy valuation approach could lead to policy emphasis on publicized risks generating high WTP amounts that exceed those of comparable, but less publicized risks.
While we favor an approach where benefit assessments are based on objective measures of the risk rather than public perceptions, treatment of the apparently excessive WTP values may differ, depending on whether the impetus for the high valuation is overestimation of the magnitude of the risk or risk ambiguity aversion. In the case of risk overestimation, a policy approach that is based on actual risk levels rather an exaggerated assessment of the risk seems compelling. Just as policymakers are willing to intervene if people make risky decisions by underestimating the risk, it similarly does not seem appropriate to permit policies to be guided by mistaken beliefs that overestimate the risk.
While ambiguity aversion regarding potential losses has a similar effect in that it boosts the WTP amounts, the conceptual basis for dismissing the WTP premium derived from ambiguity aversion is less clear. Does ambiguity aversion reflect a cognitive error that people would choose to overcome if they were aware of their behavior, or is there an additional component to the formulation of expected utility models that standard economic models do not include, but nevertheless should recognize as legitimate preferences? Even if risk beliefs in the presence of ambiguity are not well founded, the presence of risk ambiguity may lead people to undertake protective behaviors, such as substituting bottled water for tap. Thus, there may be real efficiency losses if policies do not address potential risk ambiguities, and consequently do not undertake an effective role in allaying public concerns and the behavioral responses that they generate.
Acknowledgment
This research was supported in part by an EPA STAR grant, “Water Quality Morbidity Benefits.”
A. Appendix
Sample statistics for beliefs, behaviors, and demographics for each survey.