Implications
Monitoring technologies may help farmers to detect lame cows. On four commercial farms, loose-housed dairy cows with accelerometers were visually locomotion scored repeatedly as a measure of their degree of lameness. From the leg-mounted accelerometers, activity means and variations were calculated for each week before locomotion scores. Statistical analysis exposed relevant combinations of lameness detection variables. The activity level, combined from different variables calculated from walking and standing, decreased already from healthy cows to mildly lame cows. Therefore, activity level measured at the leg may assist farmers in detecting lame cows early and without the use of manual labour.
Introduction
Lameness is a major health and welfare problem in modern dairy herds (Bruijnis et al., Reference Bruijnis, Beerda, Hogeveen and Stassen2012), which negatively affects oestrus expression (Walker et al., Reference Walker, Smith, Routly, Jones, Morris and Dobson2008), fertility (Bicalho et al., Reference Bicalho, Vokey, Erb and Guard2007), feeding and rumination (Almeida et al., Reference Almeida, Weber, Burton and Zanella2008), milk production (Kamphuis et al., Reference Kamphuis, Burke and Jago2013), lying behaviour (Ito et al., Reference Ito, von Keyserlingk, LeBlanc and Weary2010; Thomsen et al., Reference Thomsen, Munksgaard and Sørensen2012) and cow longevity (Thomsen et al., Reference Thomsen, Kjeldsen, Sørensen and Houe2004). The mean prevalence of lameness can be high, for example it was 37% in the United Kingdom (Barker et al., Reference Barker, Leach, Whay, Bell and Main2010), 44% in Denmark (Burow et al., Reference Burow, Thomsen, Rousing and Sørensen2014) and between 28% and 55% in regions in North America (von Keyserlingk et al., Reference Von Keyserlingk, Barrientos, Ito, Galo and Weary2012). Lameness prevalence also varies widely between herds (0% to 79%; Barker et al., Reference Barker, Leach, Whay, Bell and Main2010). Traditionally, lameness is detected by assessing the locomotion score (LS) of a cow visually. However, visual LS assessment is subjective and time-consuming (Thomsen, Reference Thomsen2009), and many farmers underestimate the lameness prevalence of their herd (Leach et al., Reference Leach, Whay, Maggs, Barker, Paul, Bell and Main2010). Therefore, and especially with increasing herd sizes, visual LS assessment of all individuals at a sufficient frequency is increasingly difficult to achieve, consequently many lameness incidences may go undetected.
The use of sensors measuring activity is increasing in technologically advanced dairy herds. Thus, some studies have used pedometers or the more advanced accelerometers as stand-alone technology to detect lameness (Mazrier et al., Reference Mazrier, Tal, Aizinbud and Bargai2006; Alsaaod et al., Reference Alsaaod, Römer, Kleinmanns, Hendriksen, Rose-Meierhöfer, Plümer and Büscher2012). Others have combined activity data with additional types of sensor data such as milk yield, concentrate left-overs or milking order to detect lameness (de Mol et al., Reference De Mol, André, Bleumer, van der Werf, de Haas and van Reenen2013; Kamphuis et al., Reference Kamphuis, Burke and Jago2013).
Previous studies have reported, that lameness affects cow behaviour: lame cows may lie down longer around feeding (Yunta et al., Reference Yunta, Guasch and Bach2012), have longer daily lying-time (Blackie et al., Reference Blackie, Bleach, Amory and Scaife2011), longer lying bouts (Thomsen et al., Reference Thomsen, Munksgaard and Sørensen2012) and take fewer steps/day (de Mol et al., Reference De Mol, André, Bleumer, van der Werf, de Haas and van Reenen2013). In addition, using data from automated feed stations, lameness has been found to decrease feeding time (Gonzàlez et al., Reference Gonzàlez, Tolkamp, Coffey, Ferret and Kyriazakis2008). Thus, the behavioural time-budget of a dairy cow changes during lameness, making changes in several aspects of activity possible indicators of lameness. Furthermore, lameness may increase within-cow gait variation as measured with a pressure sensitive mat (Van Nuffel et al., Reference Van Nuffel, Vangeyte, Mertens, Pluym, De Campeneere, Saeys and Van Weyenberg2013) and accelerometer technology (Chapinal et al., Reference Chapinal, de Passillé, Pastell, Hänninen, Munksgaard and Rushen2011). Changes in activity variation are likely to indicate lameness, too. Recently, a small study showed that activity differences between cows may be larger than the activity difference between the lame and non-lame state of the same cow. Moreover, lameness elicited both increases and decreases in activity depending on cow (Alsaaod et al., Reference Alsaaod, Römer, Kleinmanns, Hendriksen, Rose-Meierhöfer, Plümer and Büscher2012).
The present study aimed to investigate the effects of degree of lameness (LS) and farm on behaviour variables as measured by a leg-mounted accelerometer.
Material and methods
Animals and housing
Data were collected on four commercial Danish Holstein Friesian dairy farms with a herd size above 200 cows. The cows were hornless and were kept in loose-housing systems with access to cubicles. They were milked twice a day in a milking parlour. No cows included in the study had access to pasture during the study. Routine claw trimming was performed three times a year. Herd level milk yield ranged from 8496 to 11 656 kg milk per cow per year.
LS assessments
The experimental period started in May 2008 and ended in June 2009, during which farms were visited five to seven times to assess the LS of the cows. The mean number of LS per lactation was 2.4 (s.d.=1.3 times, range=1 to 6 times). Mean time between visits was 60 days (s.d.=18 days, range=21 to 112 days). The following LS scale was used: LS1=normal, LS2=uneven gait, LS3=mildly lame, LS4=lame, LS5=severely lame (Thomsen et al., Reference Thomsen, Munksgaard and Tøgersen2008). LS was assessed by a trained technician when cows were leaving the milking parlour. One technician assessed cows on three of the farms, two other technicians assessed cows on the fourth farm. Whenever the technician was unable to identify a cow leaving the milking parlour, or if cows were moving closely together, LS was not recorded. Thus, not all cows with accelerometers were LS assessed on each visit. LS was always performed at least 4 weeks before a hoof trimming.
Accelerometers
By random selection 200 cows on each farm were equipped with three-dimensional accelerometers (IceTag3D, IceRobotics, Edinburgh, UK) on a hind leg. Cows which were equipped with an accelerometer and that left the herd were not replaced by other cows, but IceTags not in use after approximately half a year after the start of the period of data collection were attached to new cows once. Thereafter, the IceTags were not moved to new cows. For safety reasons, the accelerometers were attached in the milking parlour to the hind leg closest to the technician, so ∼50% of the cows wore the accelerometer on their left leg and 50% on their right leg. The accelerometers recorded three-dimensional acceleration data 16 times/s. The accelerometer software (IceTagAnalyzer, IceRobotics) computes the number of steps made, and a motion index (MI) per second, that is, the total acceleration within the second. The IceTag accelerometer and software have been validated earlier (Nielsen et al., Reference Nielsen, Pedersen, Herskin and Munksgaard2010). The accelerometer data were transferred automatically to a local computer at each milking. Data from the local computer was transferred to a central database via the internet.
Accelerometer data processing
Data were collected with a prototype of a system for downloading data, and data were missing for some days and some cows or sometimes for part of the day. Accelerometer data were cleansed according to the following criteria: days missing more than 10 min of data were disregarded. To remain in the data set, cows were required to have ⩾30 consecutive days of data. Furthermore, cows missing >1 period of at least 7 days, and cows missing a period of ⩾120 consecutive days were disregarded. After the application of these criteria, a total of 80 417 days remained in the data set. Lactations were cut-off at 365 days in milk and were required to have at least one LS to be considered for further analysis. Further, nine lactations were excluded due to questionable cow identification. From the accelerometer output it was determined whether a cow was lying, standing or walking (Nielsen et al., Reference Nielsen, Pedersen, Herskin and Munksgaard2010). The following variables were derived from the accelerometers: lying duration (min/day), standing duration (min/day), walking duration (min/day), number of steps (steps/day), step frequency (steps/daily walking minute) and MI for lying, MI for standing and MI for walking (g/day, here g=acceleration due to gravity; Nielsen et al., Reference Nielsen, Pedersen, Herskin and Munksgaard2010). We calculated step frequency as steps per daily walking minute, which is a more precise expression than steps per day or hour, because our definition excludes the steps made while the cow is standing. Another advantage of this is that steps per daily walking minute is uncorrelated with walking duration. From these data, <1% of days (i.e. 307) were removed because either MI standing or MI lying exceeded 10 000 g/day or because MI walking exceeded 25 000 g/day (deemed as outliers based on box-plots).
Deriving a data set based on LS
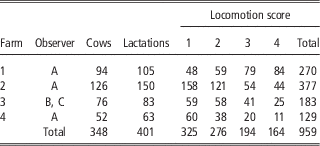
In the processed data, there were 959 LS observations in 401 lactations from 348 cows. The number of cows, lactations, observers and the distribution of LS observations by LS level is reported by farm in Table 1. Due to only 23 observations of LS5, LS5 were pooled with LS4. LS may change rapidly, therefore we focussed on days with accelerometer data measured during the week immediately before an LS. Weeks were defined as the 8 days starting 7 days before each LS assessment and ending on the day the LS was assessed. ‘Weeks’ were required to have at least 2 days with accelerometer data. Number of days in a week varied from 2 to 8 days depending on the availability of accelerometer data in a given week, the mean=7.09 days/week (s.e.m.=0.051).
Number of observers, cows and lactations, and the distribution of the 959 locomotion scores between the four farms

For each lactation and week, the means and coefficients of variation (CV, the standard deviation divided by the mean, expressed as a percentage) expressing the weekly individual fluctuation were calculated. Quantile–quantile plots were used to check whether data followed a normal distribution, which only lying and standing duration did. Therefore, walking duration and number of steps were square root transformed, step frequency was inverted. MI lying, MI standing, MI walking and the eight CV variables were natural log-transformed. The transformations were chosen using the BoxCox function of the forecast-package in R (Hyndman et al., Reference Hyndman, Athanasopoulos, Razbash, Schmidt, Zhou, Khan and Bergmeir2013). Statistical analyses were performed on both transformed and untransformed variables, revealing practically no differences with respect to significant results, consequently, the more readily interpretable results of the untransformed variables are reported in this study.
Statistical analysis
A principal component analysis (PCA) was performed to investigate the correlations between the variables. Before PCA, three variables were excluded due to Pearson correlations above 0.97, leaving 13 variables to be included in the PCA. The excluded variables were: number of steps due to 0.98 correlation with walking duration, standing duration due to −0.99 correlation with lying duration, and walking CV due to 1.00 correlation with number of steps CV. The set of 13 accelerometer-derived variables used for the PCA is hereafter referred to as ‘accelerometer variables’. The components selected for further evaluation had an eigenvalue above 1. The goal of the PCA was to obtain simple and interpretable factors. To decide between oblique rotation assuming correlated factors or the simpler orthogonal rotation assuming uncorrelated factors, promax, an oblique rotation was performed to investigate if factors were uncorrelated (i.e. correlation<0.32). Factor correlations were all below 0.32, therefore it was decided to use varimax, which is an orthogonal method for component rotation. The resulting rotated principal components (PC) were added to data for further analysis.
To test the effects of farm, LS, parity and lactation stage on the PC and accelerometer variables we used the following mixed model:
 $$\eqalignno{ Acc_{{ijklm}} =& \,STAGE_{i} {\plus}LS_{j} {\plus}PAR_{k} {\plus}FARM_{l} \cr &{\plus}(LS{\times}FARM)_{{jl}} {\plus}cow_{m} {\plus}e_{{ijklm}} $$
Here Acc ijklm was a given accelerometer variable. STAGE was lactation stage with three categories: early (⩽100 days in milk), mid (>100 to ⩽200 days) or late lactation (>200 days), LS was LS (j=1, 2, 3, 4), PAR was parity (k=1, 2, 3+) and FARM was farm (l=1, 2, 3, 4). Lactation stage and parity were included, because they have been shown to affect activity (Brzozowska et al., Reference Brzozowska, Lukaszewicz, Sender, Kolasinska and Oprzadek2014). The interaction between LS and farm was included to account for possible housing, management and observer differences between farms related to lame cows. Housing and management differences may arise due to differences in a variety of factors between farms that were not investigated in the present study. Observer was confounded with farm (Table 1), therefore only farm was included in the model. If the LS×farm interaction was insignificant, the model was re-run without the interaction. Cow (m=1,…, 348) was included as random effect, and e ijklm was the residual effect.
Results
PCA
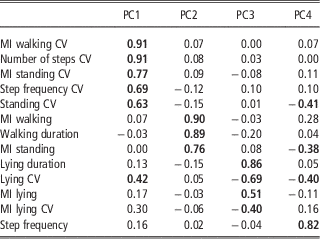
With 13 PC in the model, the PC with an eigenvalue above 1 accounted for 27%, 18%, 12% and 10% of variation in the observed data, respectively. Table 2 shows the four rotated PC and the loadings of the accelerometer variables. In general, there was a strong pattern of loadings, albeit with some complexity present. Thus, most variables loaded heavily (meaning that the loading was above 0.30 or below −0.30) on one PC only. However, Standing CV, MI standing and Lying CV had loadings above 0.30 on more than one PC. PC1 was equivalent to Activity variability due to heavy loading by CV parameters related to standing and walking, namely MI walking CV, number of steps CV, MI standing CV, step frequency CV and standing CV. PC2 was equivalent to Activity level due to heavy loading by MI walking, MI standing and walking duration. PC3 was equivalent to Recumbency due to heavy loading by all the lying-related variables. PC4 was equivalent to Stepping due to high loading of stepping frequency, however, PC4 was also loaded upon by Standing CV, MI standing and Lying CV, making the interpretation of this PC less straightforward.
The four principal components (PC) with their corresponding accelerometer loadings, the heavy loadings (i.e. loading>0.30 or <−0.30) within accelerometer variable in bold

MI=motion index; CV=coefficient of variation.
Mixed effects on PC
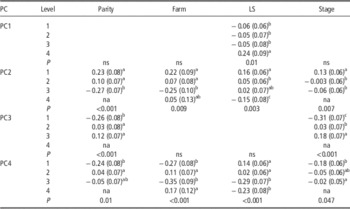
The significant effects of LS, farm, parity and lactation stage (lactation stage 1: ⩽100 days, 2: >100 to ⩽200 days and 3: >200 days in milk) on the four PC are shown in Figure 1 with details given in Table 3. The LS×farm interaction was insignificant for all four PC and therefore omitted from the mixed model. Activity variability at LS4 was significantly higher than at the other LS. Activity level decreased significantly with increasing LS. Activity level was significantly lower on farm 3 compared with farms 1 and 2. Activity level in early lactation was higher than during mid and late lactation, and Activity level was significantly higher during parities 1 and 2 compared with parity 3+. Recumbency was unaffected by LS. Recumbency increased significantly from early through mid and late lactation. Recumbency was significantly higher in parity 3+ compared with parities 1 and 2. Stepping was significantly lower at LS3 and LS4 compared with LS1 and LS2. Also, Stepping on farms 1 and 3 was significantly lower than on farms 2 and 4. Stepping was significantly lower in parity 1 than in parity 2, and significantly lower in early lactation compared with late lactation (Table 3).
PC2 (Activity level, lower left) and PC4 (Stepping, lower right) relative to locomotion score and grouped by farm, PC1 (Activity variability, upper left) relative to locomotion score and PC3 (Recumbency, upper right) relative to days in milk and grouped by parity. The 95% confidence limits are indicated with the same symbol as their corresponding means. Lactation stage (1) ⩽100 days, (2) >100 to ⩽200 days and (3) >200 days in milk. Y-axes are mean score of the PCs with percentage explained variation accounted for in parenthesis. PC=principal components.

PC least square means (s.e.)

PC=principal component; ns=not significant, na=not applicable, LS=locomotion score.
Only significant (P<0.05) results are reported.
a,b,cDifferent superscripts signify significantly different levels within column.
Mixed effects on accelerometer variables
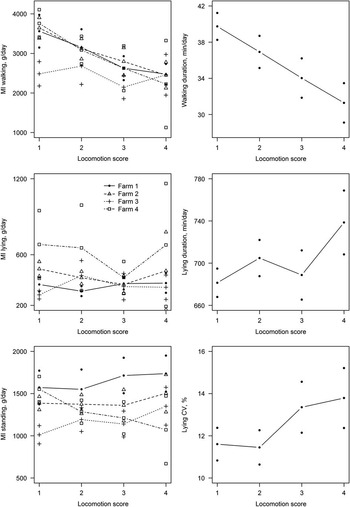
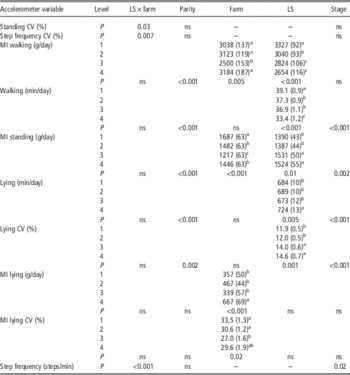
MI walking, MI lying and MI standing are shown in Figure 2 (left column; significant farm-effect), and walking duration, lying duration and lying CV are shown in Figure 2 (right column; no significant farm-effect) with details given in Table 4. With respect to lameness effects, increasing degree of lameness significantly decreased MI walking and walking duration already when LS increased from LS1 to LS2. MI lying was unaffected by LS. Lying duration was significantly longer at LS4 compared with the other LS. MI standing and lying CV were significantly elevated at LS3 and LS4 compared with LS1 and LS2.
MI walking (g/day), MI lying (g/day) and MI standing (g/day) relative to locomotion score and grouped by farm (left column from the top). Walking duration (min/day), lying duration (min/day) and lying CV (%) relative to locomotion score (right column from top). The 95% confidence limits are indicated with the same symbol as their corresponding means. MI=motion index.

Accelerometer variable least square means (s.e.) reporting only significant (P<0.05) results for farm and locomotion score (LS)

ns=not significant.
a,b,cDifferent superscripts signify significantly different levels within column.
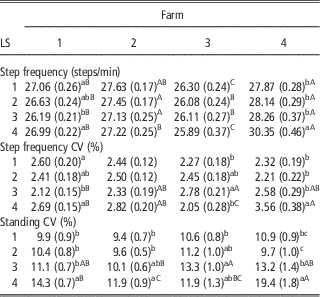
Regarding farm effects, MI walking was significantly lower on farm 3 compared with the other farms. MI lying was significantly higher on farm 4 compared with the other farms. MI standing was highest on farm 1, intermediate on farms 2 and 4 and lowest on farm 3. MI lying CV (Table 4) was significantly higher on farms 1 and 2 than on farm 3, whereas farm 4 did not differ from the other farms. Step frequency, step frequency CV and standing CV, which had a significant LS×farm interaction, are reported in Table 5. Thus, step frequency and step frequency CV at LS4 were higher on farm 4 than on the other farms. Further, step frequency and step frequency CV on farm 4 were higher at LS4 than at the other LS.
Least square means (s.e.) for step frequency, step frequency CV and standing CV of the significant interactions between farm and locomotion score (LS)

a,b,cDifferent superscripts signify significantly different levels between LS (column).
A,B,CDifferent superscripts signify significantly different levels between farm (row).
Number of steps CV, MI walking CV and MI standing CV were unaffected by LS, farm, parity and lactation stage, consequently, they are not reported. The effects of parity and lactation stage are not reported for the accelerometer variables, because these effects were not the main focus of our study.
Discussion
Lameness effects on accelerometer activity
To the best of our knowledge, our results are the first to show that accelerometer-based measurements of cows’ leg activity on commercial farms differ between non-lame cows and cows with different degrees of lameness. We found that the lying duration of non-lame cows (LS1) was 684 min/day, which increased by 40 min/day in lame cows (LS4). This increase confirms the results of others that (severely) lame cows have longer daily lying duration than normal to moderately lame cows (Ito et al., Reference Ito, von Keyserlingk, LeBlanc and Weary2010; Blackie et al., Reference Blackie, Bleach, Amory and Scaife2011; Thomsen et al., Reference Thomsen, Munksgaard and Sørensen2012). In addition, the decrease in walking duration from 39.4 min/day in healthy cows to 33.4 min/day in lame cows is in agreement with the literature (Walker et al., Reference Walker, Smith, Routly, Jones, Morris and Dobson2008).
MI walking decreased with increasing degree of lameness, which may signify that lame cows walk slower or less energetically than non-lame cows. Chapinal et al. (Reference Chapinal, de Passillé, Pastell, Hänninen, Munksgaard and Rushen2011) found no correlation between lameness and total acceleration while walking (which is equivalent to our MI walking), possibly due to their small number of cows or short measuring periods. However, they found that total acceleration measured at the leg while walking was a good proxy for speed (Chapinal et al., Reference Chapinal, de Passillé, Pastell, Hänninen, Munksgaard and Rushen2011). Other studies have shown that lame cows walk more slowly than healthy cows (Telezhenko and Bergsten, Reference Telezhenko and Bergsten2005; Blackie et al., Reference Blackie, Bleach, Amory and Scaife2011). Considering this, our results and those of Chapinal et al. (Reference Chapinal, de Passillé, Pastell, Hänninen, Munksgaard and Rushen2011) seem to suggest that MI walking calculated from leg-mounted accelerometers may be a good lameness indicator. We found that MI standing was higher at LS⩾3 than at LS⩽2, whereas MI lying was unaffected by LS. Being obtained from leg-mounted accelerometers, these results suggest that lame cows were more restless than non-lame cows when standing, whereas leg-activity while lying did not differ between non-lame and lame cows. Similarly, lame cows have been found to kick and step more than non-lame cows during milking (Pastell et al., Reference Pastell, Hautala, Poikalainen, Praks, Veermae, Kujala and Ahokas2008).
Apart from lameness, other factors may affect activity, for instance clinical mastitis may increase activity (Fogsgaard et al., Reference Fogsgaard, Bennedsgaard and Herskin2014). Further, oestrus increases activity for about half a day (Walker et al., Reference Walker, Smith, Routly, Jones, Morris and Dobson2008). Unfortunately, oestrus and health records were unavailable at the time of analysis, therefore disease and oestrus occurrences are possible minor sources of variation in our data. For example, when a cow is in heat, her activity would be increased for a short while, and not accounting for this may possibly lower the degree of lameness as measured by the accelerometer. We recommend that future studies include information about oestrus and health status to minimise sources of error when detecting lame cows.
Farm effects on accelerometer activity
Not surprisingly, some PC and accelerometer variables differed between farms. Activity level was lowest on farm 3. More specifically, cows on farm 3 had the lowest MI walking and MI standing, whereas farm 4 had the highest MI lying. MI lying CV was higher on farms 1 and 2 than on farm 3. In addition, there were LS×farm interaction effects on standing CV, step frequency CV and step frequency. Also, the proportion of lame cows differed between farms with approximately twice as large a proportion of cows with LS4 on farm 1 compared with the other farms (Table 1). Certainly, farm-specific factors, such as time spent waiting to be milked, stocking density, floor type, cubicle type, housing of sick individuals and pen design need to be considered when comparing activity measurements from different farms.
PCA
PC1 (Activity variability) explained 27% of the total variation in data, and because all the accelerometer variables that related to variation, namely the CV variables, loaded heavily on PC1, this study confirmed that the variability of within-cow variation was large. In an automated lameness detection context, this means that using the cow as her own control is better than comparing with a baseline established for a normally walking cow, as also noted by Alsaaod et al. (Reference Alsaaod, Römer, Kleinmanns, Hendriksen, Rose-Meierhöfer, Plümer and Büscher2012). Also, lame cows (LS4) exhibited much more Activity variability compared with cows with lower LS. This increased variability due to lameness agrees with another study showing that the standard deviation of the weight applied to hind legs decreased in lame (LS>3) cows after lameness relieving ketoprofen injections (Chapinal et al., Reference Chapinal, de Passillé, Rushen and Wagner2010). In addition, gait variability increased from healthy cows (score 1 on a scale from 1 to 3) to mildly lame cows (score 2) as measured by a pressure mat (Van Nuffel et al., Reference Van Nuffel, Vangeyte, Mertens, Pluym, De Campeneere, Saeys and Van Weyenberg2013). Indeed, Activity variability within cow seems to carry important information useful for lameness detection, and calls for further investigation.
We have been unable to find similar PC in the literature, thus impeding direct comparison with other studies. Nevertheless, our PCA revealed pertinent combinations of activity variables that could be used to create a prediction index, like shown for metritis detection (Gorzecka et al., Reference Gorzecka, Callesen, Pedersen and Friggens2011). In our study, PC2 (Activity level) decreased with increasing degree of lameness, differing already between LS1 and LS2. This means that MI walking and walking duration, which contributed with the major loadings on PC2, may be particularly well suited for detecting the early onset of lameness. PC4 (Stepping) distinguished between normal and mildly lame cows (LS1 and LS2) v. moderately and severely lame cows (LS3 and LS4), and therefore seemed to be less sensitive than Activity level in lameness detection. PC3 (Recumbency), however, was unaffected by LS, and so did not contribute with added information to lameness detection.
In conclusion, our analysis of activity variables derived from leg-mounted accelerometers revealed one PC capable of distinguishing the early onset of lameness. Our analysis also revealed a large amount of individual variation in activity variables, which was higher in severely lame cows. Regarding single activity variables, total acceleration while walking and walking duration seem particularly sensitive for early lameness detection. Increased restlessness, as measured by total acceleration while standing, may be an important symptom of more severe degrees of lameness. Lameness detection models comprising total acceleration while walking and standing and not least walking duration should be investigated further.
Acknowledgements
V. M. Thorup has received the support of the European Union, in the framework of the Marie-Curie FP7 COFUND People Programme, through the award of an AgreenSkills’ fellowship (under grant agreement n° 267196). This study was part of the ERA-net project DAIRY-ICT. The project was financially supported by the Ministry of Food, Agriculture and Fisheries of Denmark, the Danish Cattle Federation and Aarhus University. The authors wish to thank the following technicians at Aarhus University, Department of Animal Science, for performing the LS assessments: J. M. Obidah, P. Poulsen and N. H. Thomsen.