

1. Introduction: Terminology, Research Questions and Hypotheses
In the Oxford English Dictionary the term ‘dialect’ is defined as “a variety of a language that is a characteristic of a particular group of the language’s speakers.” Usually the speakers are found in a geographically limited part of a language area which is ‘roofed’ by a structurally related standard variety. Several geographically adjacent dialects typically form a ‘dialect continuum’, which is described by Chambers & Trudgill (Reference Chambers and Trudgill1998:5) from the perspective of a traveler:
If we travel from village to village, in a particular direction, we notice linguistic differences which distinguish one village from another. Sometime the differences will be larger, and sometimes smaller, but they will be cumulative. The further we get from our starting point, the larger the differences will become.
Like all living language systems, dialects are constantly changing (Auer, Hinskens & Kerswill, Reference Auer, Hinskens and Kerswill2005), and consequently, dialect landscapes do so as well. Both the mutual relationship between dialects and their relationship to the overarching standard variety may change. Dialect convergence can be defined as the increase in similarity between dialects, with “partial similarities increasing at the expense of differences” (Weinreich, Reference Weinreich1954:395). Processes leading to convergence affect the structure of (dialect or standard) varieties and thus that of the diasystem and linguistic repertoires they are part of; these processes result in unification, focusing and homogenization of the linguistic repertoire. Dialect divergence is a decrease in similarity between dialects, which amounts to linguistic diversification, growing diffusion and heterogenization—although it may lead to focusing in a repertoire, making the surviving varieties more distinct from each other. Convergence and divergence are relational concepts, affecting the degree of structural distance between dialects.
A koine is a lingua franca which incorporates features of various dialects; koines mostly develop through dialect mixing, simplification and reduction (cf. Hinskens, Auer & Kerswill, Reference Hinskens, Auer and Kerswill2005:11; Kerswill, Reference Kerswill2002; Siegel, Reference Siegel1985, Reference Siegel2001; Trudgill, Reference Trudgill1986). A koine is thus a compromise dialect. In the processes which give rise to koines, reduction consists of the elimination of the most peculiar features of the constituent dialects; typically these are local features, but of course features can also be involved which are specific to different community types, such as neighborhoods. Siegel (Reference Siegel2001) distinguishes between regional koines and immigrant koines. The notion of regiolect was coined in 1983 by the Dutch dialectologist Hoppenbrouwers. In Hoppenbrouwers’ conception, a regiolect is a continuum of subtly different intermediate varieties in the structural space between the traditional dialects and the standard variety (cf. Bellmann’s (Reference Bellmann1996) diaglossia); the various intermediate varieties form a continuum between the traditional dialects and standard Dutch. Meanwhile, the notion of regiolect has become important in European sociodialectological studies, though many use it to refer to the result of specifically cross-dialectal convergence, a regional koine. In German dialectology, the notion ‘Ausgleichdialekt’ is sometimes used to refer to this type of variety.
There exist several quantitative studies which focus on dialect change, which is frequently expressed in terms of convergence to the standard variety. Examples for the Dutch language area are Giesbers (Reference Giesbers2008), Heeringa & Hinskens (Reference Heeringa and Hinskens2014), Heeringa & Nerbonne (Reference Heeringa and Nerbonne2000) and Heeringa, Nerbonne, Niebaum, Nieuweboer & Kleiweg (Reference Heeringa, Nerbonne, Niebaum, Nieuweboer and Kleiweg2000).
Heeringa & Nerbonne (Reference Heeringa and Nerbonne2000) used material collected by Winkler in 1874 and Scholtmeijer in 1996 on a range of Dutch dialects, and found that 23 of the 41 varieties studied have converged towards standard Dutch at the level of the sound components, i.e. phonetics, phonology and morpho-phonology.
Heeringa et al. (Reference Heeringa, Nerbonne, Niebaum, Nieuweboer and Kleiweg2000) studied eight varieties spoken in or close to the German county of Bentheim, along with nine neighbouring Dutch varieties, using data from the Reeks Nederlandse Dialectatlassen ‘Series of Dutch dialect atlases’ (Blancquaert & Pée, 1925-Reference Blancquaert and Pée1982) that was gathered in 1974-1975, as well as new data collected in 1999. These 17 varieties were compared to standard Dutch and standard German at the level of the sound components. All of the Dutch dialects were found to be converging towards standard Dutch, while all German dialects studied appeared to be converging towards standard German.
Giesbers (Reference Giesbers2008) studied the Kleverland dialect continuum, which extends from Duisburg in Germany to Nijmegen in the Netherlands. In the early 19th century, the Dutch-German national border was drawn through this dialect continuum, and Giesbers studied five dialect pairs, each of which consisted of a Dutch and a German local dialect. Giesbers found that Dutch varieties have converged more strongly towards standard Dutch than the German ones have towards standard German, both at the lexical and sound components levels. Particularly on the lexical level, German speakers seem to preserve more old dialect forms than their Dutch counterparts.
Heeringa & Hinskens (Reference Heeringa and Hinskens2014) measured dialect change in apparent time. Between 2008 and 2011, they compiled a large corpus database of dialect recordings for 86 local dialects spoken in the Netherlands and the northern part of Belgium (‘Flanders’) and of Standard Netherlandic Dutch and Standard Belgian Dutch. In each of the 86 locations, two older male speakers and two younger female speakers were recorded. Comparing the dialect use of the older male speakers with that of the younger females, they measured dialect change in apparent time, focusing on lexis, morphology and sound components. They found that (a) dialect change is a geographically capricious process, and (b) the lexical level has been affected the most, while the morphological level is the most stable. While dialects in the Netherlands appear to be converging significantly towards standard Dutch, this is not the case for the Belgian dialects. Dialects have in general converged towards each other. The number of different dialect groups has slightly increased at the lexical level, and decreased at the morphological sound component levels.
In the studies mentioned here, dialects are shown to converge to their overarching standard varieties. Although the studies make clear that dialect change is at least partly the result of convergence to the standard variety, they do not establish to what extent dialect change is a matter of convergence to the standard variety. Furthermore, it remains unclear to what extent dialect change involved divergence from the standard variety.
In Heeringa & Hinskens (Reference Heeringa and Hinskens2014), dialects have already been shown to converge to each other. The question may arise whether there exists a relationship between convergence to the standard variety and convergence between dialects. To what extent does convergence to the standard variety make dialects more similar to each other?
Whereas dialect continua are the residue of language history (some of which is still visible in the present-day dialect landscape), the dynamics in the relationships between the standard variety and the dialects on the one hand and among the dialects on the other hand are occurring today, and they constitute the object of the present study.
The current paper builds further on the work of Heeringa & Hinskens (Reference Heeringa and Hinskens2014), using the same database which contains recordings of 86 Dutch local dialect varieties. In this paper we analyze and visualize the influence of standard Dutch on these dialects. We will focus on variation in the sound components and test the following hypotheses:
-
1. Dialect change is mainly the result of convergence to standard Dutch.
-
2. Sound changes in two dialects which make them converge to standard Dutch make them also closer to each other.
-
3. Sound changes in two dialects which make them diverge from standard Dutch make them also more distant from each other.
We will test these hypotheses using quantitative methods. In Section 2, we describe the data that form the basis of this study. In Section 3, we will test the hypotheses, and in Section 4 we draw our conclusions and present some proposals for future studies.
2. Collecting and Analyzing the Data
2.1 Collecting
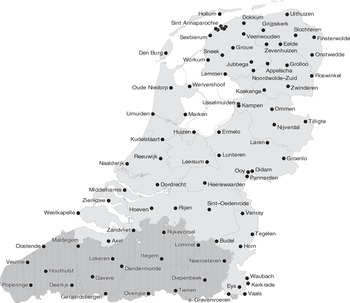
Between 2008 and 2011, we compiled a large corpus database of dialect recordings for 86 local dialects and three standard varieties, namely Standard Netherlandic Dutch, Standard Belgian Dutch, and Afrikaans; the latter will not concern us in the present paper. The dialects are evenly spread over the Dutch and Frisian language areas and represent the major dialect regions (see Map 1). The Dutch language area comprises both the Netherlands and the northern part of Belgium (or ‘Flanders’). Five of the recordings have been made by Stichting Ons Bildt Footnote 1 , and represent the varieties of Frisian spoken in Westhoek, Sint Jacobiparochie, Nij Altoenea, Vrouwenparochie and Oudebildtzijl. Along with Sint Annaparochie, they are shown as a dense cluster of dots in the north-west of Frisia, close to the coast.
Dialect change in this paper is measured in apparent time. For this purpose, at least two male speakers aged 60 or older, and two or more female speakers aged between 20 and 40 were recorded in each of the 86 locations. The males represent the older phase of the dialect variety at issue and the females the newer phase. The reasoning for this is that we assume that there is a scale of conservativeness, where older males are the most conservative speakers, followed by the older females, who are in turn followed by the younger males. The younger females, meanwhile, are the least conservative speakers. In general, the speech of young speakers tends to be more innovative than that of older members of their speech community. In addition, according to Romaine (1984:113), the speech of females is usually more innovative than that of males: “women consistently produce forms which are nearer to the prestige norm more frequently than men” (see also Labov, 1990:206; Chambers, 1995:102-103; for the Dutch language area e.g. Boves & Gerritsen, Reference Boves and Gerritsen1995:195-226).Footnote 2 At first sight, it may look as if the dimensions of age and gender are intertwined, but they can in fact be reduced to just one: innovativeness, with older males at one extreme and younger females at the other.
Using the approach set out above, we abstract from potentially socially bound dialect-internal variations in order to broaden the study in dialect geographical respects. This enables us to gain greater insight into the present-day dynamics of the Dutch dialect landscape at large.
An episode of the Charlie Chaplin movie ‘The Kid’ served as the basis of the recordings we made. This part of the film focuses on a neighborhood where many windows suddenly get broken. By accident (or so it seems), a glazier is walking around in the same area and is very keen to carry out the necessary repairs. Meanwhile, a policeman tries to find out why so many windows were broken in such a short period of time. At some point, he sees a little boy who is just about to throw a stone at a window. The policeman then realizes that the child is doing this on the orders of the glazier; the policeman tries to catch both protagonists but is unable to do so.
The story was presented to our dialect speakers by way of stills from the movie as well as in narrative form, presented in written form in the standard variety. The episode can be regarded as a cross-section of plain, simple daily spoken language, and consists of 23 sentences, each containing an average of 7.6 words. We used a selection of 13 sentences for this study, which include a maximum of 125 words in the written standard Dutch version of the text. 90 different word types (lexical forms) are represented.Footnote 3 Both the older male and the younger female speakers operated in small groups. The number of informants per group varied between two and four, but in the overwhelming majority of cases a small group consisted of two people. When a small group was being recorded, the individuals were first asked to write down a translation of the text in their own dialect, independently of each other. Then, they compared their translations and discussed the differences between them. For each difference, they had to decide which alternative was the better version. They were then asked to write a new dialect translation together, which might be seen as a consensus version upon which both of them agreed; this approach helped us to counter the observer’s paradox as well as to reduce potential idiolectal noise as much as possible. Finally, they both (or all three or four) read this third version of the text aloud.
Additionally, we created recordings in Standard Netherlandic Dutch (read out by Maartje van Weegen, host of the Dutch national classical radio station), Standard Belgian Dutch (by Martine Tanghe, Belgian presenter of the Flemish public broadcast station, VRT) and Standard Afrikaans (by Marriëtta Kruger, presenter at the South African television channel, SABC 2).Footnote 4 The Dutch and Flemish standard speakers read the standard Dutch text aloud, and the South-African standard speaker read the Afrikaans text aloud. They were all aged between 50 and 60 when they were recorded, thus being in an intermediate position between the older male and the younger female dialect speakers.Footnote 5 In their respective speech communities, the three presenters from the national public radio/TV are generally considered as models for ‘correct’ Dutch/Afrikaans. In this paper, the Standard Netherlandic Dutch recording is used only; we refer to it as standard Dutch throughout the paper. The present study is thus based on one older male consensus dialect version and one younger female dialect version of the story for each single local dialect, plus the standard variety version.
Subsequently, the first author made phonetic transcriptions of the recordings in order to measure dialect change, changes in the relationships among dialects, and changes in the relationship to standard Netherlandic and Belgian Dutch. Usually, two recordings of the consensus dialect version of the story were produced for both the older males and the younger females. Since phonetic transcription is time-consuming, only one recording per group was transcribed. When selecting which recording to use, we had a preference for the speaker who was the most autochthonous (established through their geographical background and that of their parents), had the clearest voice, and read the text most fluently. The transcriptions were made in IPA and digitized in X-SAMPA.
2.2 Analyzing
In Section 1, we hypothesized that dialect change is mainly the result of convergence to standard Dutch. In order to test this hypothesis, a further analysis of the dialect change measurements is required. We need to split the measurements into 1) a part which is the result of sound changes which make a dialect converge to standard Dutch, and 2) a part which is the result of sound changes which make a dialect diverge from standard Dutch. When the first part is significantly larger than the second part, we have proved that our hypothesis is true.
In Section 2.2.1, we explain how we measure dialect change. In Section 2.2.2, we discuss the methodology with which we split the dialect change measurement into two parts. In Section 2.2.3, we present some further considerations concerning the complexity of the methodology. In Section 2.2.4, we measure changes of the relationships between dialects and again show how to split those measurements into two parts.
2.2.1 Measuring Dialect Change
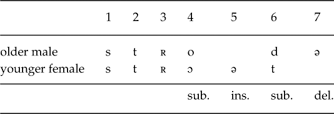
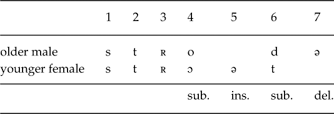
The extent to which a given dialect has changed in regards to the sound components is measured by comparing the transcriptions of the old male speakers with the transcriptions of the young female speakers. Comparisons are made with the aid of the Levenshtein distance metric (Levenshtein, 1966). This algorithm was introduced into dialectology by Kessler in 1995. The Levenshtein distance between two phonetic strings is calculated as the ‘cost’ of the total set of insertions, deletions and substitutions needed to transform one string into another (Kruskal, 1999). In the original, simplest form of the algorithm, all operations have the same cost, e.g. 1. We illustrate this with an example. In Diepenbeek the older male speaker pronounced straat ‘street’ as [stʀoːdə] and the younger female speaker pronounced the same word as [stʀɔət]. When ignoring potential suprasegmentals and diacritics, the Levenshtein algorithm will take the alignment as shown in Table 1 as a basis for the distance calculation. We obtain a total cost of 4 operations (two substitutions, an insertion and a deletion), and the alignment length is equal to 7.
Alignment of the realization of the dialect variant of ‘street’ of an older male speaker with the realization of the younger female speaker. The lowest line give the operations needed to change the first realization into the second one.
In this paper, with respect to the cost of the operations needed to establish segment distances, we used graded weights that are effectively segment distances, meaning that the pair [i,ɒ] is seen as being more different than the pair [i,ɪ]. The segment distances are obtained on the basis of acoustic representations of a canonical set of IPA samples (see Heeringa, Reference Heeringa2004:79-119).
A restricted set of diacritics was used in the transcriptions for this study
and processed by the distance measure. We did this for the palatalization of
final /n/ ([nj]), the
velarization of initial l ([lɣ])
and nasalization (for example [
 $\tilde{{\varepsilon}}$
]). When a given segment was compared to a
palatalized segment, the segment distance was averaged by the distance
between the segments in question and [j]. So, for
example, the distance between [t] and
[nj] is equal to the average of the
distance between [t] and [n] and
between [t] and [j]. In the case
of a comparison with velarized and nasalized segments, the distances were
averaged by the distances to [ɣ] and
[n], respectively.
The Levenshtein algorithm is adapted when it comes to dealing with syllabification in words, meaning that only a vowel can be matched with a vowel and a consonant with a consonant. The glides [j] or [w] may also match with a vowel (or vice versa), and [i] or [u] with a consonant (or vice versa). A central vowel (in our research only schwa) may be matched with a sonorant (or vice versa) or a full vowel (since schwa is the reduced vowel). In this way, unlikely matches (e.g. [p] with [a]) are precluded.
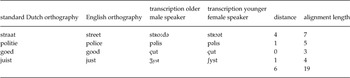
Distances are calculated between the members of a pair of variants that are lexically and morphologically identical. We used normalized distance measures, calculating the aggregated distance between two dialects as the sum of a maximum of 125 word pair distances divided by the sum of the alignment lengths that correspond to the word pairs. We illustrate this with an example in which we measure dialect change in the dialect of Diepenbeek by comparing a subset of four word realizations by the older male speaker with a set containing the corresponding word realizations by the younger female speaker (see Table 2).
Calculation of dialect change in Diepenbeek on the basis of four word pairs.

In this example, for didactic reasons we use binary (rather than scalar or gradient) operation weights: insertions, deletions and substitutions count as 1 and matches count as 0. The Levenshtein distances are found in the fifth column and the corresponding alignment lengths in the sixth. The sum of the Levensthein distances of the four word pairs is 6, and the sum of the alignment lengths is 19. The amount of dialect change is calculated as a percentage: 6 divided by 19, multiplied by 100=31.6%. However, rather than using binary operation weights, we use graded operation weights throughout this paper, as mentioned above. These weights vary between 0 and 1.
Dialect change measurements are based on 125 word pairs (fewer if words were missing). We found that all 125 words vary in terms of the sound components across the dialects. Several words appeared in the text more than once; for example, the word straat ‘street’ appeared three times. So, when calculating dialect change, for straat each of the corresponding word pair distances counted for one third. In this way, each word pair was weighed. The sum of the weights was 90, which is the number of the different word types.
Dialectometry and Levenshtein distances have meanwhile become common in some lines of sociolinguistic literature; evidence supporting the overall usefulness of these methods in comparing dialects includes the match between Levenshtein measurements with the outcomes of perception tests, as in e.g. Gooskens & Heeringa (Reference Gooskens and Heeringa2004).
Using the Levenshtein distance, the apparent time change of a particular dialect in the sound components was measured by comparing the phonetic realization of the words by the older male informants with the realization of the same words by the younger female participants. Word pairs are only considered when the realizations are lexically and morphologically the same. Besides, the realizations should be lexically and morphologically identical to the corresponding word used in the standard Dutch text. This is done so in order to obtain results which are comparable in every relevant dimension.
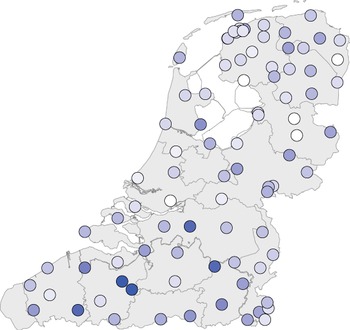
The results are presented in Map 2. Individual local dialects are represented by dots in each of the maps. The darker a dot, the more the dialect has changed. It is difficult to recognize particular patterns in and similarities across the dialects. Indeed, it seems that dialect change is a capricious process, and that no particular regional area has changed more than others. The average dialect change is equal to 13.3% with a standard deviation of 3.8%.
2.2.2 Relating Dialect Change to Change in the Relationship to Standard Dutch
The Levenshtein distance in its original form is two-dimensional. The algorithm, explained above in 2.2, compares two strings with each other and finds the least costly set of operations which map the one string onto the other. We explained the algorithm briefly in Section 2.2.1. When measuring dialect change, word pairs are compared to each other by the algorithm. Each word pair consists of the realization of an older male and a younger female.
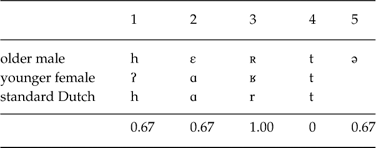
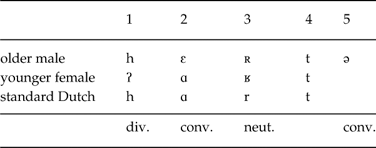
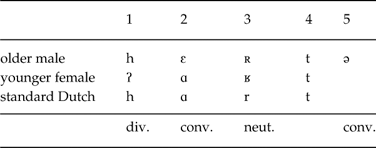
In this study we want to distinguish between sound changes which cause a dialect to converge to standard Dutch, sound changes which cause a dialect to diverge from standard Dutch, and sound changes which do not affect the relationship to standard Dutch. In order to make this three-way distinction, we need to take into account a third realization which is aligned with the other two, namely the realization in standard Dutch. In other words: we need a three-dimensional Levensthein distance, since three realizations need to be aligned to each other: older male vs. younger female vs. standard Dutch. We illustrate this by a hypothetical example. Assume in some dialect the standard Dutch word hart ‘heart’ is pronounced as [hɛrtə] by the older male speaker and as [ʔʔɑrt] by the younger female speaker. The standard Dutch pronunciation is [hɑrt]; although the variants of /r/, which mainly differ in their place of articulation, are not mutually ranked in terms of prestige or ‘standardness.’ The three realizations need to be aligned as is shown in Table 3.
Alignment of three realizations: older male vs. younger female vs. standard Dutch. The operation weights are given on the bottom line.
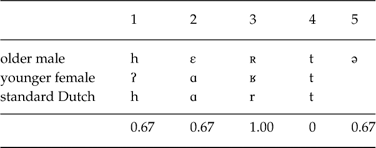
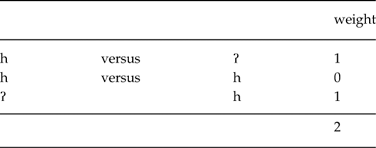
The alignment consists of five slots. The operation weights of each of the five slots are calculated by considering all pairs of segments within the slot. Per slot there are three pairs: older male versus and younger female, older male versus standard Dutch, and younger female versus standard Dutch. When using binary weights, we get the comparisons in the first slot as shown in Table 4.
Comparisons in the first slot. The sum of the weights is 2.
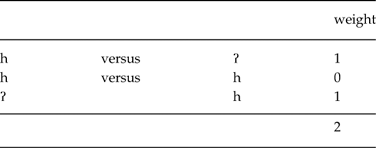
The sum of the weights is equal to 2. Since there are three segment pairs, we calculate the average operation weight of the first slot as 2/3=0.67. For the sake of simplicity, we used binary weights here, but as explained in Section 2.2.1 the results in this paper are obtained on the basis of measures which use graded weights, varying between 0 and 1.
When inspecting the alignment in Table 3, we find two sound changes which cause the dialect to converge to standard Dutch (slots 2 and 5), one sound change which causes the dialect to diverge from standard Dutch (slot 1), and one sound change which does not affect the relationship of the dialect to standard Dutch (slot 3, see Table 5). The amount of change as the result of convergence to standard Dutch is 0.67+0.67=1.34 (cf. Table 3), the amount of change as the result of divergence from standard Dutch is 0.67, and the amount of change not affecting the distance to standard Dutch is 1.00.
Two sound changes cause the dialect to converge to standard Dutch; one sound change causes the dialect to diverge from standard Dutch, and one sound change does not affect the relationship to standard Dutch.
Just as for the dialect change measurements in Section 2.2.1, we use normalized distance measures. We calculate the aggregated sound change due to convergence to standard Dutch as found for the maximally 125 word pairs and divide them by the sum of the alignment lengths that correspond to the word pairs. The same procedure applies mutatis mutandis (the same) for dialect measurements on the basis of sound changes which cause a dialect to diverge from standard Dutch or which do not affect the relationship to standard Dutch.
2.2.3 Complexity
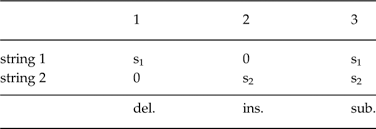
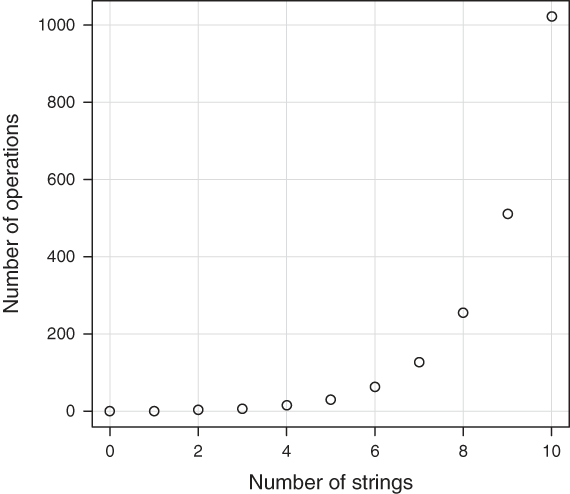
As we mentioned above, the original Levenshtein distance, as considered by Vladimir Levenshtein in 1965, is two-dimensional, since it compares two strings with each other. Given string 1 and string 2, there are three possible edit operations: deletion of an element in string 1, insertion of an element in string 2, and substitution of an element in string 1 by an element in string 2. This is schematically shown in Table 6; ‘s’ stands for (sound) segment. The number of operations is equal to 2 n –1, where n is the number of strings to be compared. When two strings are compared, the number of operations is 22–1=3.
Two-dimensional Levenshtein distance has three operations: an element in string 1 (s1) can be deleted, an element in string 2 (s2) can be inserted, and an element in string 1 (s1) can be substituted by an element in string 2 (s2).
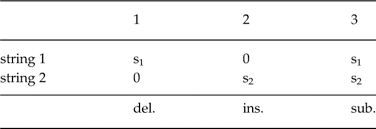
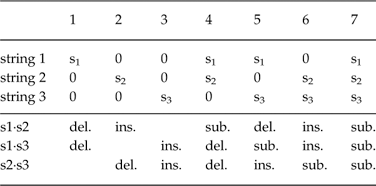
In this paper we use a three-dimensional variant of Levenshtein distance. The number of operations is 23–1=7. The operations are schematically shown in Table 7. Each operation is actually a combination of three operations, where each of the three operations is an insertion, deletion or substitution. For example, in the seventh slot element s1 in string 1 is substituted by element s2 in string 2, and by element s3 in string 3 and element s2 in string 2 is substituted by element s3 in string 3. Therefore the operation for this slot consists of three substitutions. In the fourth slot element s1 in string 1 is substituted by element s2 in string 2, and both element s1 and element s2 are deleted in string 3. The operation includes one substitution and two deletions. As we saw in Section 2.2.1 we calculate the average weight as the average of the three operation weights.
Three-dimensional Levensthein has seven operations.
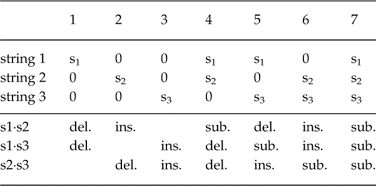
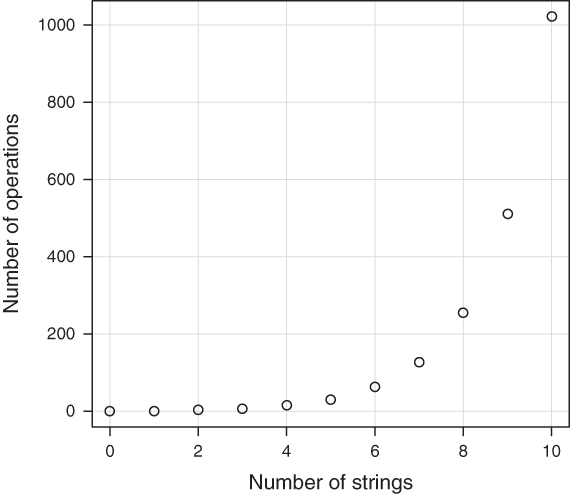
When considering multidimensional Levenshtein distance, we find that the number of operations increases exponentially, as shown in Figure 1. Four-dimensional Levenshtein distance has 15 operations and five-dimensional Levenshtein distance has 31 operations.
The number of operations in a multidimensional Levensthein distance increases exponentially with the number of dimensions (2n–1), i.e. the number of strings that is simultaneously considered by the algorithm.
2.2.4 Measuring Changes of the Relationships between Dialects
In Section 1, we hypothesized that sound changes in two dialects which make them converge to standard Dutch, make them also grow closer to each other (second hypothesis), and that sound changes in two dialects which make them diverge from standard Dutch, make them also more distant from each other (third hypothesis). In order to test these hypotheses we measure convergence/divergence due to sound changes in the dialects—the sound changes in A corresponding with the ones in B, i.e. each of the sound changes in A are found in the same word at the same position as the sound changes in B—which cause both A and B either to converge to standard Dutch (measurements of second hypothesis) or to diverge from standard Dutch (measurements of third hypothesis)
When considering dialect pair A/B, per word under consideration we need to align the realizations of the older male speaker of dialect A, the younger female speaker of dialect A, the older male speaker of dialect B, the younger female speaker of dialect B, and standard Dutch. For this purpose we use a five-dimensional Levenshtein distance, since five realizations need to be aligned to each other.
We illustrate the use of the five-dimensional Levenshtein distance by means of a hypothetical example. We measure the amount of change in the relationship between dialects A and B which amounts to the convergence to standard Dutch of both A and B, and we measure the amount of change in the relationship between dialects A and B which diverge from standard Dutch of both A and B. Assume the following realizations:

The five-dimensional Levenshtein will align the realizations as follows:

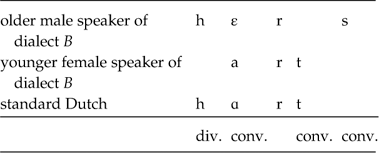
When focusing on dialect A we find one sound change which causes divergence from standard Dutch, and three sound changes which cause convergence to standard Dutch:
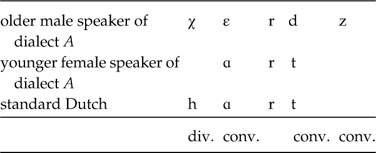
When focusing on dialect B again we find one sound change which causes divergence from standard Dutch, and three sound changes which cause convergence to standard Dutch:
When comparing dialect A with dialect B we find three slots where dialects A and B converge to each other and one slot where dialects A and B diverge from each other:

We can summarize the results as follows:
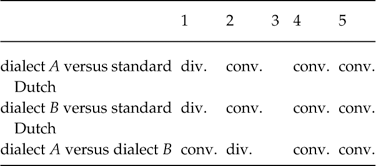
In order to test the second hypothesis we focus on those slots where both dialects A and B converge to standard Dutch. These are slots 2, 4 and 5. For each of these slots we calculate weights as follows:
 $$\Delta ({\rm sound}\,A_{{older\,male}} ,{\rm sound}\,B_{{older\,male}} )-\Delta ({\rm sound}\,A_{{younger\,female}} ,B_{{younger\,female}} )$$
where Δ is the segment distance which is described in Section 2.2.1. A weight will be positive for a slot which represents convergence between dialects A and B, and negative for a slot which represents divergence between dialects A and B. Since Δ varies between 0 and 1, a weight will vary between −1 and 1. The results which are presented in this paper are based on these gradual weights. For the sake of simplicity, in this explanation we assign a weight of 1 to slots which represent convergence and −1 to slots which represent divergence:
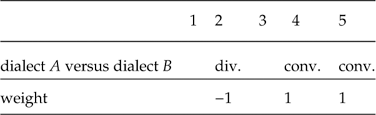
The amount of change in the relationship between dialects A and B is calculated as the sum of the weights divided by the length of the alignment: (−1+1+1)/5=0.2 or 20%. This is a positive percentage which means that dialects A and B converge to each other on average.
The procedure required in order to test the third hypothesis is mutatis mutandis. Now we focus on those slots where both dialects A and B diverge from standard Dutch. This is slot 1 only:
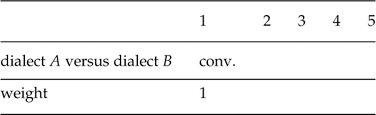
The amount of change in the relationship between dialects A and B is calculated as the sum of the weights divided by the length of the alignment: 1/5=0.2 or 20%. This is a positive percentage which means that dialects A and B converge to each other on average. So in this imaginary example, the overall convergence of dialects A and B to the standard variety amounts to cross-dialectal convergence or koineization, but their overall divergence from the standard variety does so as well.
In Section 2.2.1 we explained that distances between dialects are calculated as the aggregate of maximally 125 word pair distances. Similarly, the amount of change in the relationship between two dialects (amounting to either convergence to standard Dutch or divergence from standard Dutch) is obtained on the basis of maximally 125 sets of five realizations. Usually the number of words will be smaller since, for the sake of comparison, all of the words in a set need to be cognates of each other—which is not always the case. We implicitly normalize over the number of realized sets, since the amount of change in the relationship between two dialects (resulting in either convergence to standard Dutch or divergence from standard Dutch) is calculated as the sum of the weights (which are calculated as explained in this section) divided by the sum of the alignment lengths of the words in the word sets.
3. Testing the Hypotheses
In Section 3.1, we focus on the change of dialects where we test the first hypothesis which we mentioned in Section 1. In Section 3.2 we study the change of relationships between dialects and test the second and third hypothesis.
3.1 Testing the First Hypothesis
In Section 2.2.1, we explained that dialect change is measured as a percentage. A percentage gives the average degree to which segments in the realizations of words of a dialect spoken by an older male have changed, resulting in the segments in the realizations of words of the same dialect spoken by a younger female (cf. Table 2). Section 2.2.2 explains how we distinguish between change resulting in convergence to standard Dutch, change not affecting the relationship to standard Dutch, and change resulting in divergence from standard Dutch.
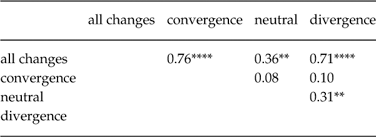
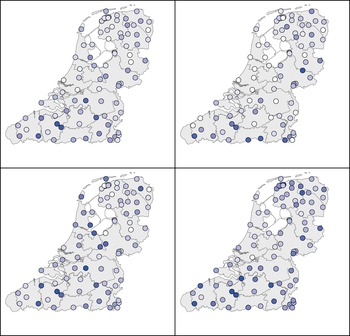
The results are shown in Map 3. The figure shows dialect change measured on the basis of all sound changes (top left), dialect change on the basis of sound changes that do not affect the distance to standard Dutch (top right), dialect change on the basis of sound changes which cause dialects to converge to standard Dutch (bottom left), and dialect change on the basis of sound changes which cause dialects to diverge from standard Dutch (bottom right). Table 8 shows that the patterns on the basis of sound changes which cause dialects to converge to standard Dutch, the pattern on the basis of sound changes which do not affect the relationship to standard Dutch (‘neutral’), and the pattern on the basis of sound changes which cause dialects to diverge from standard Dutch correlate significantly with the pattern on the basis of all sound changes. Furthermore, the ‘neutral pattern’ and the ‘divergence pattern’ significantly correlate to each other.
Correlations between the different types of dialect change measurements. **means: p<0.01, ***means: p<0.001, ****means: p<0.0001.
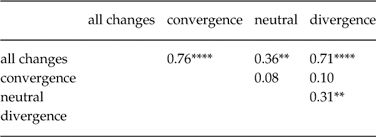
In Section 2.2.1, we found that the average dialect change is equal to 13.3%. This means that on average the dialects studied remain 86.8% the same. The average change resulting in convergence to standard Dutch is equal to 6.8%, the average change not affecting the relationship to standard Dutch is 0.6%, and the average change resulting in divergence from standard Dutch is equal to 5.9%. Therefore, the greater part of change results in convergence to standard Dutch: 6.8/13.3=51.1%. Of course, this does not mean that divergence would be any less important; in fact, the third hypothesis (which will be tested below) concerns the divergence from standard Dutch.
In Section 1, we hypothesized that dialect change is mainly the result of convergence to standard Dutch. In order to test this hypothesis, we need to find out whether the average change resulting in convergence to standard Dutch is significantly higher than the two other types of dialect change (‘neutral’ and ‘divergence’). We used a paired-samples t-test and found that change due to convergence to standard Dutch is significantly larger than both ‘neutral change’ (t=21.932, p<0.0001) and change due to divergence from standard Dutch (t=2.644, p<0.01). Therefore, we conclude that dialects change mainly as the result of convergence to standard Dutch.
Dialect change not affecting the distance to standard Dutch is extremely small (0.6%) and not only significantly smaller than change due to convergence to standard Dutch, but also smaller than change due to divergence from standard Dutch (t=22.162, p<0.0001).
3.2 Testing the Second and Third Hypothesis
The previous section focused on aggregated change of individual dialects. The findings discussed in that section indicate that the relevant hypothesis is correct. In this section we focus on change in relationships between dialects, especially on measurements of the change in the distance between dialect pairs as the result of convergence to standard Dutch. These measurements may be either positive or negative. When the distance change of a dialect pair is positive, this means that dialects have converged to each other on average. When the distance change of a dialect pair is negative, the dialects have diverged from each other on average.
The results are shown in Figure 2. The interpretation of the maps requires some caution. The maps do not tell us whether dialects mainly converge to or diverge from standard Dutch. For example, the map in the center tells us whether sound changes which cause two dialects to converge to standard Dutch also cause them to converge to each other. If so, this does not necessarily imply that each of the two dialects have mainly converged to standard Dutch. The change of a dialect may involve both sound changes which make realizations of some words closer to the standard Dutch realizations, and sound changes which make realizations of some words more distant to standard Dutch realizations. When most sound changes make a dialect linguistically closer to standard Dutch, we would say that the dialect has converged to standard Dutch. This, however, is not shown in the maps; we simply distinguish between two types of sound change—change causing convergence to standard Dutch and change causing divergence from standard Dutch—and the consequences of both types of sounds changes for the mutual relationships between dialects (see Section 2.2.3).
Convergence/divergence between dialects measured on the basis of all sound changes (left), on the basis of sound changes which cause dialects to converge to standard Dutch (center) and on the basis of sound changes which cause dialects to diverge from standard Dutch (right). Red lines indicate convergence and blue lines indicate divergence; the intensity represents the degree of convergence (red shade) or divergence (blue shade).

The results indicate that both the second and third hypotheses are correct. The map in the middle shows that when both members of a dialect pair converge to standard Dutch, they usually also converge to each other (second hypothesis). The map on the right shows that when both members of a dialect pair diverge from standard Dutch, they usually also diverge from each other.
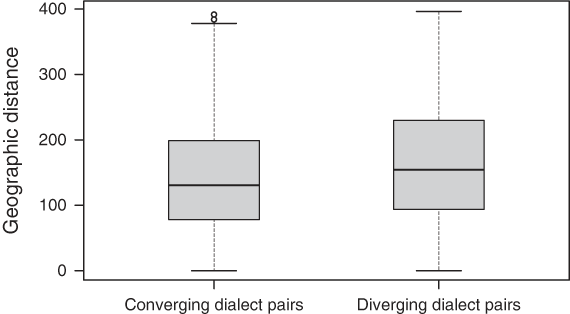
We had a closer look at the change measurements obtained on the basis of all sound changes as shown in the left picture in Figure 2. We correlated them with geographic distances and found a weak correlation of r=−0.14 (p<0.001). This means that geographically close dialects converge to each other and geographically distant dialects diverge from each other. The average geographic as-the-crow-flies distance of converging dialect pairs is 143 km, and the average geographic distance of diverging dialect pairs is 162 km. Boxplots of geographic distances of both converging and diverging dialect pairs are shown in Figure 3. The geographic distances of converging dialect pairs vary from 2.2 km (between Sint Annaparochie and Nij Altoenae, in the northwest of Frisia) to 392.0 km (between Uithuizen, in northern Groningen, and Poperinge, in southwestern West Flanders). The geographic distances of diverging dialect pairs vary between 1.9 km (between Kampen and IJsselmuiden) and 396.3 km (between Finsterwolde and Poperinge). We compared the two groups of dialect pairs by means of the Welch’s t-test and found that the geographic distances of converging pairs is significantly smaller than the geographic distances of diverging pairs (t=−6.84, df=3569, p<0.0001).
Boxplots showing the distributions of geographic as-the-crow-flies distances of converging dialects pairs (left) and diverging dialect pairs (right).
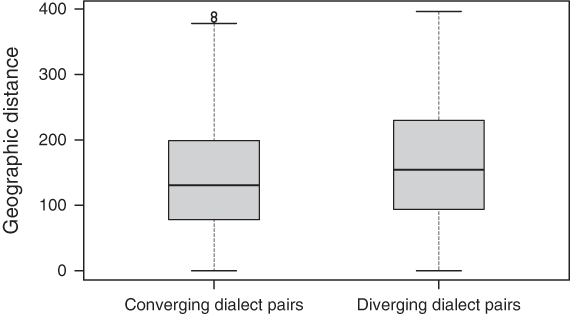
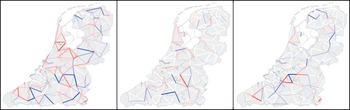
Figure 4 shows only the changes in relationships between neighboring dialects. The picture obtained on the basis of all sound changes (left) gives the impression that dialects in the west converge to each other and dialects in the north and the east mainly diverge from each other. The pictures obtained on the basis of sound changes resulting in convergence to standard Dutch (middle) and divergence from standard Dutch (right) show a remarkably large number of white lines. A white line between two dialects means that the relationship has hardly changed. When comparing the pictures in Figure 4 with the corresponding ones in Figure 2, we notice that changes in relationships resulting in convergence to or divergence from standard Dutch mainly occur between geographically more distant dialects, rather than between neighboring dialects.
Convergence/divergence between neighboring dialects measured on the basis of all sound changes (left), on the basis of sound changes which cause dialects to converge to standard Dutch (center) and on the basis of sound changes which cause dialects to diverge from standard Dutch (right). Red lines indicate convergence and blue lines indicate divergence; the intensity represents the degree of convergence (red shade) or divergence (blue shade).

We test the hypothesis that sound changes in two dialects which make them converge to standard Dutch, make them also become more similar to each other. This hypothesis is tested by testing the null hypothesis that measurements of the change in the distance between dialect pairs are zero on average, i.e. convergence to standard Dutch does not cause dialects either to mainly converge to each other or to mainly diverge from each other. We applied a right-sided one-sample t-test to the measurements of the change in the distance between dialect pairs and found t=23.259 and p<0.001. We reject the null hypothesis. The large positive t statistic shows that the measurements are larger than zero, i.e. mainly represent convergence. We conclude that sound changes in two dialects which make them converge to standard Dutch, make them also converge to each other, i.e. koineize, possibly resulting in regiolectal varieties.
Our third hypothesis states that sound changes in two dialects which make them diverge from standard Dutch, make them also more distant to each other. We applied a left-sided one-sample t-test on the measurements of the change in the distance between dialect pairs as the result of divergence to standard Dutch, testing again the null hypothesis that distance change measurements are zero on average, i.e. divergence from standard Dutch does not cause dialects either mainly to converge to each other or mainly to diverge from each other. We found t=−18.144 and p<0.001. We reject the null hypothesis. The large negative t statistic indicates that the measurements are smaller than zero, i.e. mainly represent divergence. We conclude that sound changes in two dialects which make them diverge from standard Dutch, make them also diverge from each other.
4. Conclusions
In this study, we used three- and five-dimensional Levenshtein distances in order to study dialect change in 86 different local dialects of Dutch and relating this change to processes of convergence to and divergence from standard Dutch.
We found that dialects do not change for the larger part, and the average dialect change is 13.3%. When focusing on this change, we found that 51.1% results from convergence to standard Dutch. This is the larger part and also significantly larger than change which does not affect the relationship to standard Dutch, and change due to divergence to standard Dutch.
We also studied the change in the relationships between dialects. We related this change to processes of convergence to or divergence from standard Dutch. We found that convergence to standard Dutch usually goes hand in hand with the convergence between dialects. Divergence between dialects as the result of convergence of dialects to standard Dutch is exceptional. Divergence from standard Dutch usually goes hand in hand with the divergence between dialects. Convergence between dialects as the result of divergence of dialects from standard Dutch is exceptional.
Several questions remain unanswered. Can dialects converge to or diverge from each other while the relationships to standard Dutch remain unchanged? How is the convergence/divergence between dialects resulting in convergence to/divergence from standard Dutch related to the convergence/divergence between dialects which does not result in convergence/divergence with respect to standard Dutch? In so far as our data allow, we will try to address these questions in a future study.
Distribution of 86 Dutch dialect varieties. The Dutch provinces are shaded in light gray marble and the Belgian provinces are shaded in dark gray pine.

Dialect change is measured as the percentage of segments which were realized differently by the younger female speakers compared to the older male speakers by means of Levenshtein distance. In the map, the intensity of blue in a dot represents the extent to which a variety has changed.

Dialect change measured on the basis of all sound changes (top left), on the basis of sound changes which do not affect the distance to standard Dutch (top right), on the basis of sound changes which cause dialects to converge to standard Dutch (bottom left) and on the basis of sound changes which cause dialects to diverge from standard Dutch (bottom right). The intensity of blue in a dot represents the extent to which a variety has changed.

Acknowledgements
The maps in this paper are created with RuG/L04 – software for dialectometrics and cartography. We thank Peter Kleiweg for developing and making available this software. Especially on our request, he modified one of his programs so that we could create the maps in Figure 3. Additionally, we would like to thank the anonymous reviewers as well as the editors for their valuable remarks and suggestions. We alone are responsible for any remaining shortcomings.