1. Introduction
Recent advances in collaborative robotics have spurred the development of control methods, significantly enhancing human–robot interaction (HRI) [Reference Ajoudani, Zanchettin, Ivaldi, Albu-Schäffer, Kosuge and Khatib1–Reference Cherubini, Passama, Crosnier, Lasnier and Fraisse2]. The expansion of the collaborative robotics underscores its increasing importance in manufacturing, crucial for enhancing flexibility, efficiency, and global competitiveness, with the market currently valued at $8.2 billion and projected to grow to $23.5 billion by 2033 [Reference Gualtieri, Monizza, Rauch, Vidoni and Matt3–Reference Gualtieri, Palomba, Merati, Rauch and Vidoni4]. Cobots are increasingly employed to reduce ergonomic risks while sustaining high-speed operations in industrial environments, as demonstrated by Zanchettin et al. [Reference Zanchettin, Ceriani, Rocco, Ding and Matthias5]. Additionally, Akella et al. [Reference Akella, Peshkin, Colgate, Wannasuphoprasit, Nagesh, Wells, Holland, Pearson and Peacock6] highlight their role in enhancing production efficiency and quality control on assembly lines. These studies emphasize the dual role of collaborative robots in improving co-worker’s safety, operational efficiency, and overall productivity in industrial settings.
Building on these benefits, researchers strive to improve safe, energy-efficient motion planning in industrial human–robot collaboration (HRC) by employing advanced control methods, interfaces, and communication systems. The optimization of production necessitates time-optimal, path-constrained motion planning within actuator limits [Reference Verscheure, Demeulenaere, Swevers, De Schutter and Diehl7]. However, ensuring safety in unstructured industrial environment remains a paramount challenge, as human operators exhibit unpredictable behaviors that require adaptive and real-time responses from collaborative robots. Existing standards, like speed and separation monitoring (SSM) [8–Reference Fryman and Matthias12] and power and force limiting (PFL) [Reference Marvel and Norcross13–Reference Lucci, Lacevic, Zanchettin and Rocco16], aim to balance safety and productivity but encounter challenges. For example, SSM can struggle with accurately predicting human movements, leading to potential collisions, especially in dynamic settings where multiple operators may interact with robots. Similarly, PFL systems may not effectively account for varying force requirements depending on task context, which can lead to either over-restriction, impeding productivity, or insufficient safety measures in high-risk scenarios. These limitations necessitate the development of a robust safety framework that can adapt to the complexities of real-world environments.
State-of-the-art industry-oriented research provides valuable insights into addressing these challenges. For instance, studies have focused on quantifying the quality of HRC to ensure smooth operations in manufacturing settings [Reference Kokotinis, Michalos, Arkouli and Makris17], developing AI-based action recognition frameworks for assembly tasks [Reference Gkournelos, Konstantinou, Angelakis, Tzavara and Makris18], and implementing adaptive safety monitoring mechanisms that dynamically switch safety zones based on proximity [Reference Andronas, Kampourakis, Papadopoulos, Bakopoulou, Kotsaris, Michalos and Makris19]. In the automotive industry, case studies have demonstrated the seamless integration of high-payload robots alongside human operators to enhance collaboration and productivity [Reference Karagiannis, Kousi, Michalos, Dimoulas, Mparis, Dimosthenopoulos, Tokçalar, Guasch, Gerio and Makris20]. Additionally, cyber-physical systems have emerged as an essential approach for ensuring safety in shared workplaces, with a focus on both static and dynamic obstacles [Reference Nikolakis, Maratos and Makris21].
Existing solutions for ensuring human safety in collaboration often lack consistent performance. Scholars have proposed various methods for safe motion planning in constrained workspaces to ensure HRC with static and dynamic obstacles. For instance, an improved rapidly exploring random tree (RRT) planner [Reference Jiang, Liu, Cui and Jiang22] and the fast bidirectional RRT (FBi-RRT) proposed by Xiao et al. [Reference Xiao, Zhang, Wu, Han, Ding and Han23] enhance efficiency and reliability in navigating complex environments. Additionally, methods for trajectory planning in cluttered spaces [Reference Lee and Sheu24] segment movements and compute a 2D global trajectory. Artificial potential fields (APF) have been instrumental in advancing motion planning strategies for robotics [Reference Khatib25]. Macktoobian and Shoorehdeli [Reference Macktoobian and Shoorehdeli26] introduced the time-variant APF method, optimizing energy efficiency in autonomous space robots. Yang et al. [Reference Yang, Dong and Dai27] enhanced APF for dual-robot systems, ensuring safe collaboration in dynamic environments. Tang et al. [Reference Tang, Zhou and Xu28] improved APF with A* integration, enhancing navigation efficiency in complex environments. Multiobjective optimization has also played a crucial role in enhancing robotic efficiency and adaptability. For example, Chettibi [Reference Chettibi29] demonstrated a hybrid optimization method for trajectory planning in industrial robots, optimizing trajectory length and energy consumption, while Ye et al. [Reference Ye, Hao and Cheng30] integrated Pareto fronts to navigate end-effector path constraints effectively. Other notable approaches include a time-optimal trajectory planning algorithm for shared workspaces [Reference Palleschi, Hamad, Abdolshah, Garabini, Haddadin and Pallottino31], collision-free motion planning using a K-nearest neighbors search algorithm [Reference Chen and Song32], and a two-layer architecture for trajectory planning and scaling to ensure safety for human operators [Reference Pupa, Arrfou, Andreoni and Secchi33]. Safety measures are critical in collaborative robotics, especially in maintaining seamless and fluent HRI. Scalera et al. [Reference Scalera, Lozer, Giusti and Gasparetto34] evaluated robot-stopping mechanisms and their effect on interaction fluency, finding that fast and accurate stops significantly reduce downtime without compromising safety, especially in scenarios where human proximity frequently triggers intervention. Such methods are necessary for real-time safety monitoring in collaborative workspaces. Other real-time methods include adjusting robot speed using 3D cameras and simplified human kinematic models [Reference Ragaglia, Zanchettin and Rocco35], prioritizing safety as a hard constraint [Reference Zanchettin, Ceriani, Rocco, Ding and Matthias5], dynamically scaling velocity for multirobot and human tasks [Reference Lippi and Marino36], and generating collision-free trajectories using multiple depth sensors [Reference Chen and Song37]. Additionally, attractive and repulsive fields have been combined in teleoperation to enhance safety [Reference Ferraguti, Preda, Bonfe and Secchi38]. Optimization algorithms have also addressed potential field constraints to ensure task execution with minimal path corrections [Reference Ferraguti, Bertuletti, Landi, Bonfe, Fantuzzi and Secchi39]. Kinodynamic RRTs have been developed to plan collision-free trajectories under kinodynamic constraints [Reference LaValle and Kuffner40]. However, these methods often struggle in dynamic environments where unpredictable human behavior necessitates real-time consideration of safety-related constraints [Reference Udai, Hayat and Saha41]. To address this, we leverage an RGB-D camera to monitor human movement and provide necessary spatial data to the robot in real-time. This enables our improved artificial potential field-based global path planner to dynamically incorporate human behavior and kinodynamic constraints, thereby enhancing safety.
In this paper, we present a kinematic strategy that forms a comprehensive safety architecture for HRC in confined spaces, i.e., restricted industrial zones, such as automated work cells, warehouses, and assembly lines, where humans and robots work in close proximity. Our approach focuses on safe, energy-efficient motion planning, addressing both static and dynamic obstacles, including humans. By integrating safety measures using advanced path planning techniques, we aim to optimize productivity while maintaining safety standards. This strategy balances the intricate demands of safety and efficiency, providing a robust framework for enhancing HRC in industrial settings.
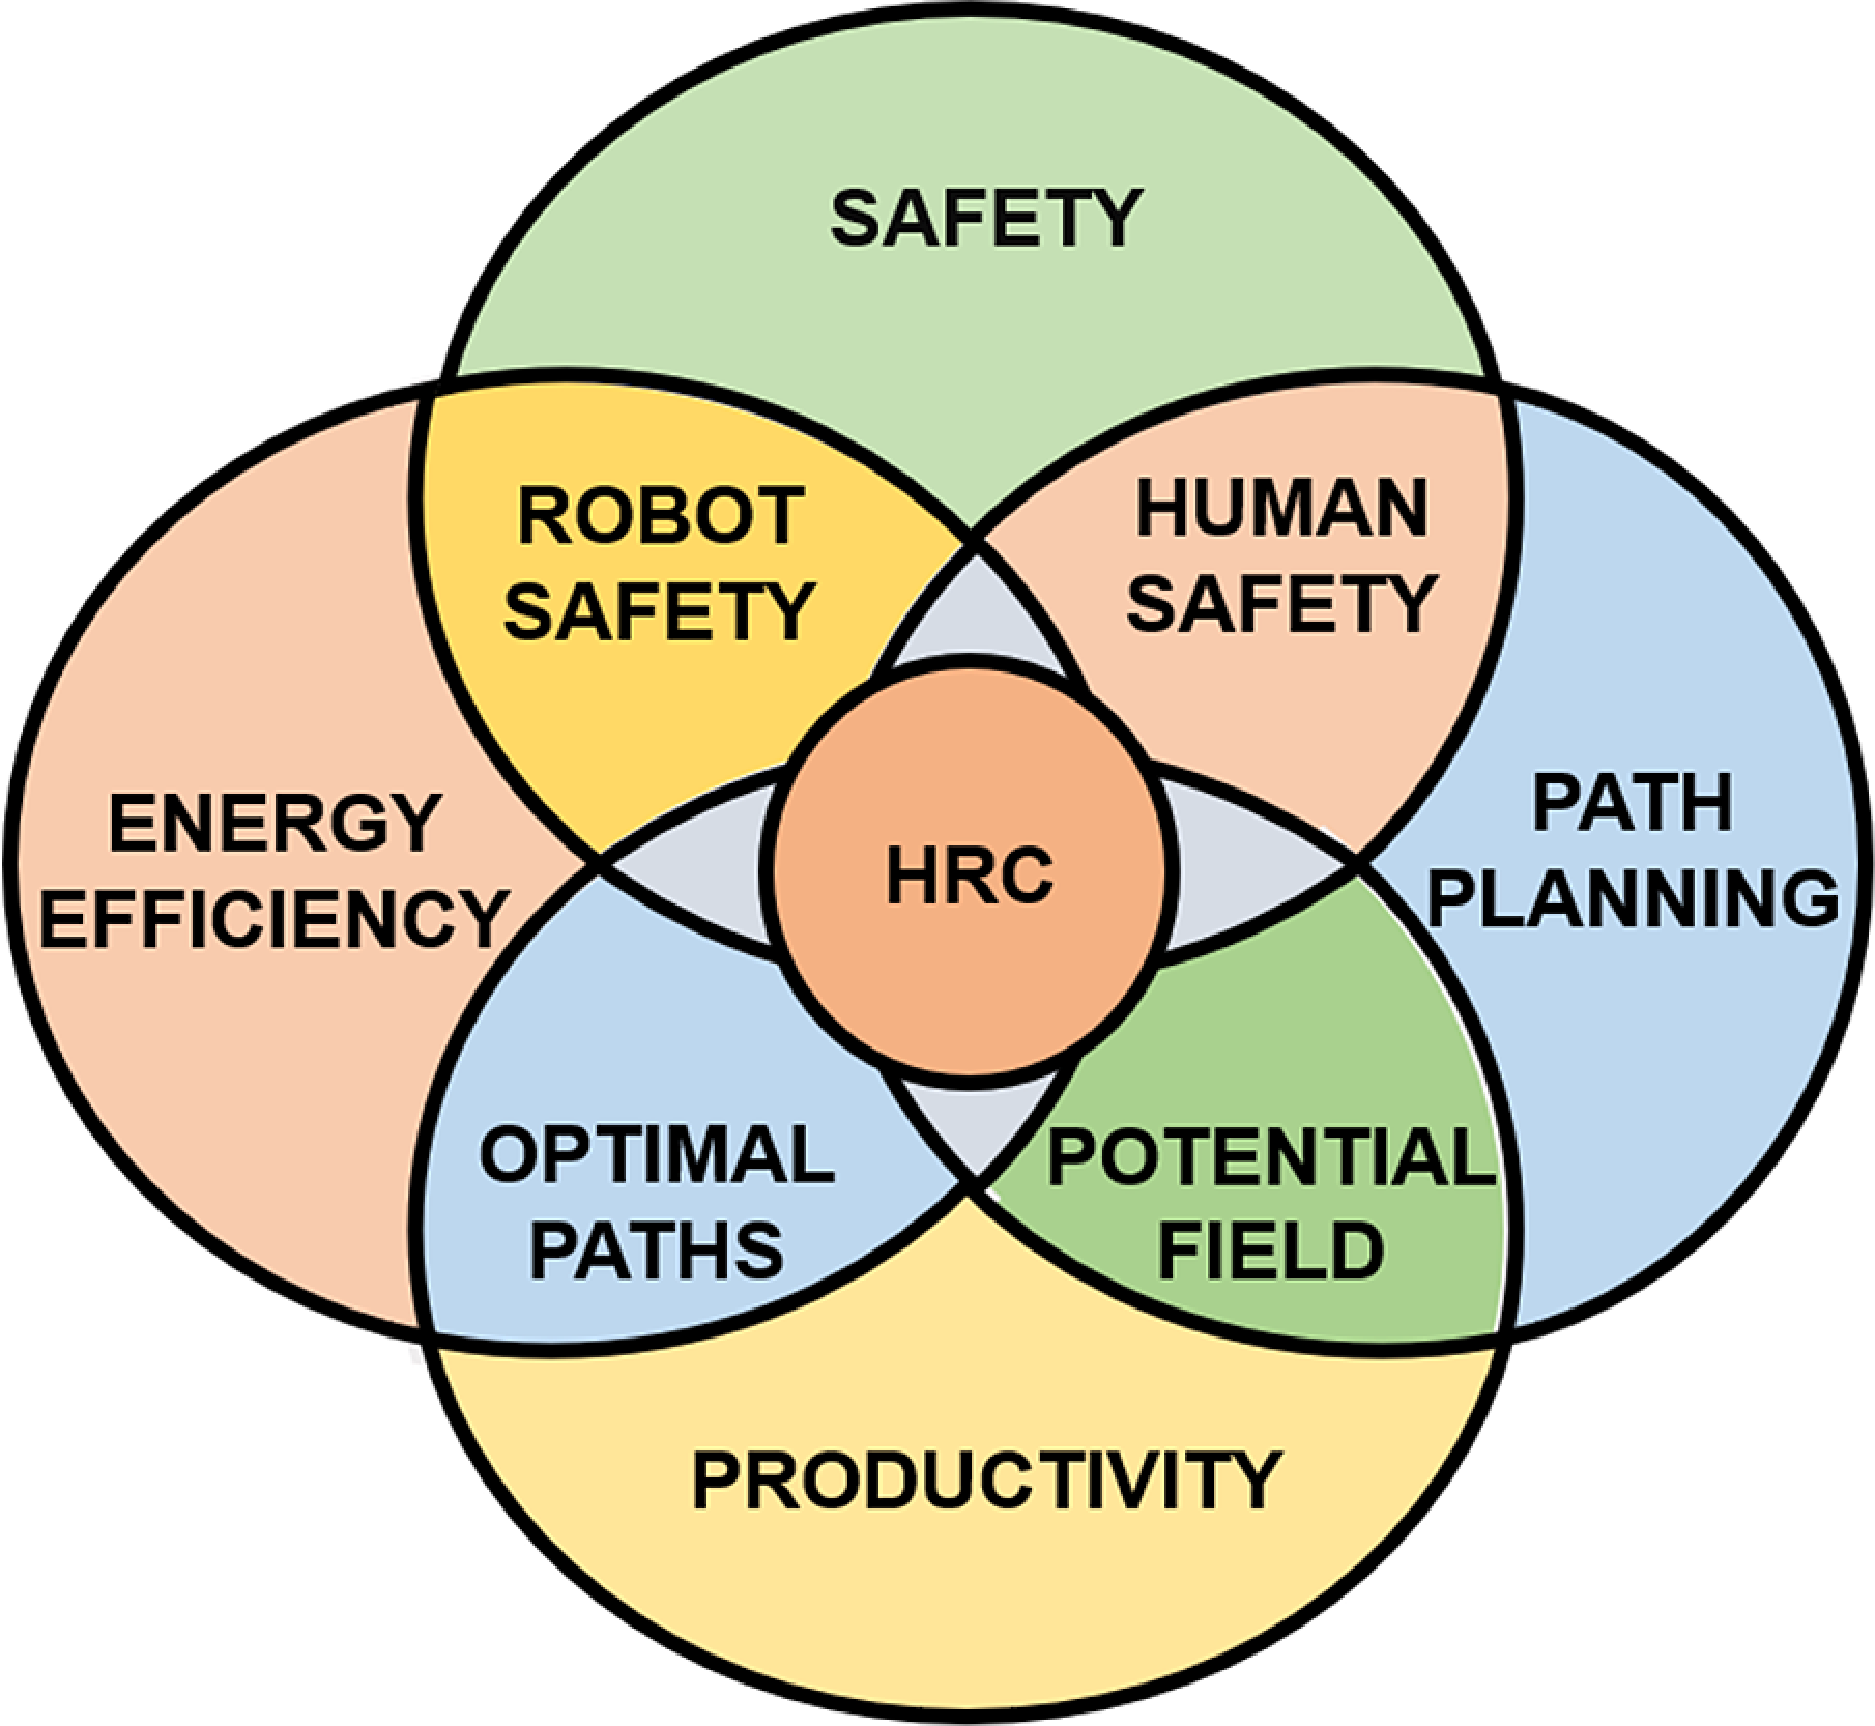
Our work introduces an approach for safe and efficient path planning in industrial environments (Figure 1). Integrating advanced methods for static and dynamic obstacle-based safety with real-time human presence and spatial data, we have developed a robust safety architecture for HRC. The architecture ensures optimized operational continuity within safety limits by adjusting speed of the robot dynamically without the need for reactive control (i.e., path replanning). This allows the robot to maintain optimal performance during collaborative tasks, even when humans enter the workspace, balancing safety with productivity. Central to our approach is an improved artificial potential field (IAPF) that optimizes paths using real-time robot parameters, including joint configurations, obstacle proximity, task space variables (end-effector position), and safety margins. Additionally, the approach incorporates path energy considerations such as bending energy—a metric evaluating the path’s length and curvature for smoother transitions. Unlike traditional methods focused on static or dynamic obstacles only, our framework ensures adaptive and path energy-efficient interactions across industrial settings, enhancing safety and productivity while complying with ISO 15066 technical specifications. The contributions of our work are as follows:
Description of proposed HRC framework.

-
1. Introduction of an architecture for safety in HRC that integrates dynamic and static obstacle handling into a unified framework, ensuring real-time adaptation of robot paths without compromising productivity.
-
2. Elimination of the need for reactive control (i.e., path replanning) by maintaining consistent robot paths through dynamic adjustment of trajectories when human operator approaches, based on real-time spatial data of human, ensuring operational continuity and safety in confined manufacturing environments [Reference Zanchettin, Ceriani, Rocco, Ding and Matthias5].
-
3. Development of an evaluation metric for system performance that assesses safety and operational efficiency, providing a comprehensive assessment of the system’s effectiveness.
2. Proposed approach
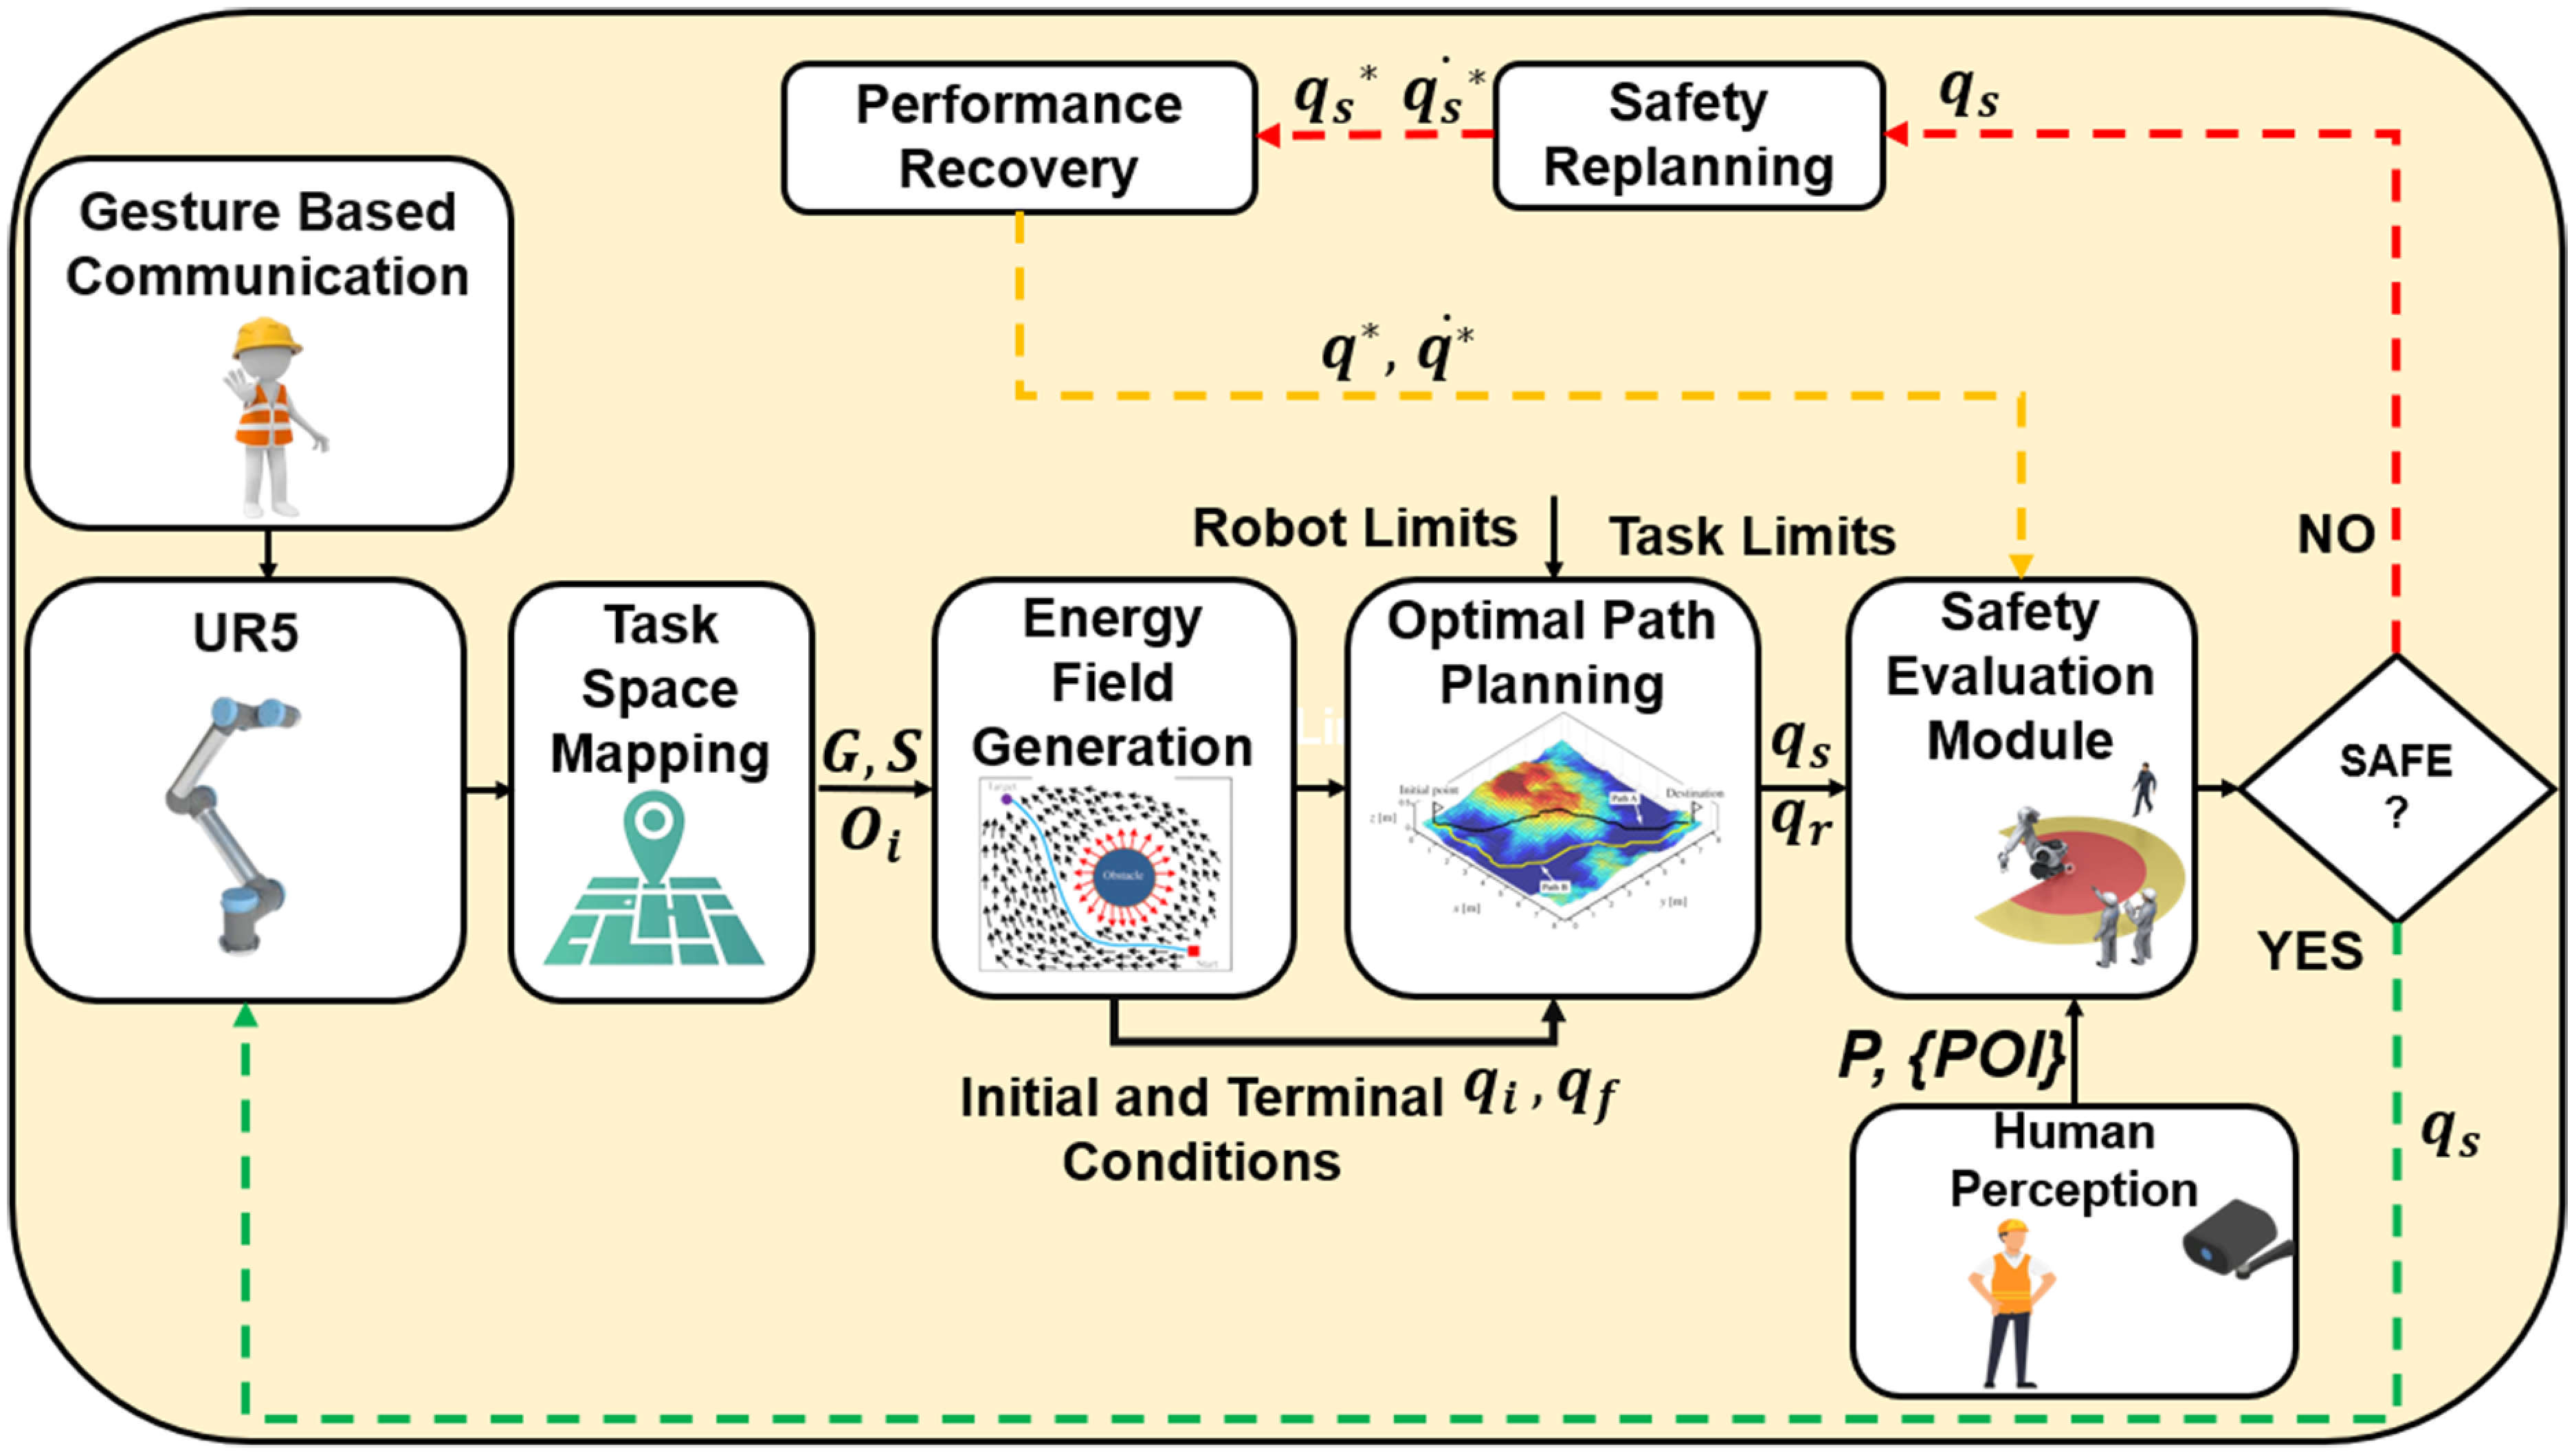
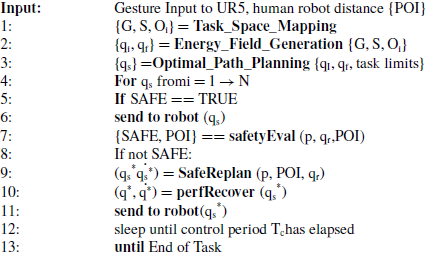
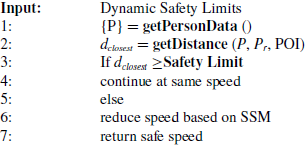
The HRC framework in Figure 2 seamlessly integrates potential field-based path planning, prioritizing safety and productivity, adhering to four core principles as follows: (1) Applicability to diverse paths and robots. (2) Prioritizing maximum speed when safe. (3) Adaptive motion for changing conditions. (4) Swift return to maximum speed post-safety assurance. Algorithm 1 outlines iterative safe-efficient HRC.
Schematic of the proposed safe and energy efficient motion planning framework.

Safe Motion Planning

To demonstrate the practical applicability of our framework, we outline several real-world scenarios where our proposed approach can be effectively integrated.
-
1. Automotive Assembly: In automotive production lines, collaborative robots can assist human workers by handling heavy components, thereby reducing physical strain and enhancing overall efficiency. Our framework ensures that the robots maintain a safe distance while adapting to the dynamic movements of human operators.
-
2. Warehouse Automation: In modern warehouses, robots are increasingly tasked with managing inventory alongside human workers. Our method enables robots to navigate efficiently while avoiding obstacles, such as shelves and humans, ensuring operational safety and enhancing productivity.
-
3. Construction Sites: In construction environments, robots can work alongside human teams in confined spaces. The proposed approach facilitates safe interactions, ensuring that robots can react to human presence in real time, thus preventing accidents.
With these practical applications being considered, we examine the specific components of our approach that enable such scenarios to be executed safely and efficiently.
In constrained environments with limitation on path replanning, we establish an initial path from start to goal. In Figure 2, Task_Space_Mapping block simplifies the search space through a one-time human-guided dynamic point allocation process that identifies obstacles and spatial parameters. The Energy_Field block generates an artificial potential field guiding the robot’s end effector to the goal while avoiding obstacles. Optimal_Path_Planning prioritizes a trade-off between minimal bending energy paths and shortest lengths for safety and efficiency within static environments, considering actuation limits and task constraints.
The Safety Evaluation Module continually assesses safety, triggering replanning if constraints are violated (Safe_Replanning in Algorithm 1). This approach enhances effective and safe HRC in constrained industrial spaces.
For proper execution of Algorithm 1, the following key inputs are required from both the human and robot states, as well as the environment: The human state input includes the human position (P), which involves real-time tracking of the human worker’s 3D coordinates to assess proximity to the robot, and the point of interest (POI), which consists of shortest distance between human and robot’s end effector. The robot state input includes the robot position, which refers to the real-time position of the robot’s end effector, continuously monitored for safe navigation, and task constraints, which involve velocity, trajectory limitations, or specific workspace constraints for motion planning. The environmental inputs include the obstacle map
 $\mathrm{O}_{\mathrm{i}}$
, which provides information about the presence and location of static obstacles in the shared workspace, crucial for navigation, and environmental parameters, which refer to any workspace constraints or dynamic changes that could affect the robot’s motion planning.
2.1. Gesture-based communication
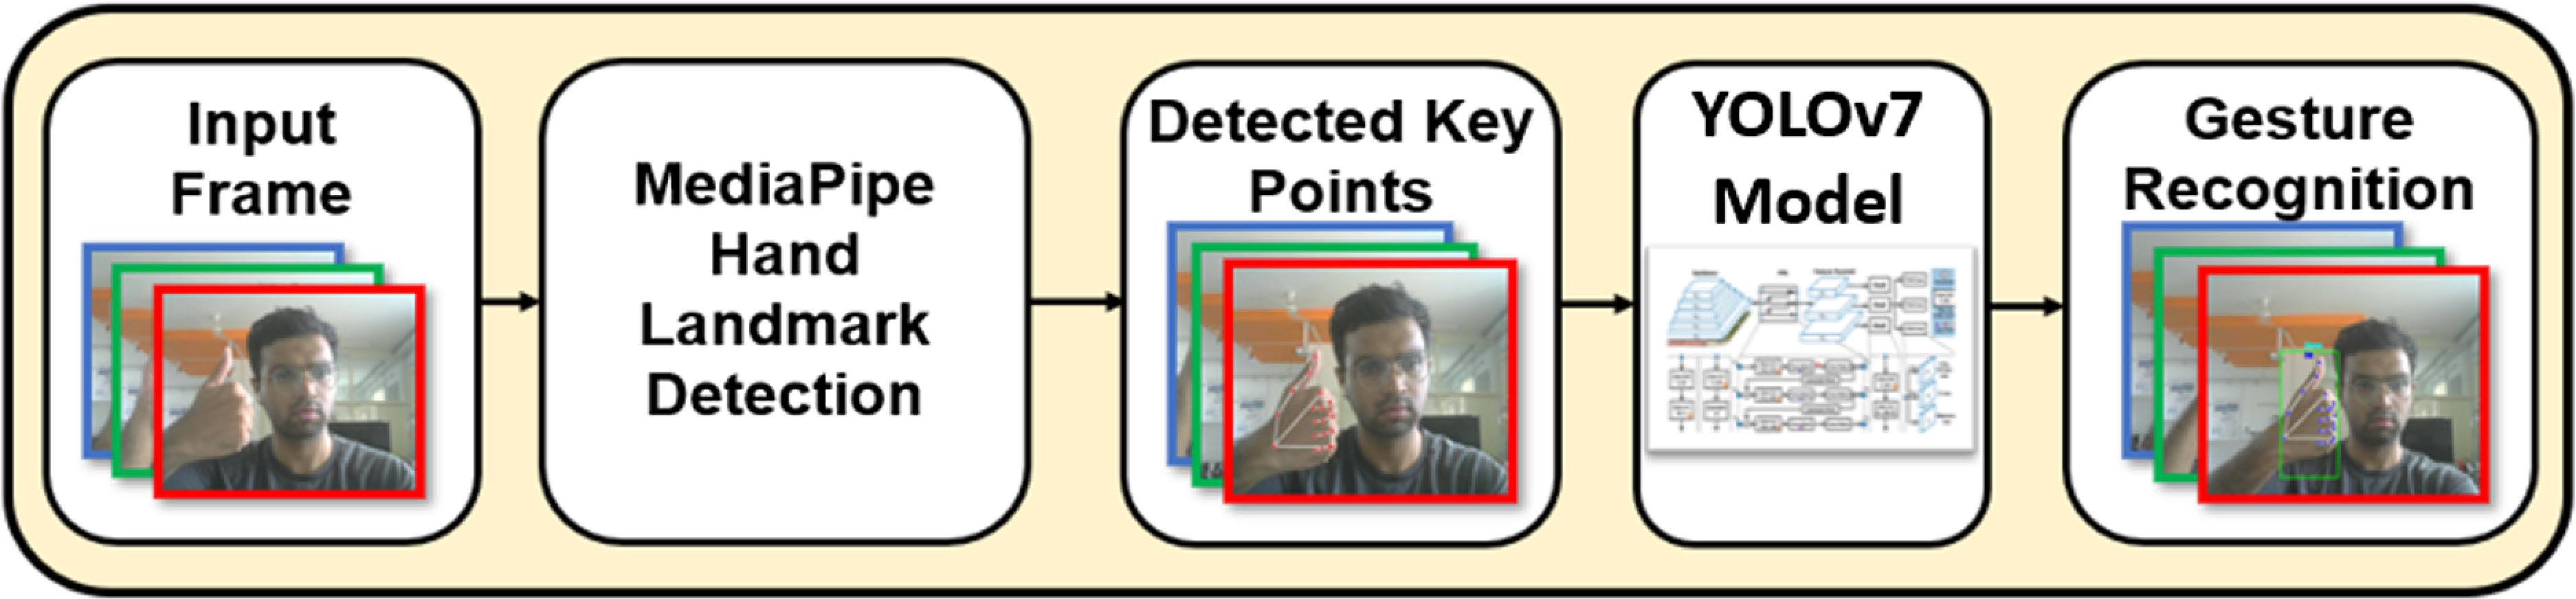
Gesture-based communication is crucial for safe human–robot collaboration (HRC) as it facilitates intuitive and immediate interactions between human operators and robots [Reference Liu and Wang42]. This method enhances situational awareness, which is essential in dynamic industrial environments. Research has shown that effective communication strategies like gesture recognition, significantly reduce the potential for accidents and improve operational efficiency in collaborative settings [Reference Neto, Simão, Mendes and Safeea43]. In our method (Figure 3), Mediapipe skeletal detection first captures real-time human body key points from input frames. These key points are then processed by the YOLOv7 CNN model, meticulously fine-tuned to achieve high mean average precision (mAP) with limited training data. This integration eliminates the need for traditional feature extraction, classifiers, or recurrent neural networks, streamlining gesture recognition by leveraging the best of both techniques. By facilitating intuitive and immediate interaction between robots and human operators, the streamlined process reduces response times and potential errors, crucial in dynamic industrial environments where quick, precise communication is essential for preventing accidents. Such multimodal communication not only enhances operational efficiency but also improves safety protocols, minimizing the risks associated with HRI through responsive and reliable task inputs. Existing research underscores the importance of intuitive interfaces for minimizing human error and increasing reliability in HRC settings [Reference Wang, Zhou, Li, Li and Kan44–Reference Park and Lee45].
Architecture of YOLOv7 integrated with Mediapipe.

2.2. Task space mapping
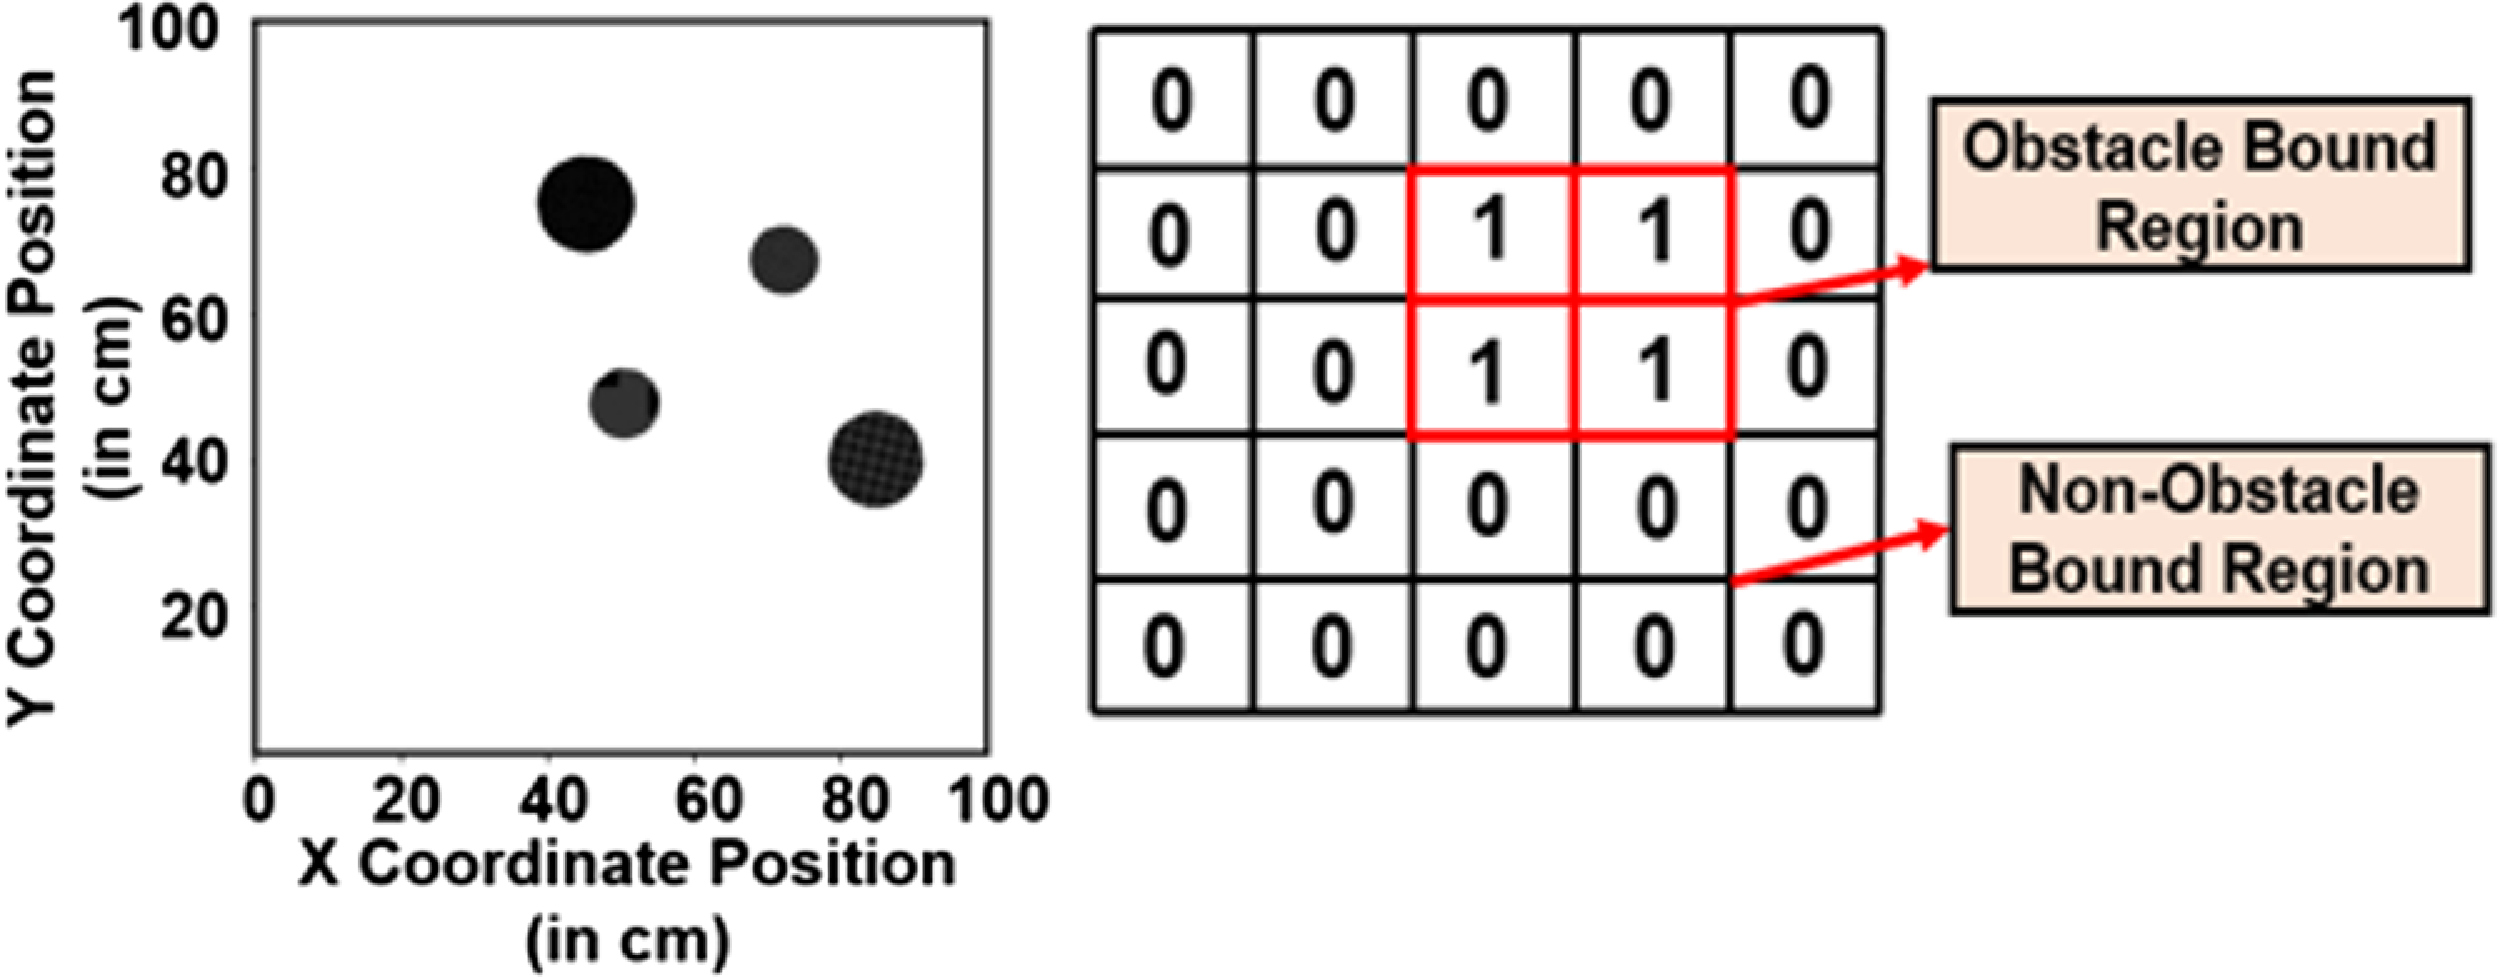
Task space mapping (Figure 4) blends obstacle data with Mask R-CNN instance segmentation for precise mapping of obstacles, providing a comprehensive environmental layout. Human index finger guidance replaces the traditional approach of robot scanning, thereby reducing search space complexity and enhancing efficiency in defining start and goal points dynamically. It produces binary masks (1 for obstacles, 0 for surroundings) in real-world coordinates, facilitating a one-time setup tailored to specific environmental conditions, ensuring robust adaptability for tasks having static obstacles in industrial settings. This streamlined approach not only enhances navigation precision but also promotes continuous operational safety and efficiency.
Task space – obstacle grid map.

2.3. Energy field generation
The proposed framework employs task space mapping to construct an energy field
 $(U\colon R^{n}\rightarrow R)$
in the
 $n$
-dimensional configuration space of the robot. This energy field integrates attractive potential forces that steer the robot toward its goal and repulsive potential forces that avoid obstacles in its path. The mathematical formulation is detailed as follows:
 \begin{equation} \begin{array}{l}\newline \nabla U\left(q\right)=DU\left(q\right)^{T}=\left[\frac{\partial U}{\partial q_{1}}\left(q\right),\ldots, \frac{\partial U}{\partial q_{n}}\left(q\right)\right]^{T} \end{array} \end{equation}
 $q=[q_{1},q_{2},\ldots, q_{n}]^{T}$
represents the robot’s configuration in
 $n$
-dimensional space.
 $U(q)$
is the potential energy at a given configuration
 $q$
. The gradient drives the robot along a trajectory of steepest descent within the energy field, ensuring efficient movement toward its goal while avoiding obstacles.
The total energy field
 $U_{\textit{combined}}(q)$
at any configuration
 $q$
is the sum of two components: the attractive potential field
 $U_{att}(q)$
, which pulls the robot toward its goal, and the repulsive potential field
 $U_{rep,i}(q)$
, which ensures safe avoidance of obstacles. This relationship is expressed in Eq. (1b):
 \begin{equation}U_{\textit{combined}}\left(q\right)=U_{att}\left(q\right)+\sum _{i=1}^{N}U_{rep,i}\left(q\right)\end{equation}
 $U_{att}(q)$
is the attractive potential energy component.
 $U_{rep,i}(q)$
is the repulsive potential energy from the ith obstacle. N is the number of obstacles in the environment. This formulation balances task-oriented navigation (goal-directed movement) with safety constraints (obstacle avoidance).
2.3.1. Attractive potential field modeling
The attractive potential field is designed to guide the robot toward its goal by minimizing the energy in the configuration space. This component ensures goal-directed movement and is influenced by the Euclidean distance
 $d$
between the robot’s current position
 $(x,y,z)$
and its desired goal position
 $(x_{goal},y_{goal},z_{goal})$
. The following equations explain its construction in detail:
The Euclidean distance between the robot’s current position and the goal is calculated as
 \begin{equation} d=\sqrt{\left(x-x_{goal}\right)^{2}+\left(y-y_{goal}\right)^{2}+\left(z-z_{goal}\right)^{2}} \end{equation}
The linear potential function generates an attractive energy field
 $U_{att}(q)$
that increases with the distance between the robot and the goal state
 $d(q, q_{goal })$
. It is scaled by a factor
 $K_{att}$
which modulates the strength of attraction:
 \begin{equation} U_{att}\left(q\right)= K_{att}*d\left(q, q_{goal }\right) \end{equation}
This function ensures that the closer the robot is to the goal, the lower the energy. The gradient of the attractive potential field,
 $\nabla U(q)$
drives the robot along the steepest descent, ensuring energy minimization. This ensures the robot moves toward the goal efficiently by applying forces proportional to the gradient.
 \begin{equation} \nabla U_{att}\left(q\right)=\left[\frac{K_{att}}{d\left(q,q_{goal}\right)}\right]*\left(q, q_{goal }\right) \end{equation}
In close proximity to the goal, a quadratic function is used for smoother transitions, defined as
 \begin{equation} U_{att}\left(q\right)=\frac{1}{2}\,K_{att}*d^{2}\left(q, q_{goal }\right) \end{equation}
This quadratic potential provides better control when the robot is near the goal, as it allows smoother deceleration. To ensure a smooth blend between distant and proximal behavior, the potential field is defined as follows:
 \begin{equation} \begin{array}{c} U_{att}\left(q\right)=\frac{1}{2}K_{att}d^{2}\left(q, q_{goal }\right), d\left(q, q_{goal}\right)\leq d_{goal}^{*}\\ U_{att}\left(q\right)=d_{goal}^{*}K_{att}d\left(q, q_{goal }\right) \\ -\frac{K_{att}}{2\left(d_{goal}^{*}\right)^{2}}, d\left(q, q_{goal}\right)\gt d_{goal}^{*} \end{array} \end{equation}
 $d_{goal}^{*}$
is the threshold distance where the potential changes from quadratic to linear. This ensures smooth transitions between regions of different behavior in the energy field. The attractive force
 $F_{att}(q)$
responsible for guiding the robot is calculated as the negative gradient of the attractive potential:
 \begin{equation} F_{att}\left(q\right)=-\nabla U_{att}\left(q\right) \end{equation}
This force ensures precise robot movement by constantly directing it toward the goal.
2.3.2. Repulsive potential field modeling
The repulsive force
 $F_{rep}$
arises from potential energy to prevent close manipulator-obstacle proximity, ensuring safe avoidance. The obstacle’s repulsive potential energy
 $U_{rep,i}$
is calculated as follows:
To control the repulsive influence based on the task configuration, a scaling factor
 $d_{\textit{factor}}$
is defined:
 \begin{equation} d_{\textit{factor}}\left(q_{\textit{start}},q_{goal},n,flag\right)=\left| q_{\textit{start}}-q_{goal}\right| ^{n} \end{equation}
 $(q_{\textit{start}},q_{goal})$
being the start and goal configurations of the robot, exponent
 $n$
governing the strength of scaling and the
 $flag$
indicating active state of the factor. This factor adjusts the potential energy and forces based on the robot’s proximity to its initial and goal states.
The repulsive potential energy
 $U_{rep,i}$
is active only when the robot comes within a defined safety threshold
 $\zeta _{i}$
, it is given by
 \begin{equation}U_{rep,i}=\begin{cases} \frac{1}{2}K_{rep}\left(\frac{1}{\rho _{i}}-\frac{1}{\zeta _{i}}\right)^{2}* \\ d_{\textit{factor}}\left(q_{\textit{start}},q_{goal},n,flag\right) if \rho _{i}\lt \zeta _{i}\\ 0, \textit{otherwise} \end{cases}\end{equation}
where
 $K_{rep}$
is the scaling factor for the repulsive strength,
 $\rho _{i}$
is the distance between the robot and the obstacle i, and
 $\zeta _{i}$
is the safety threshold. No repulsion occurs when
 $\rho _{i}\geq \zeta _{i}.$
This potential energy prevents collisions by generating a field when the robot enters an unsafe zone. The gradient of the repulsive potential energy drives the repulsive force. It is defined as
 \begin{align} \nabla U_{rep,i}=\begin{cases} K_{rep}\left(\frac{1}{\zeta _{i}}-\frac{1}{\rho _{i}}\right)*\frac{1}{{\rho _{i}}^{2}}*\nabla \rho _{i} if \rho _{i}\leq \zeta _{i}\\ 0, \textit{otherwise} \end{cases} \end{align}
 $\nabla \rho _{i}$
is the gradient of the robot obstacle distance, this term determines the direction and magnitude of the repulsive force.
The first force component of repulsive force
 $F_{rep,i}^{(1)}$
due to the gradient of potential energy is given by
 \begin{equation} F_{rep,i}^{\left(1\right)}=-\nabla U_{rep,i } \end{equation}
The second component of repulsive force
 $F_{rep,i}^{(2)}$
comes from differentiating the potential energy w.r.t the manipulator position.
The derivative of the distance scaling factor accounts for the robot’s dynamics. This term modifies the repulsion to ensure proportional adjustments as the robot traverses the workspace.
 \begin{equation} d_{\textit{factor}}^{'}\left(q_{\textit{start}},q_{goal},n,flag\right)=\left| n*\left(q_{\textit{start}}-q_{goal}\right)^{n-1}\right| \end{equation}
 \begin{align} F_{rep,i}^{\left(2\right)}=-\left(\frac{n_{i}}{2}\right)*K_{rep}(\left(\frac{1}{\rho _{i}}-\frac{1}{\zeta _{i}}\right)^{2}* d_{\textit{factor}}^{'}\left(q_{\textit{start}},q_{goal},n,flag\right) \end{align}
The resultant repulsive force is given by combining 3d and 3f
 \begin{equation} F_{rep}=\sum _{i=1}^{N}\left(F_{rep,i}^{\left(1\right)}+F_{rep,i}^{\left(2\right)}\right) \end{equation}
This represents the aggregate influence of repulsive forces.
The resultant force due to the potential field can be calculated below
 \begin{equation} F_{\textit{total}}\left(q\right)=F_{att}\left(q\right)+F_{rep}\left(q\right) \end{equation}
This total force drives the robot safely through its path, balancing attraction toward the goal with repulsion from obstacles.
Standard APF suffers from significant drawbacks, including its tendency to become trapped in local minima and its inability to adapt to complex and dynamic scenarios. The proposed IAPF mitigates these issues by integrating adaptive repulsive forces and bending energy. This distinguishes IAPF as a versatile framework capable of navigating confined human–robot shared spaces, where traditional approaches struggle.
The IAPF method builds upon traditional APF approaches by introducing the following:
-
1. Dynamic Repulsive Forces: The repulsive potential dynamically scales with task-space configuration and obstacle proximity using the
 $d_{\textit{factor}}$
and its derivative. This ensures nuanced obstacle avoidance in confined spaces.
-
2. Mitigation of Local Minima Issues: Gradient-based recalibration dynamically adjusts attractive and repulsive forces to prevent the robot from becoming stuck in local minima [Reference Park and Lee45–Reference Yun and Tan46].
-
3. Path Optimization via Bending Energy: Bending energy is introduced as a function of path length and curvature, ensuring smooth, continuous trajectories. This minimizes abrupt direction changes, optimizing safety and operational efficiency. Unlike traditional APF, which overlooks path smoothness, the IAPF balances attractive, and repulsive forces for better path predictability.
-
4. Compared to Control Barrier Functions or learning-based methods, which provide rigorous safety guarantees but struggle with dynamic environmental changes without significant recalibration [Reference Singletary, Klingebiel, Bourne, Browning, Tokumaru and Ames47–Reference Yadav, Nagar and Shah48], IAPF balances computational efficiency with effective obstacle avoidance, making it suitable for real-time applications across various operational scenarios.

2.4. Optimal path generation
In constrained trajectory optimization, ζ factor establishes the upper (U(t)) and lower (L(t)) bounds, ensuring a minimum safe distance (ζ * obstacle radius) from obstacles. Multiobjective optimization refines paths using ω1 and ω2 weighted length (L) and bending energy (BE) of the path. Safety constraints maintain path bounds
 $L(t)\leq p(t)\leq U(t) \forall t$
while upholding a minimum distance from obstacle from
 $O_{i} \mathrm{to} p(t)\geq \zeta$
. The optimization process uses a gradient descent algorithm (GDA) to explore potential solutions, guided by Eq. (5a):
 \begin{equation} \min f\left(p\right)=\omega _{1}*L\left(p\right)+\omega _{2}*B\left(p\right) \end{equation}
where bending energy
 $B(p)$
is defined as follows
 \begin{equation}B(p)=\int _{0}^{L}\left(k\left(s\right)\right)^{2}ds\end{equation}
To optimize the trajectory and ensure smooth movement, bending energy is incorporated into the path energy formulation. Bending energy quantifies the smoothness of the robot’s trajectory by penalizing sharp changes in direction, ensuring a continuous and predictable motion. It is defined as the integral of the square of the curvature
 $k(s)$
along the robot’s path where
 $k(s)$
represents the local curvature, and
 $L$
is the total path length. This formulation is consistent with well-established principles in robotics and path optimization literature, where bending energy serves as a crucial metric for evaluating trajectory quality. The energy function helps minimize abrupt direction changes, thereby promoting continuous and predictable robot trajectories.
2.5. Safety evaluation module
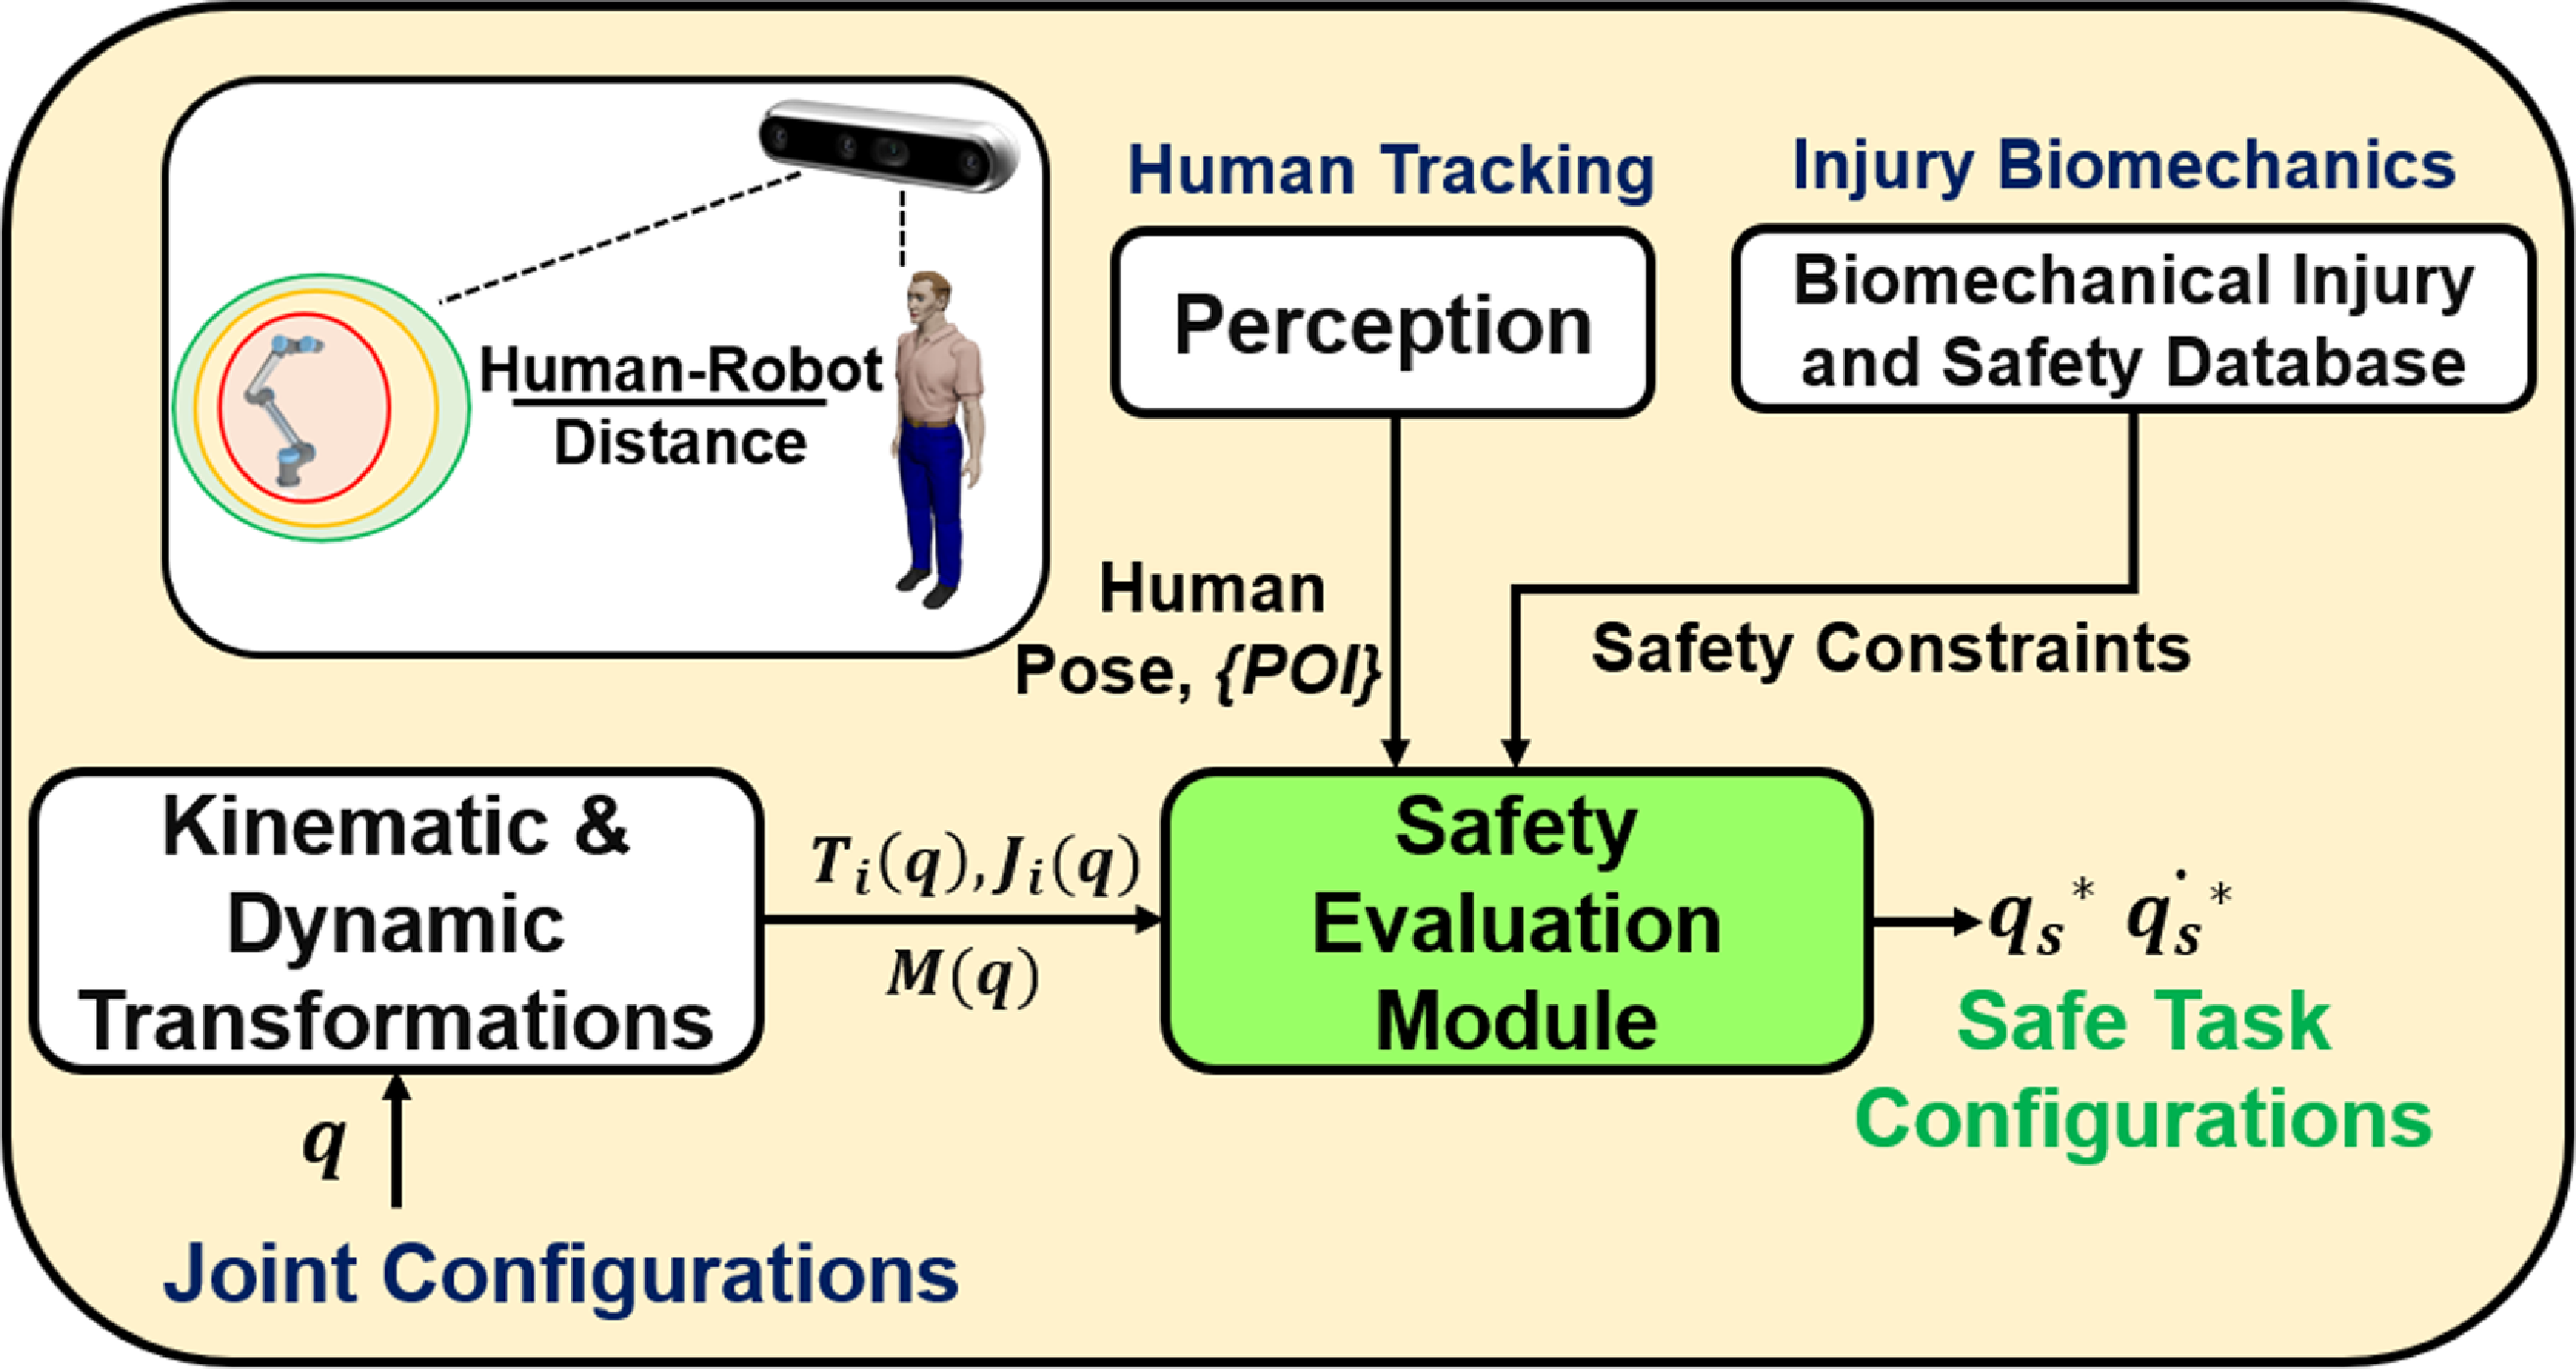
The safety evaluation module (SEB) is vital for human co-worker safety, combining SSM and PFL constraints (as in Figure 5). It continually evaluates trajectory safety in control cycles, focusing on the point of interest within a set time frame. For enhanced computational efficiency, it extends safety criteria to upcoming joint positions and velocities. When the human enters the point of interest (POI), SEB cautiously adjusts the robot’s speed to ensure safety, marking the trajectory as SAFE. Three safety zones,
 $\mathcal{Z}_{\textit{green}}$
,
 $\mathcal{Z}_{\textit{yellow}}$
, and
 $\mathcal{Z}_{red}$
, are predefined. SEB uses the human–robot closest distance
 $d_{\textit{closest}}$
, derived from human pose
 $P$
and robot end effector position
 $P_{r}$
, to activate the safety evaluation block based on these distances. The robot runs at max speed, activating safe replanning when safety is violated. The safety evaluation relies on 3D camera-acquired human–robot data.
 \begin{equation}P=\left[x_{h},y_{h, }z_{h}\right] P_{r}=\left[x_{r},y_{r, }z_{r}\right]\end{equation}
 \begin{equation}d_{\textit{closest}}=\min _{\mathit{point}} \left| P_{r}-P_{\textit{point}}\right|\end{equation}
 \begin{equation}\left\{\begin{array}{c} \mathcal{Z}_{\textit{green}}=d_{\textit{closest}}\geq d_{\textit{green}} \\ \mathcal{Z}_{\textit{yellow}}=d_{\textit{green}}\gt d_{\textit{closest}}\gt d_{\textit{yellow} }\\ \mathcal{Z}_{red}=d_{\textit{closest}}\geq d_{\textit{yellow}} \end{array} \right\}\end{equation}
Safety evaluation module of the proposed framework.

Safety Evaluation Module

2.6. Safe replanning and performance recovery
The safe replanning module activates on deviations in human-robot distance, adjusting speed for safety. Performance recovery assesses safety; if successful, the robot resumes regular task as per Algorithm 3.
3. Simulations
A comparative study explores three algorithms: Gradient Descent, Improved Artificial Potential Field (IAPF), and Rapidly Exploring Random Tree Star (RRT*). ROS Noetic simulations on Gazebo involve a robotic manipulator (UR5),
 $q_{\textit{start}}$
(10,70,15),
 $q_{goal}$
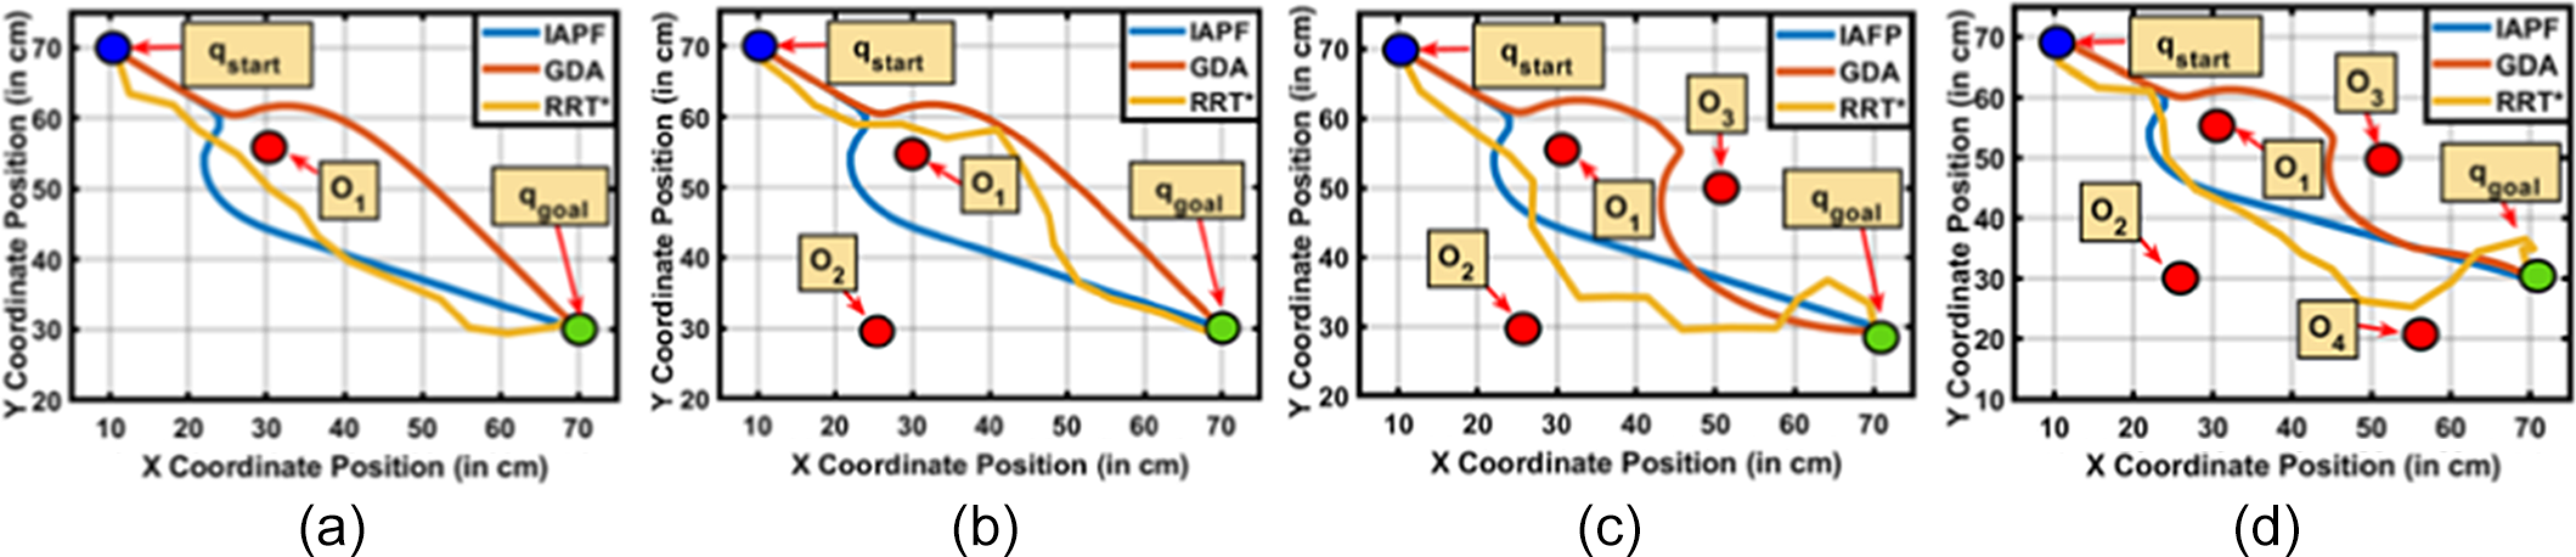
(70,30,5), and a complex environment with four obstacles: O1(30,55,20), O2 (25,30,20), O3 (52,50,20), O4(55,20,20). Diverse simulations performed offer a comprehensive algorithmic insight.
3.1. Varying number of obstacles
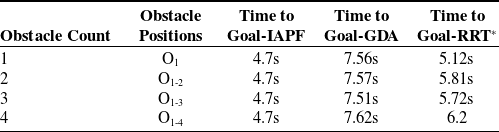
In Case 1 (Table I), IAPF (
 $K_{att}$
= 0.03,
 $K_{rep}$
= 0.1) performs better than GDA and RRT*, reaching the goal in 4.7 s. IAPF outperformed GDA by 37% and RRT* by 9% in obstacle-rich environments (Figure 6).
Varying number of obstacles.

3.2. Varying size of multiple obstacles
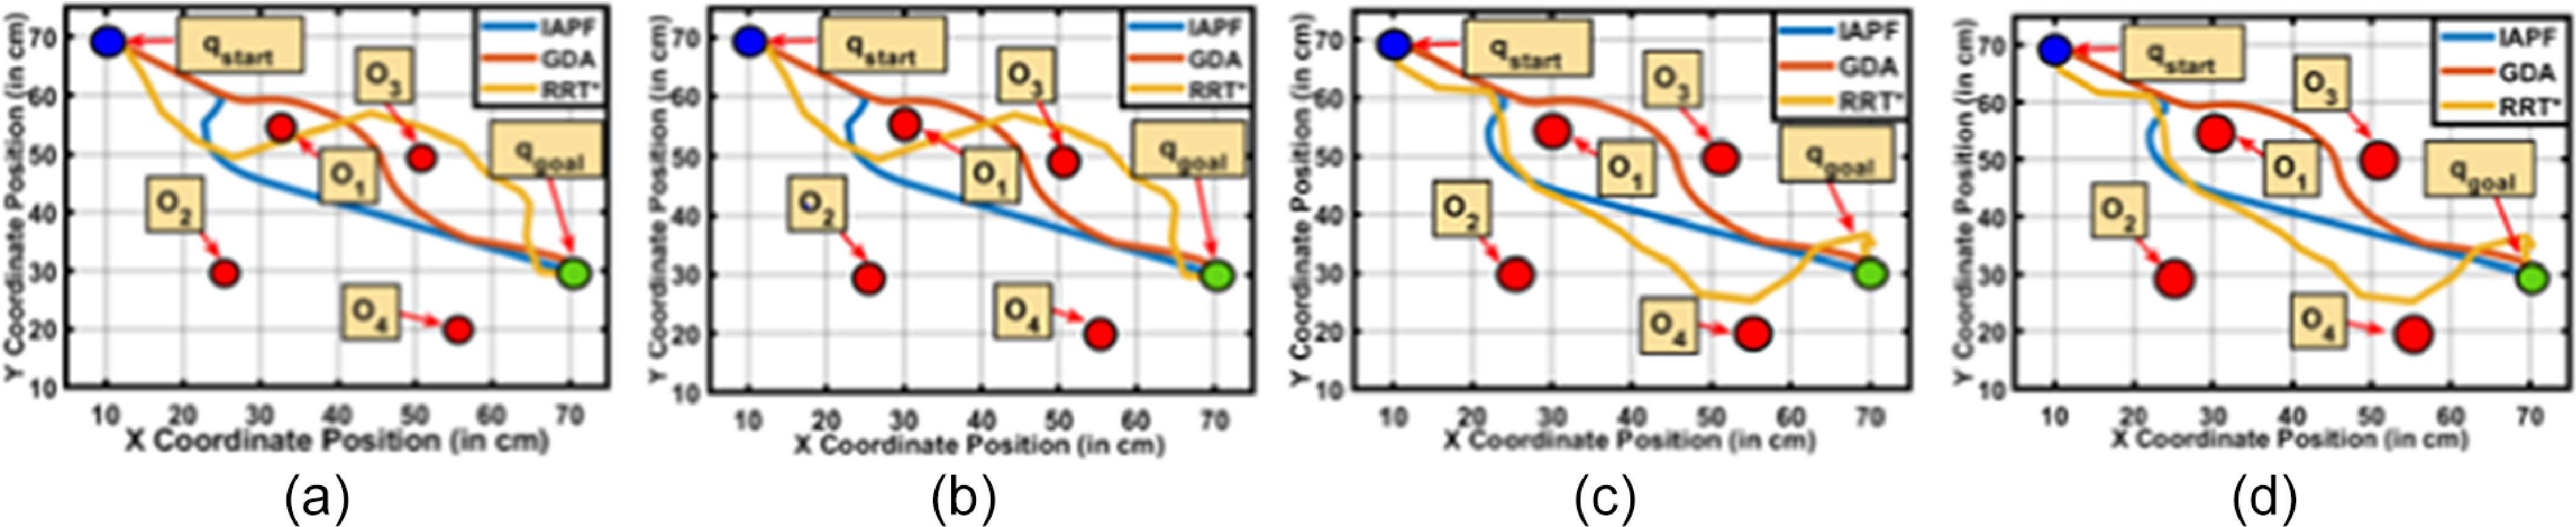
In Case 2 (Table II), we assessed how varying obstacle radii (2–3.5 cm) affected algorithmic performance with four obstacles. IAPF consistently completed tasks in 4.68–4.72 s, showcasing its real-world versatility with a 35% and 10% lead over GDA and RRT*, respectively (Figure 7).
Varying size of obstacles.

(a-d). Path planned on varying number of obstacles.

(a-d). Path planned on varying sizes of obstacles.

3.3. Multivariate scenario
In Case 3 (Table III), IAPF excelled, achieving times between 4.68 s and 4.72 s (
 $K_{att}$
= 0.03,
 $K_{rep}$
= 0.1). GDA required 7.54–7.74 s with specific parameters (
 $K_{rep}$
= 900,
 $K_{att}$
= 1/150,
 $d_{0}$
= 4), while RRT* performed competitively, ranging from 6.14s to 6.29 s. On average, IAPF outperformed GDA by 39% and RRT* by 4% (Figure 8).
Multivariate scenario.

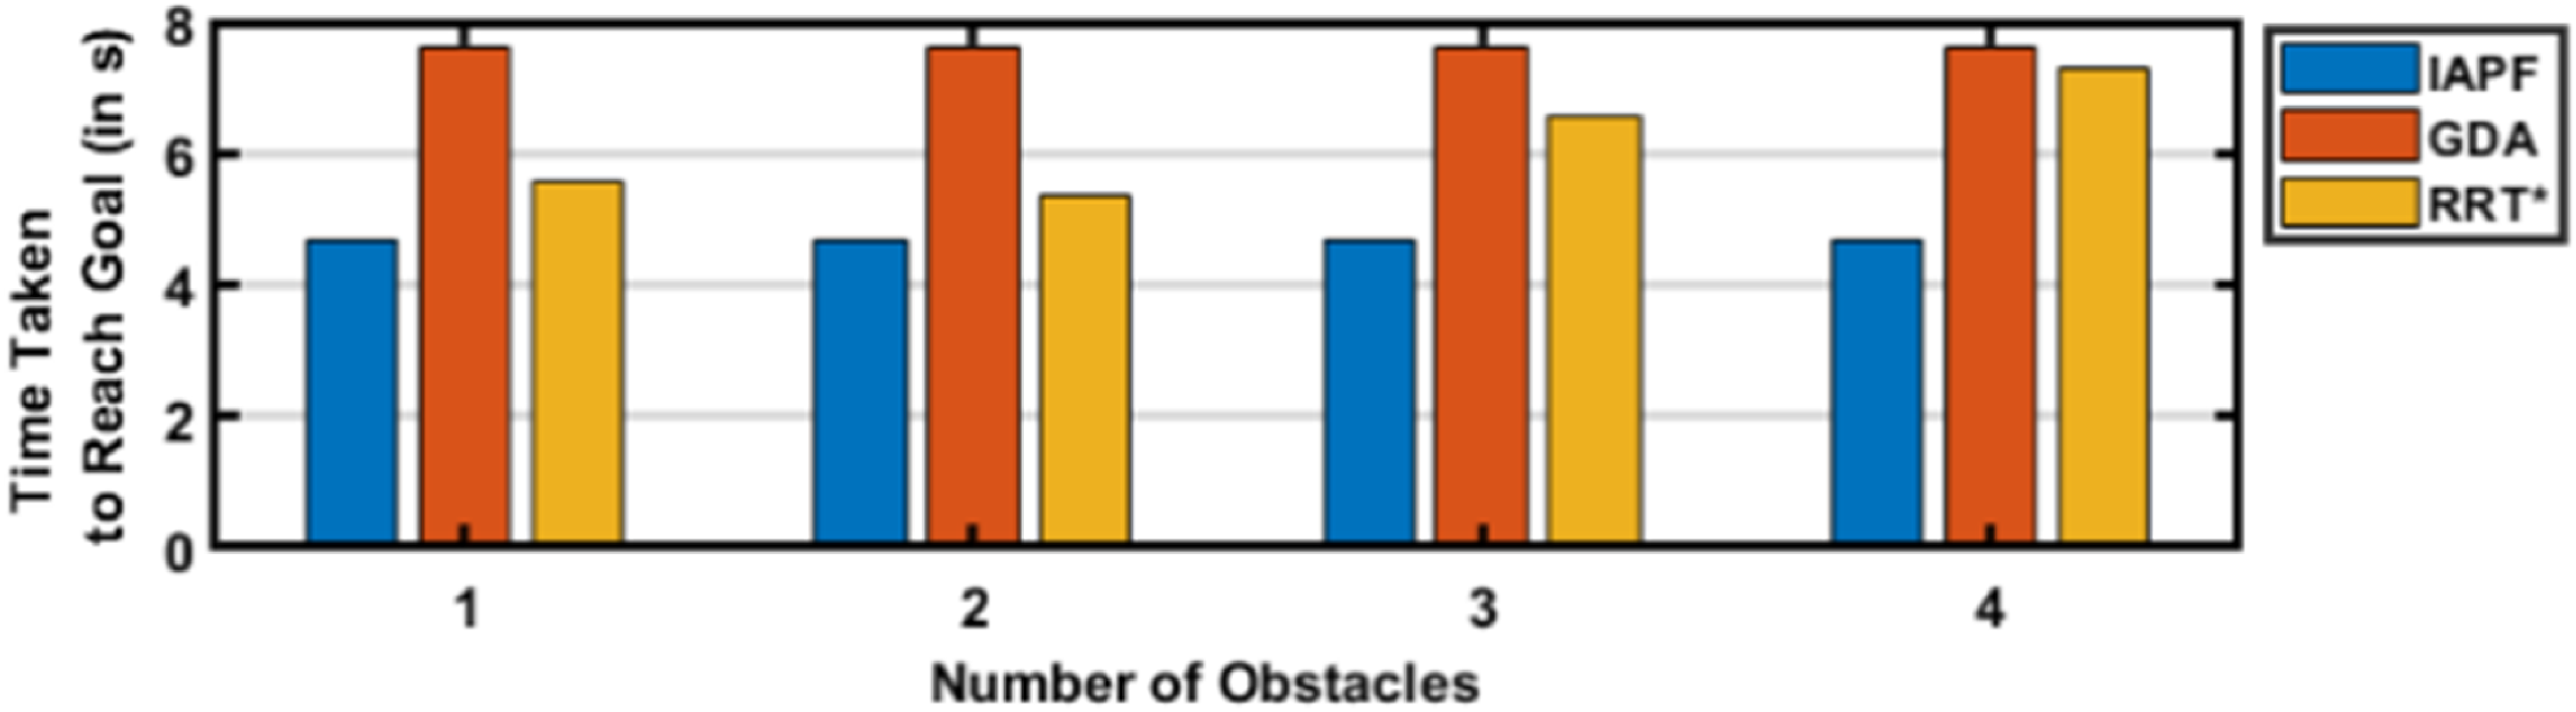
Varying height.

(a-d). Paths planned on multiple variations of obstacle sizes.

Statistical comparison of algorithms based on varying heights.

3.4. Varying heights
In Case 4 (Table IV), IAPF consistently reached the goal in 4.7 s, unaffected by varying obstacle heights. GDA took 7.61s, and RRT* ranged from 5.34 s to 7.32 s. On average, IAPF outperformed GDA by 37% and RRT* by approximately 21%, showcasing its adaptability to differing obstacle heights in complex settings (Figure 9).
3.5. Varying K (attractive) and varying K (repulsive)
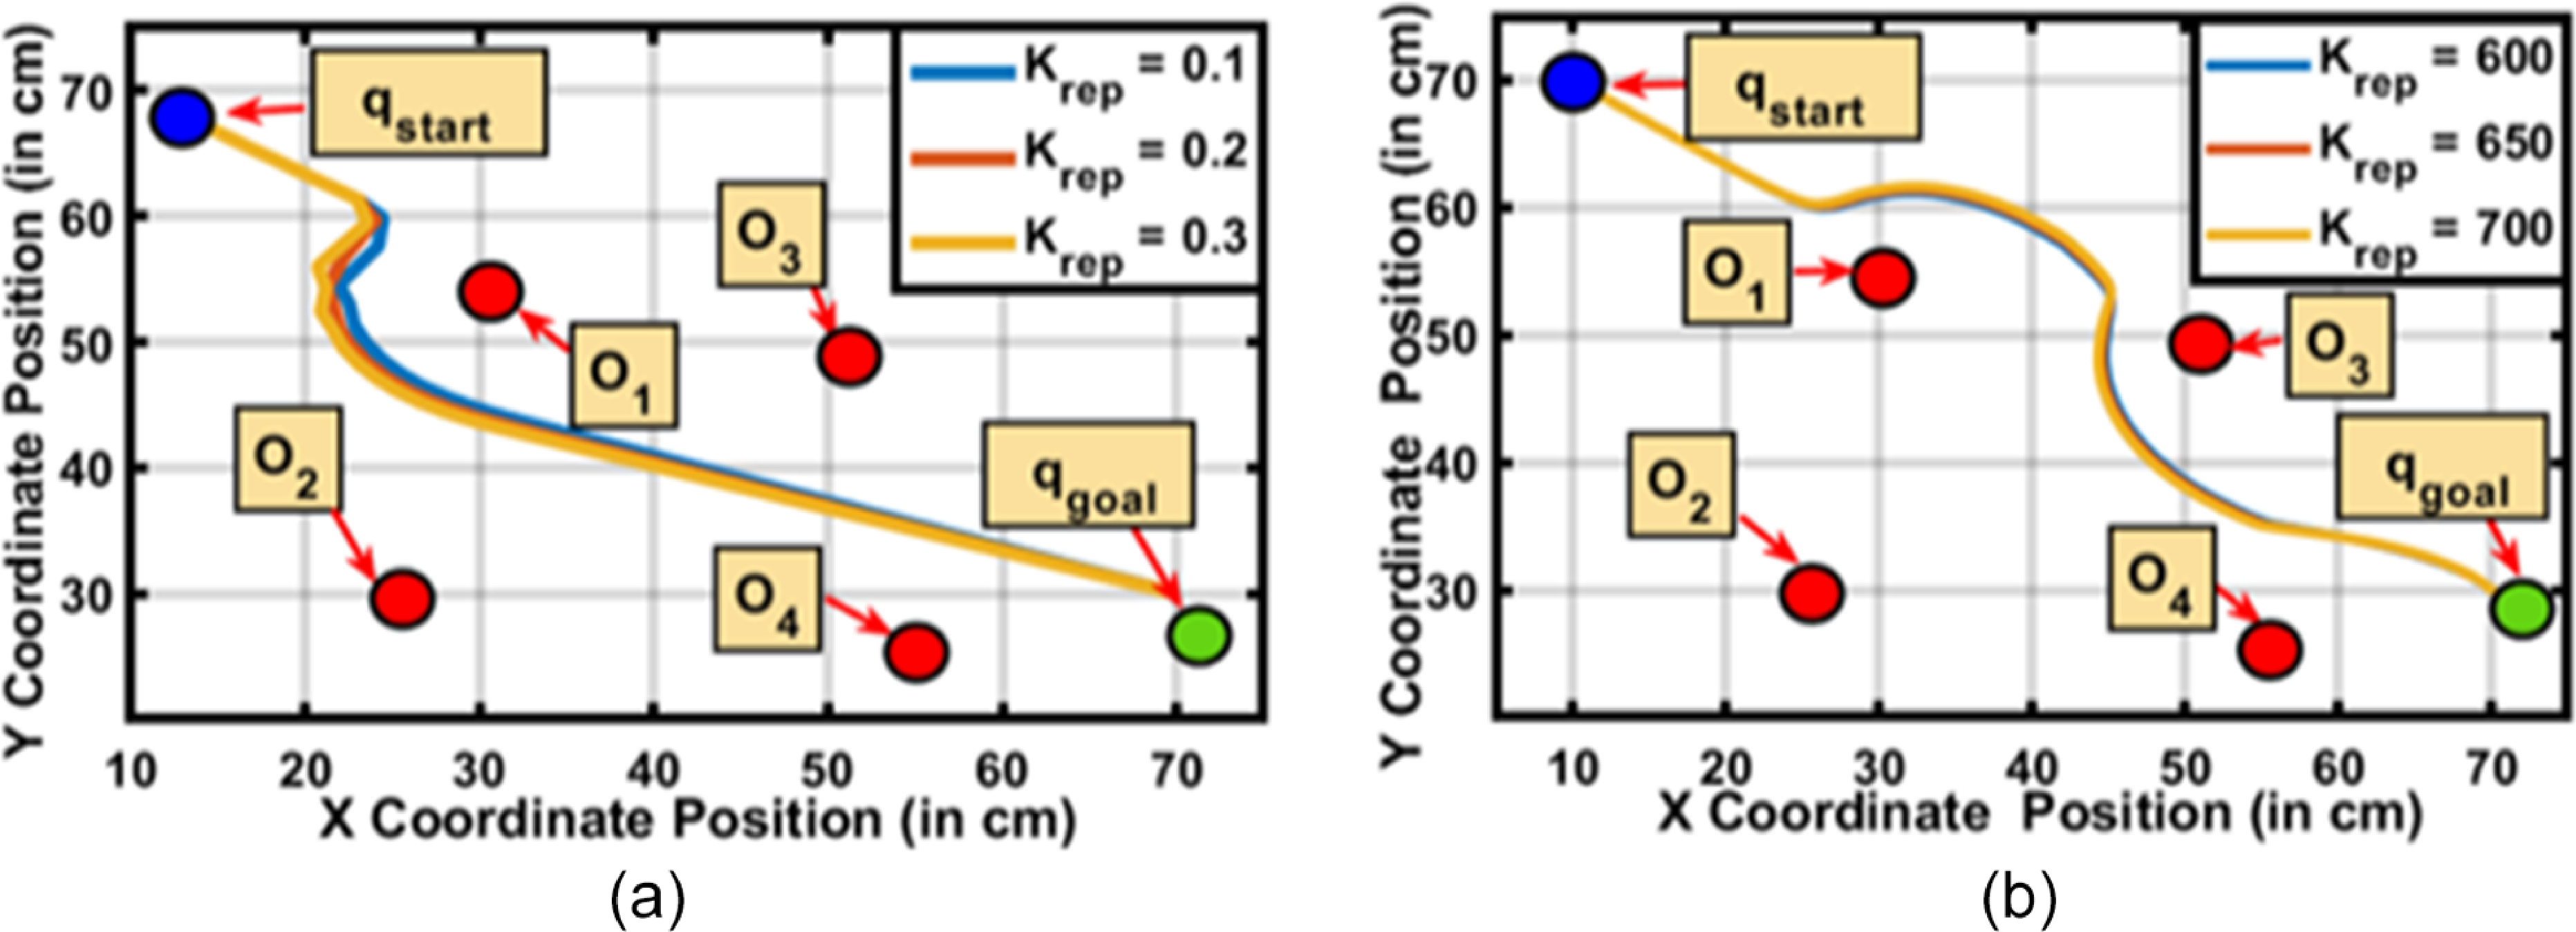
In Case 5 (Tables V and VI), comparing IAPF and GDA with varying
 $K_{att}$
and
 $K_{rep}$
constants at given locations, IAPF consistently reached the goal faster, highlighting its responsive dynamics (Figure 10). GDA had longer times of 7.48 s to 7.55 s, underlining its sensitivity to discrete updates.
Varying K (attractive).

Varying K (repulsive).

Varying
 $\mathrm{K}_{\mathrm{rep}}$
for (a) IAPF (b) GDA.

4. Experimentation
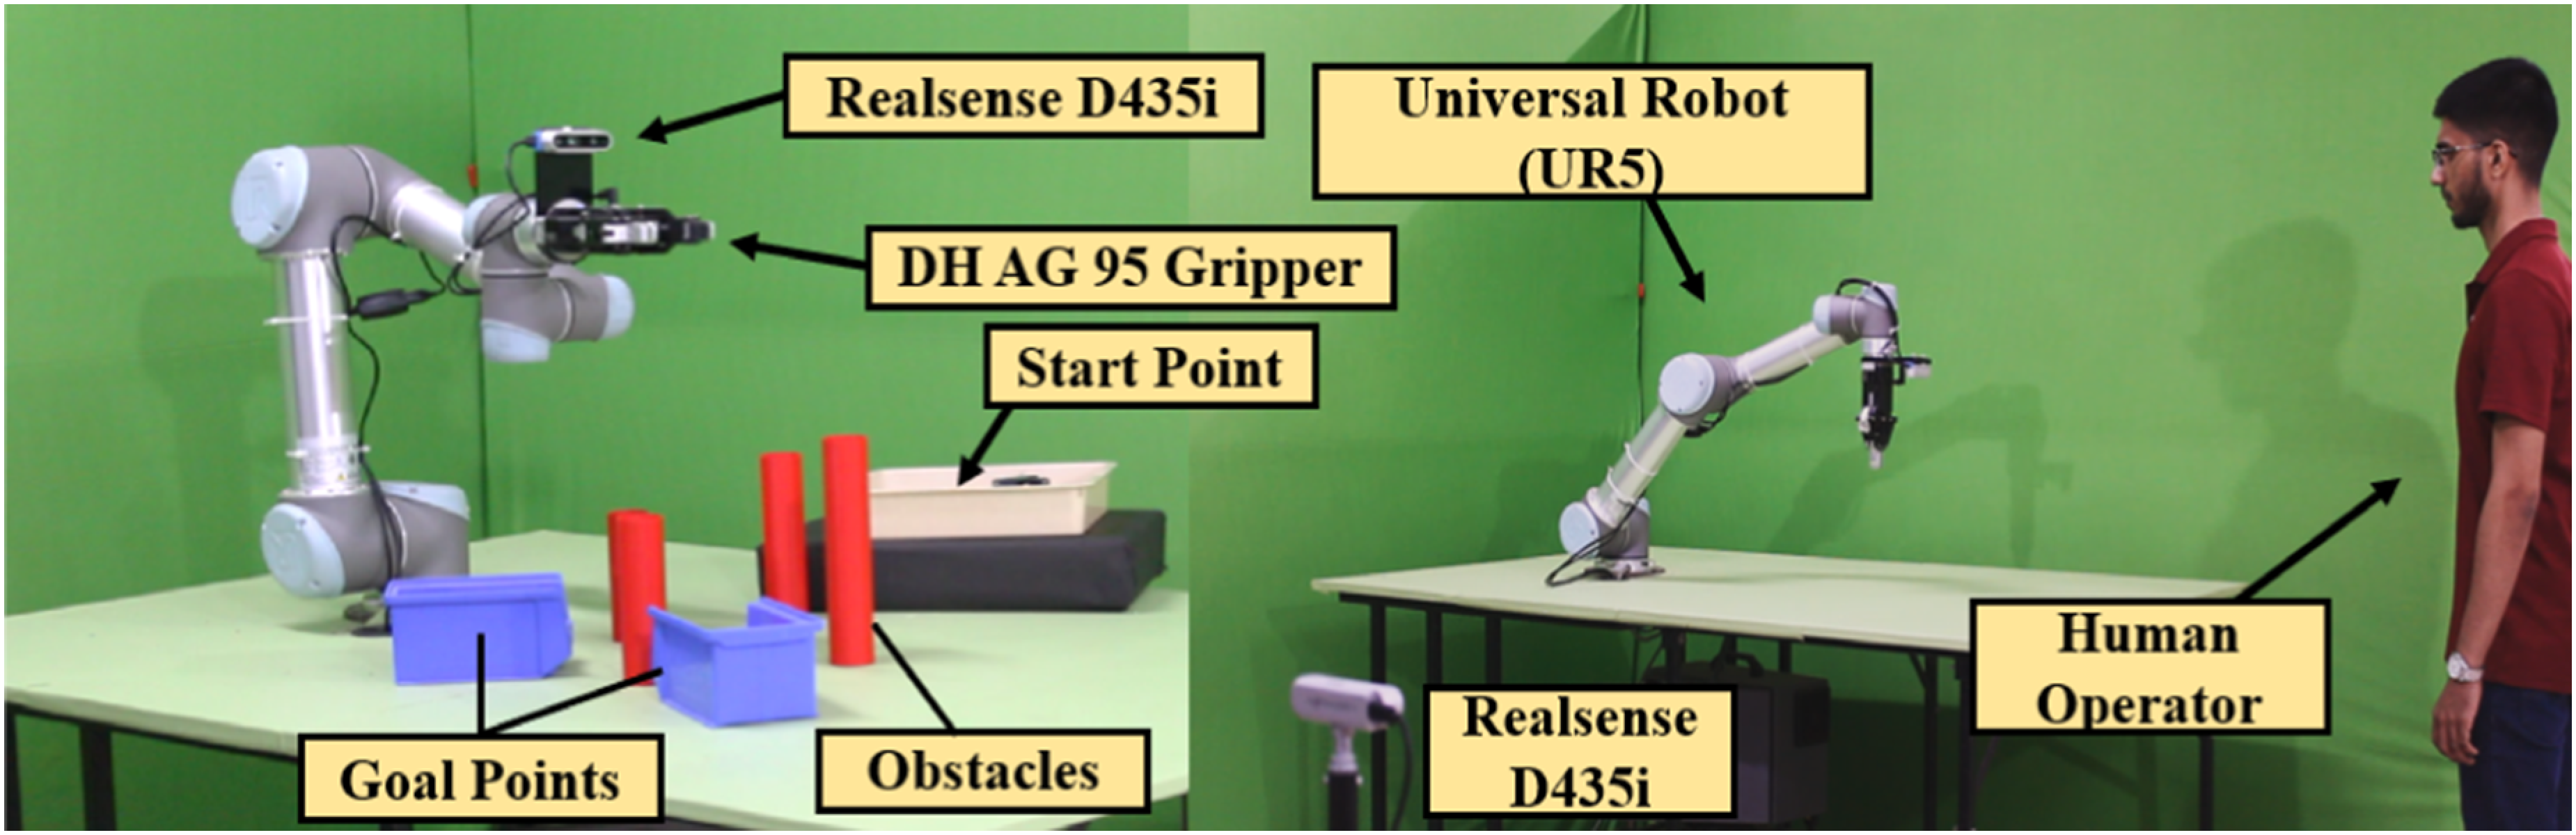
The proposed methodology has been experimentally validated by employing a UR5 manipulator with a DH AG-95 two-finger electrically actuated gripper, configured for industrial applications with 6 degrees of freedom. Two Realsense D435i cameras were utilized, one serving as the robotic "eye" for environmental perception and the other as a stationary camera dedicated for human pose tracking. The experiment setup, detailed in Figure 12 is operated within the ROS Noetic Ninjemys meta operating system [Reference Koubaa49] on an Intel Core i7-11370H Octa-core processor running Ubuntu 20.04, with motion planning facilitated by the Moveit framework [Reference Görner, Haschke, Ritter and Zhang50]. This framework was primarily used as a kinematics solver for computing inverse and forward kinematics, enabling seamless trajectory planning.
Human–robot spatial interactions were monitored using Mediapipe [Reference Lugaresi, Tang, Nash, McClanahan, Uboweja, Hays, Zhang, Chang, Yong, Lee and Chang51] for gesture recognition and skeletal tracking. Mediapipe extracted skeletal key points in real time, capturing human posture by identifying critical joints such as the head, torso, and limbs. This skeletal data were processed continuously to map the human operator’s movements within the workspace, enabling precise interaction monitoring. The stationary camera determined the human’s closest skeletal point, and the shortest distance between this point and the robot’s end-effector was computed using Euclidean geometry. These computations were performed at a consistent frame rate of 30 frames per second, matching the cameras‘ frame rates, to ensure real-time responsiveness. This dynamic interaction data are communicated through the ROS server-client model, involving transformation of the coordinates of the human obtained through the static camera to the robot’s base frame, providing real-time spatial awareness. This transformation ensures proper alignment between the human operator’s detected position and the robot’s workspace, allowing for accurate decision-making during collaborative tasks. Due to the UR5’s absence of a real-time velocity ROS interface, position control was employed.
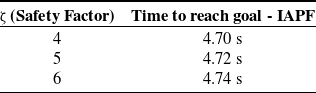
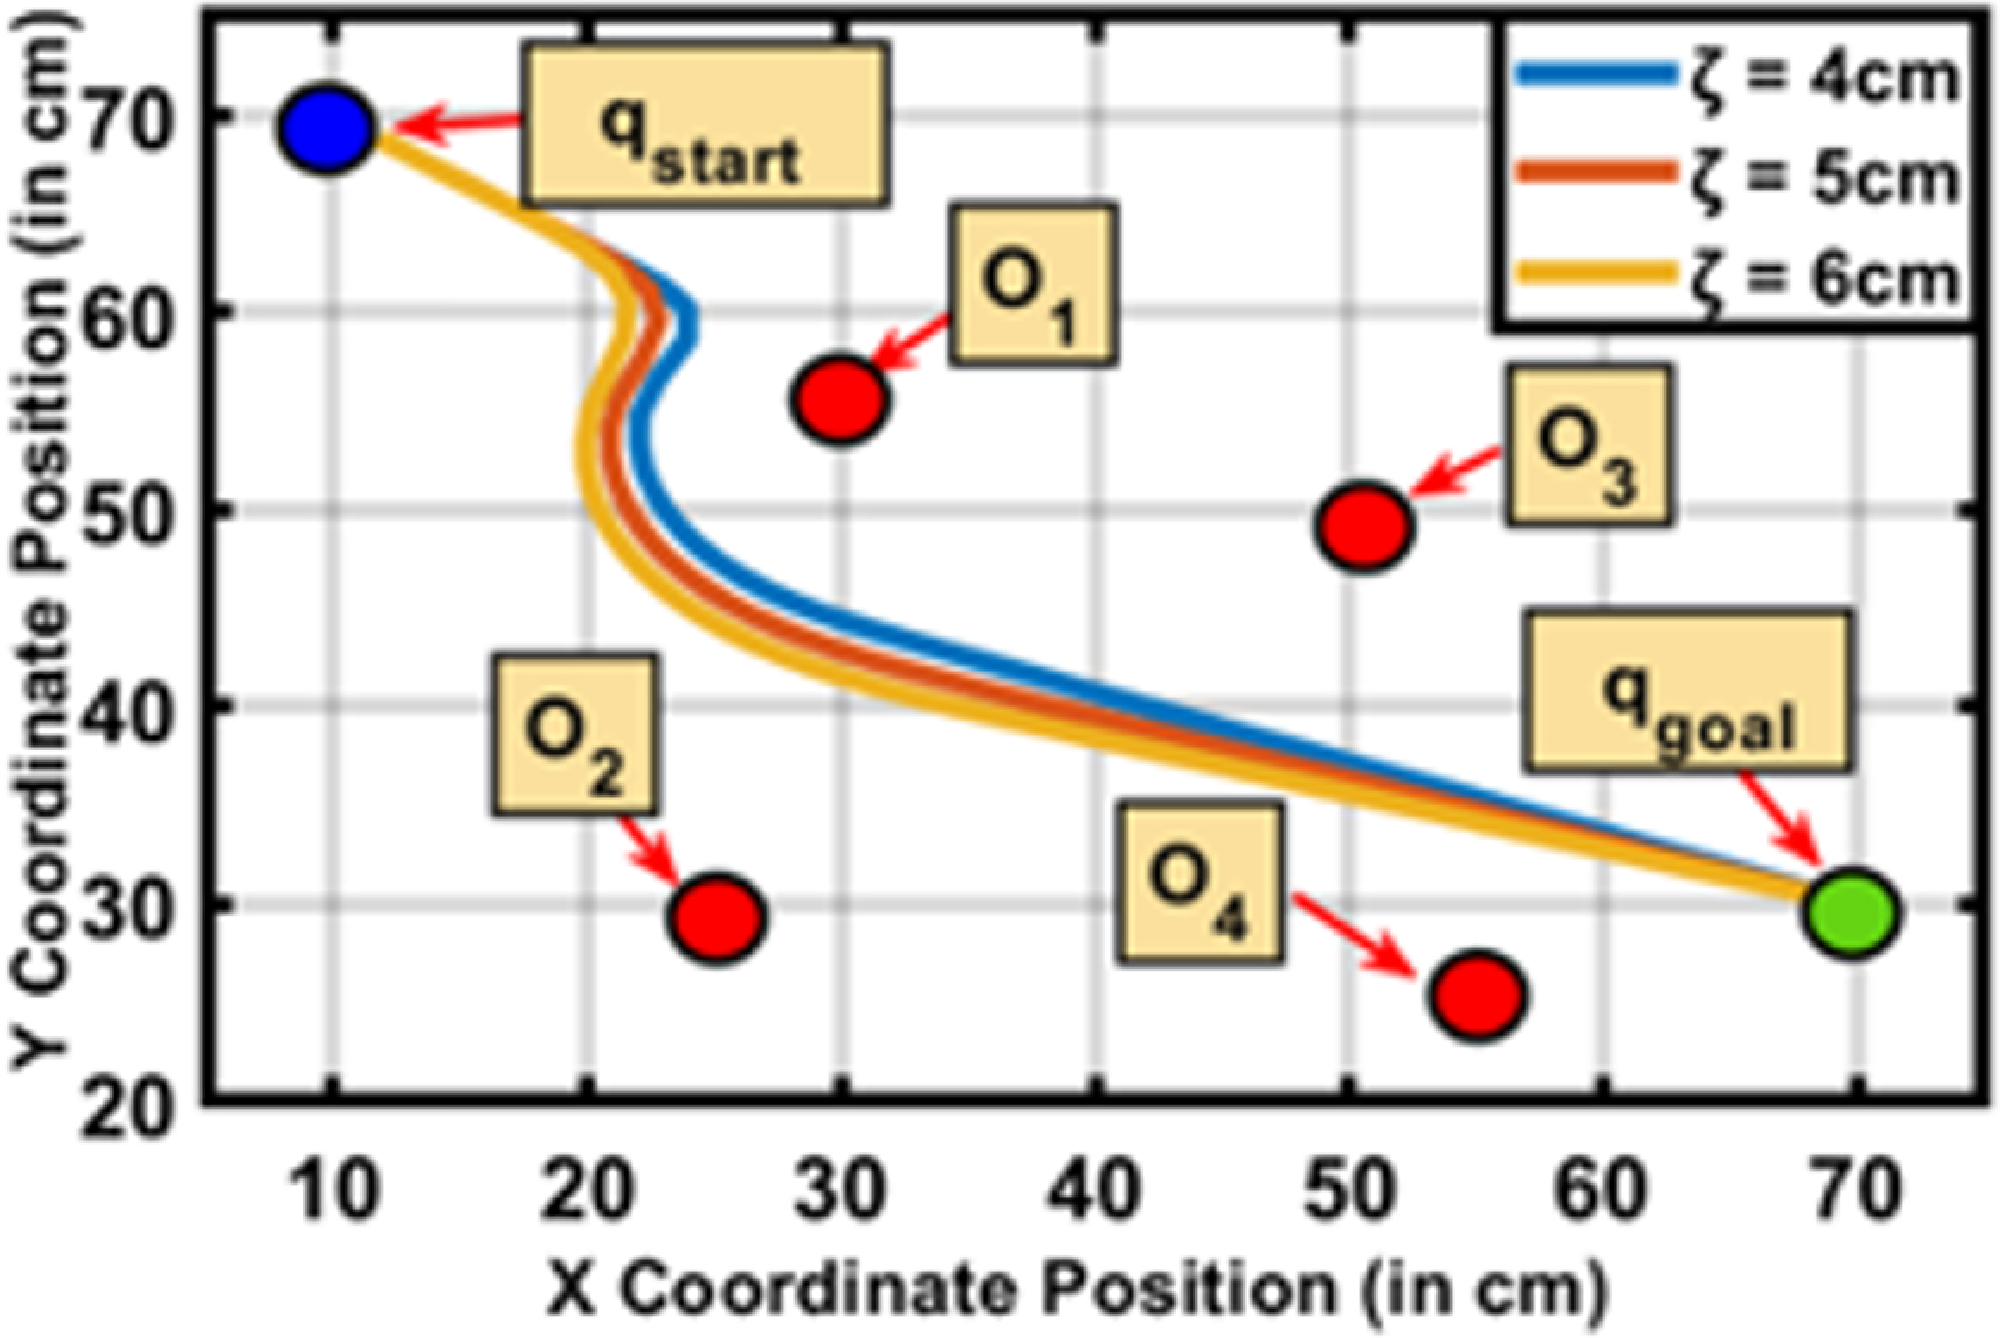
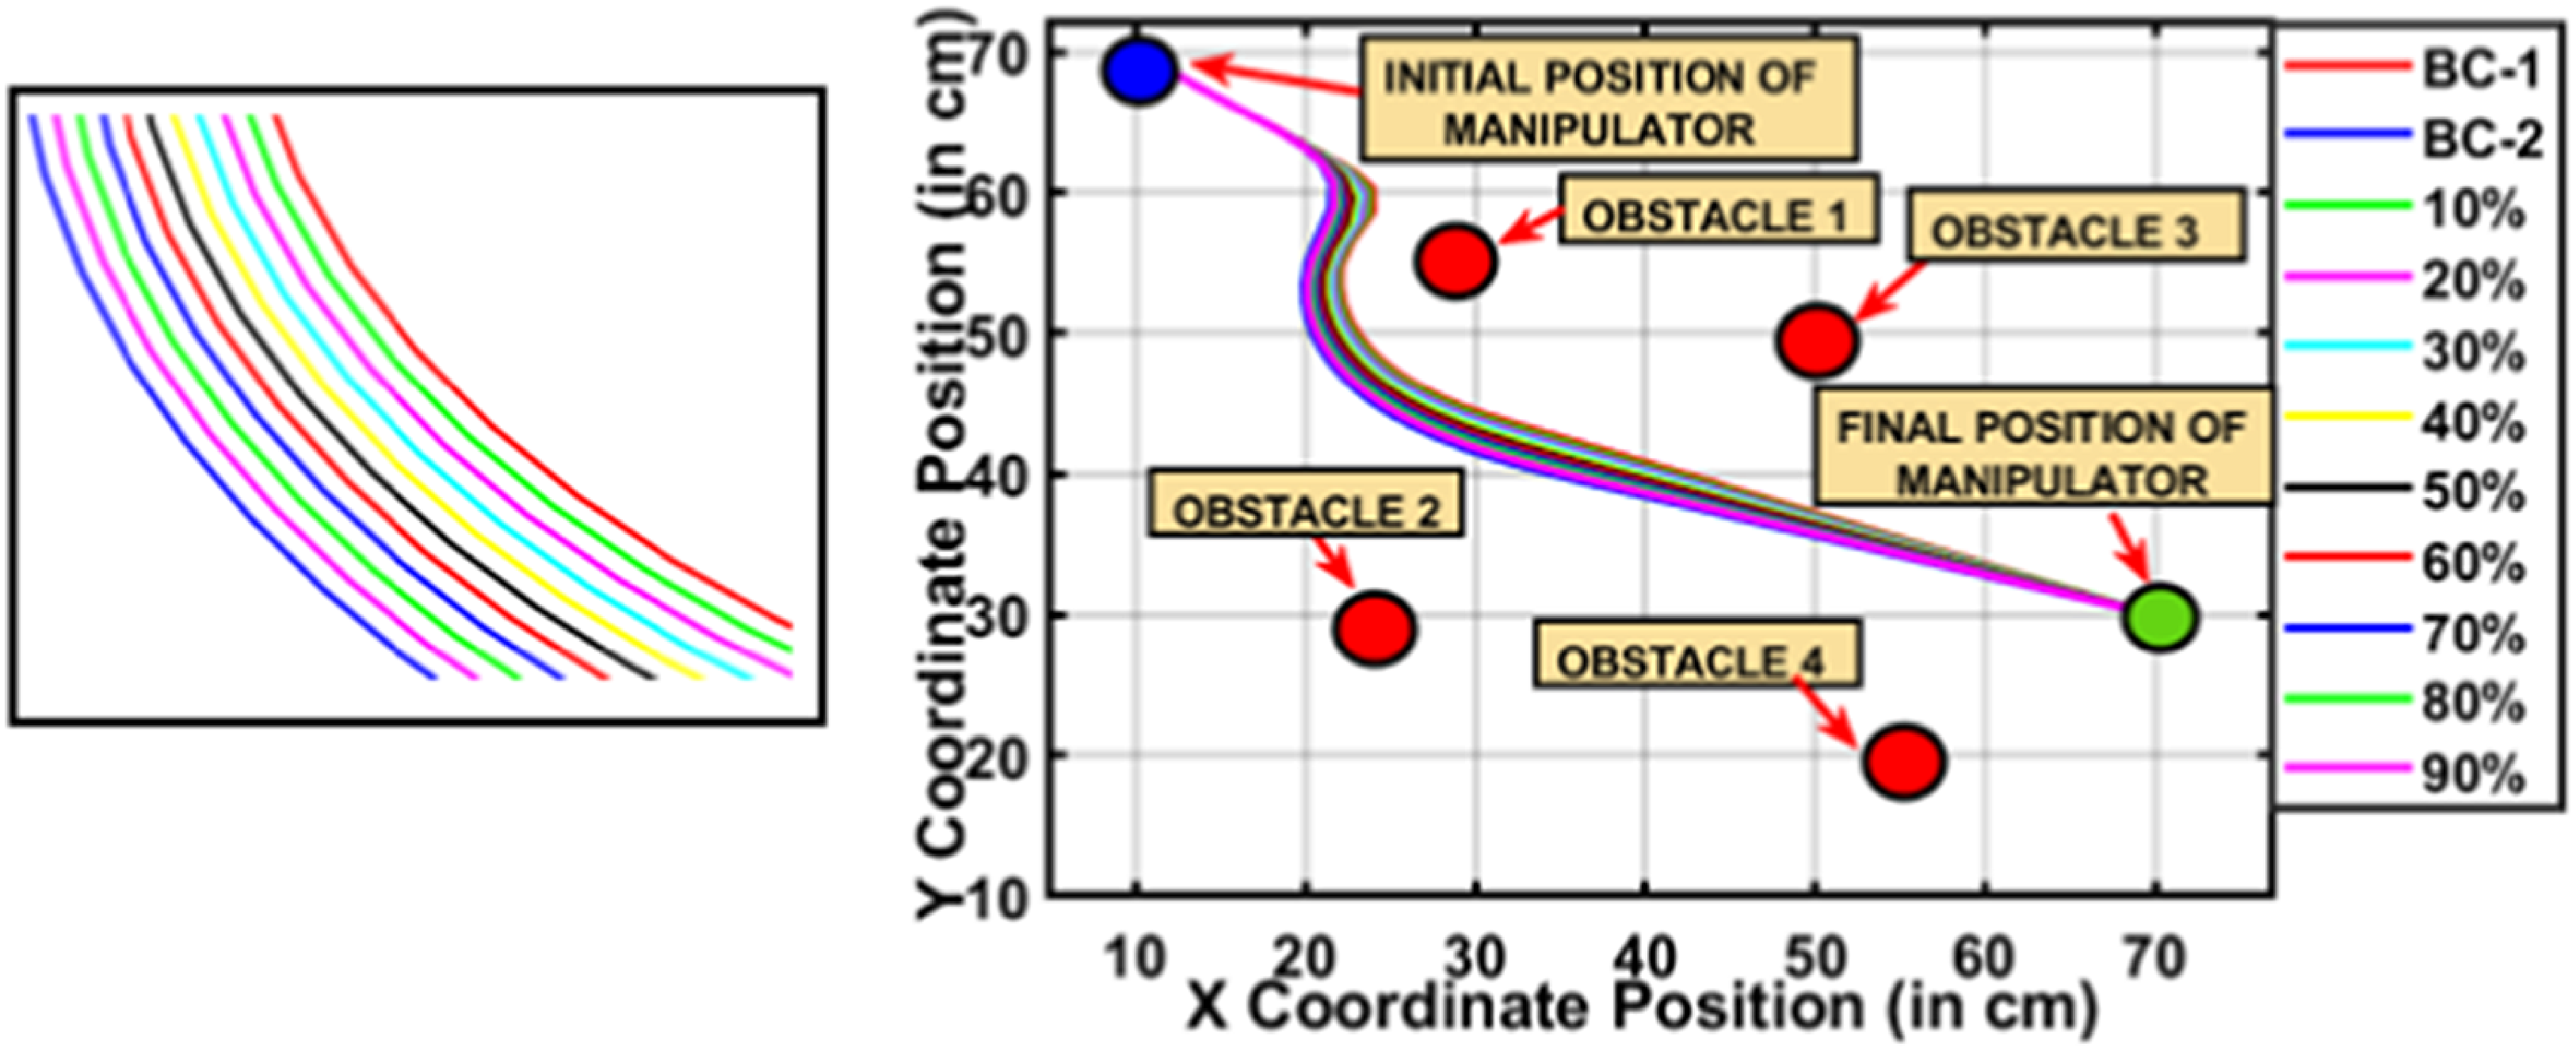
Varying safety factor.

Varying safety threshold.

Experimental setup.

The experimental validation involved two distinct scenarios to test the proposed framework’s robustness: unconstrained (ideal) and constrained. In the unconstrained scenario, the robot operated at full speed without obstacles or human intervention, providing a baseline performance metric. The desired path (Table VIII) in this scenario was predefined and extended from the start configuration
 $q_{\textit{start}}$
= (10,70,15) to the goal configuration
 $q_{goal}$
= (70,30,5) (Figure 13). The same predefined path was maintained for all scenarios in the study, ensuring consistency (Figure 14). However, in constrained conditions, the robot’s trajectory—defined in terms of velocity, acceleration, and timing—was dynamically replanned based on the proximity of the human operator. Importantly, this trajectory replanning was achieved without any deviations from the originally defined path geometry.
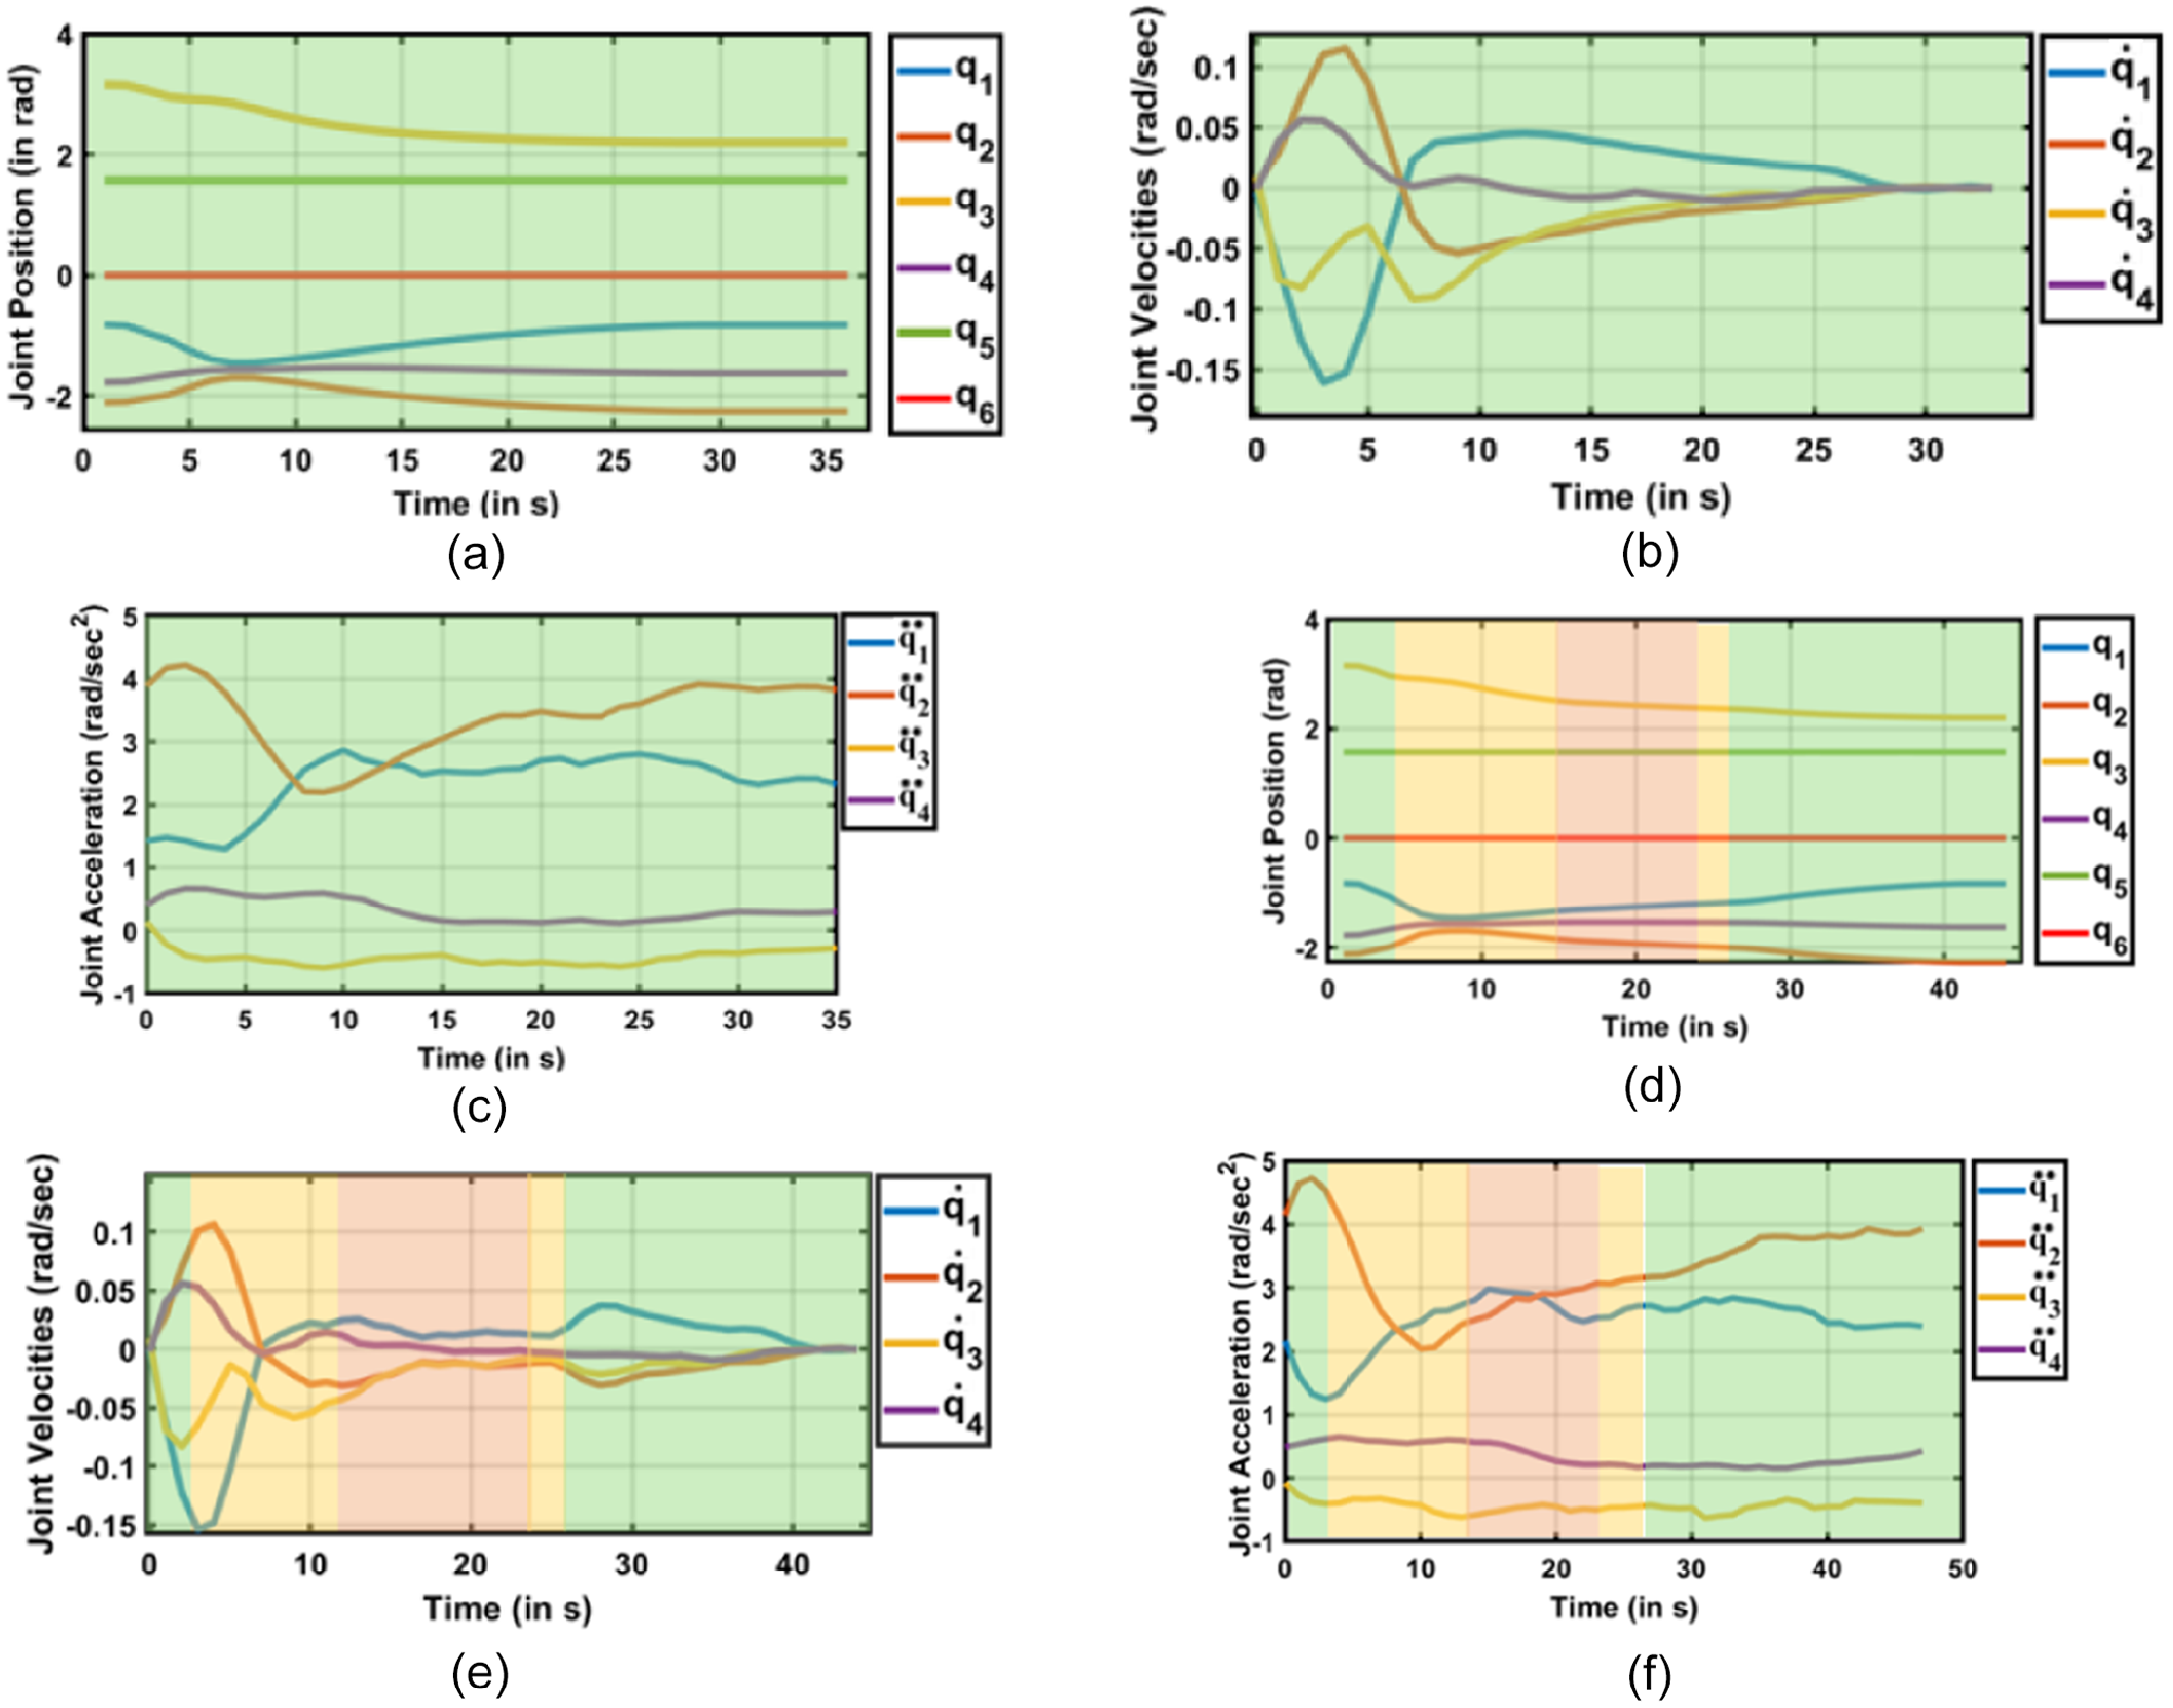
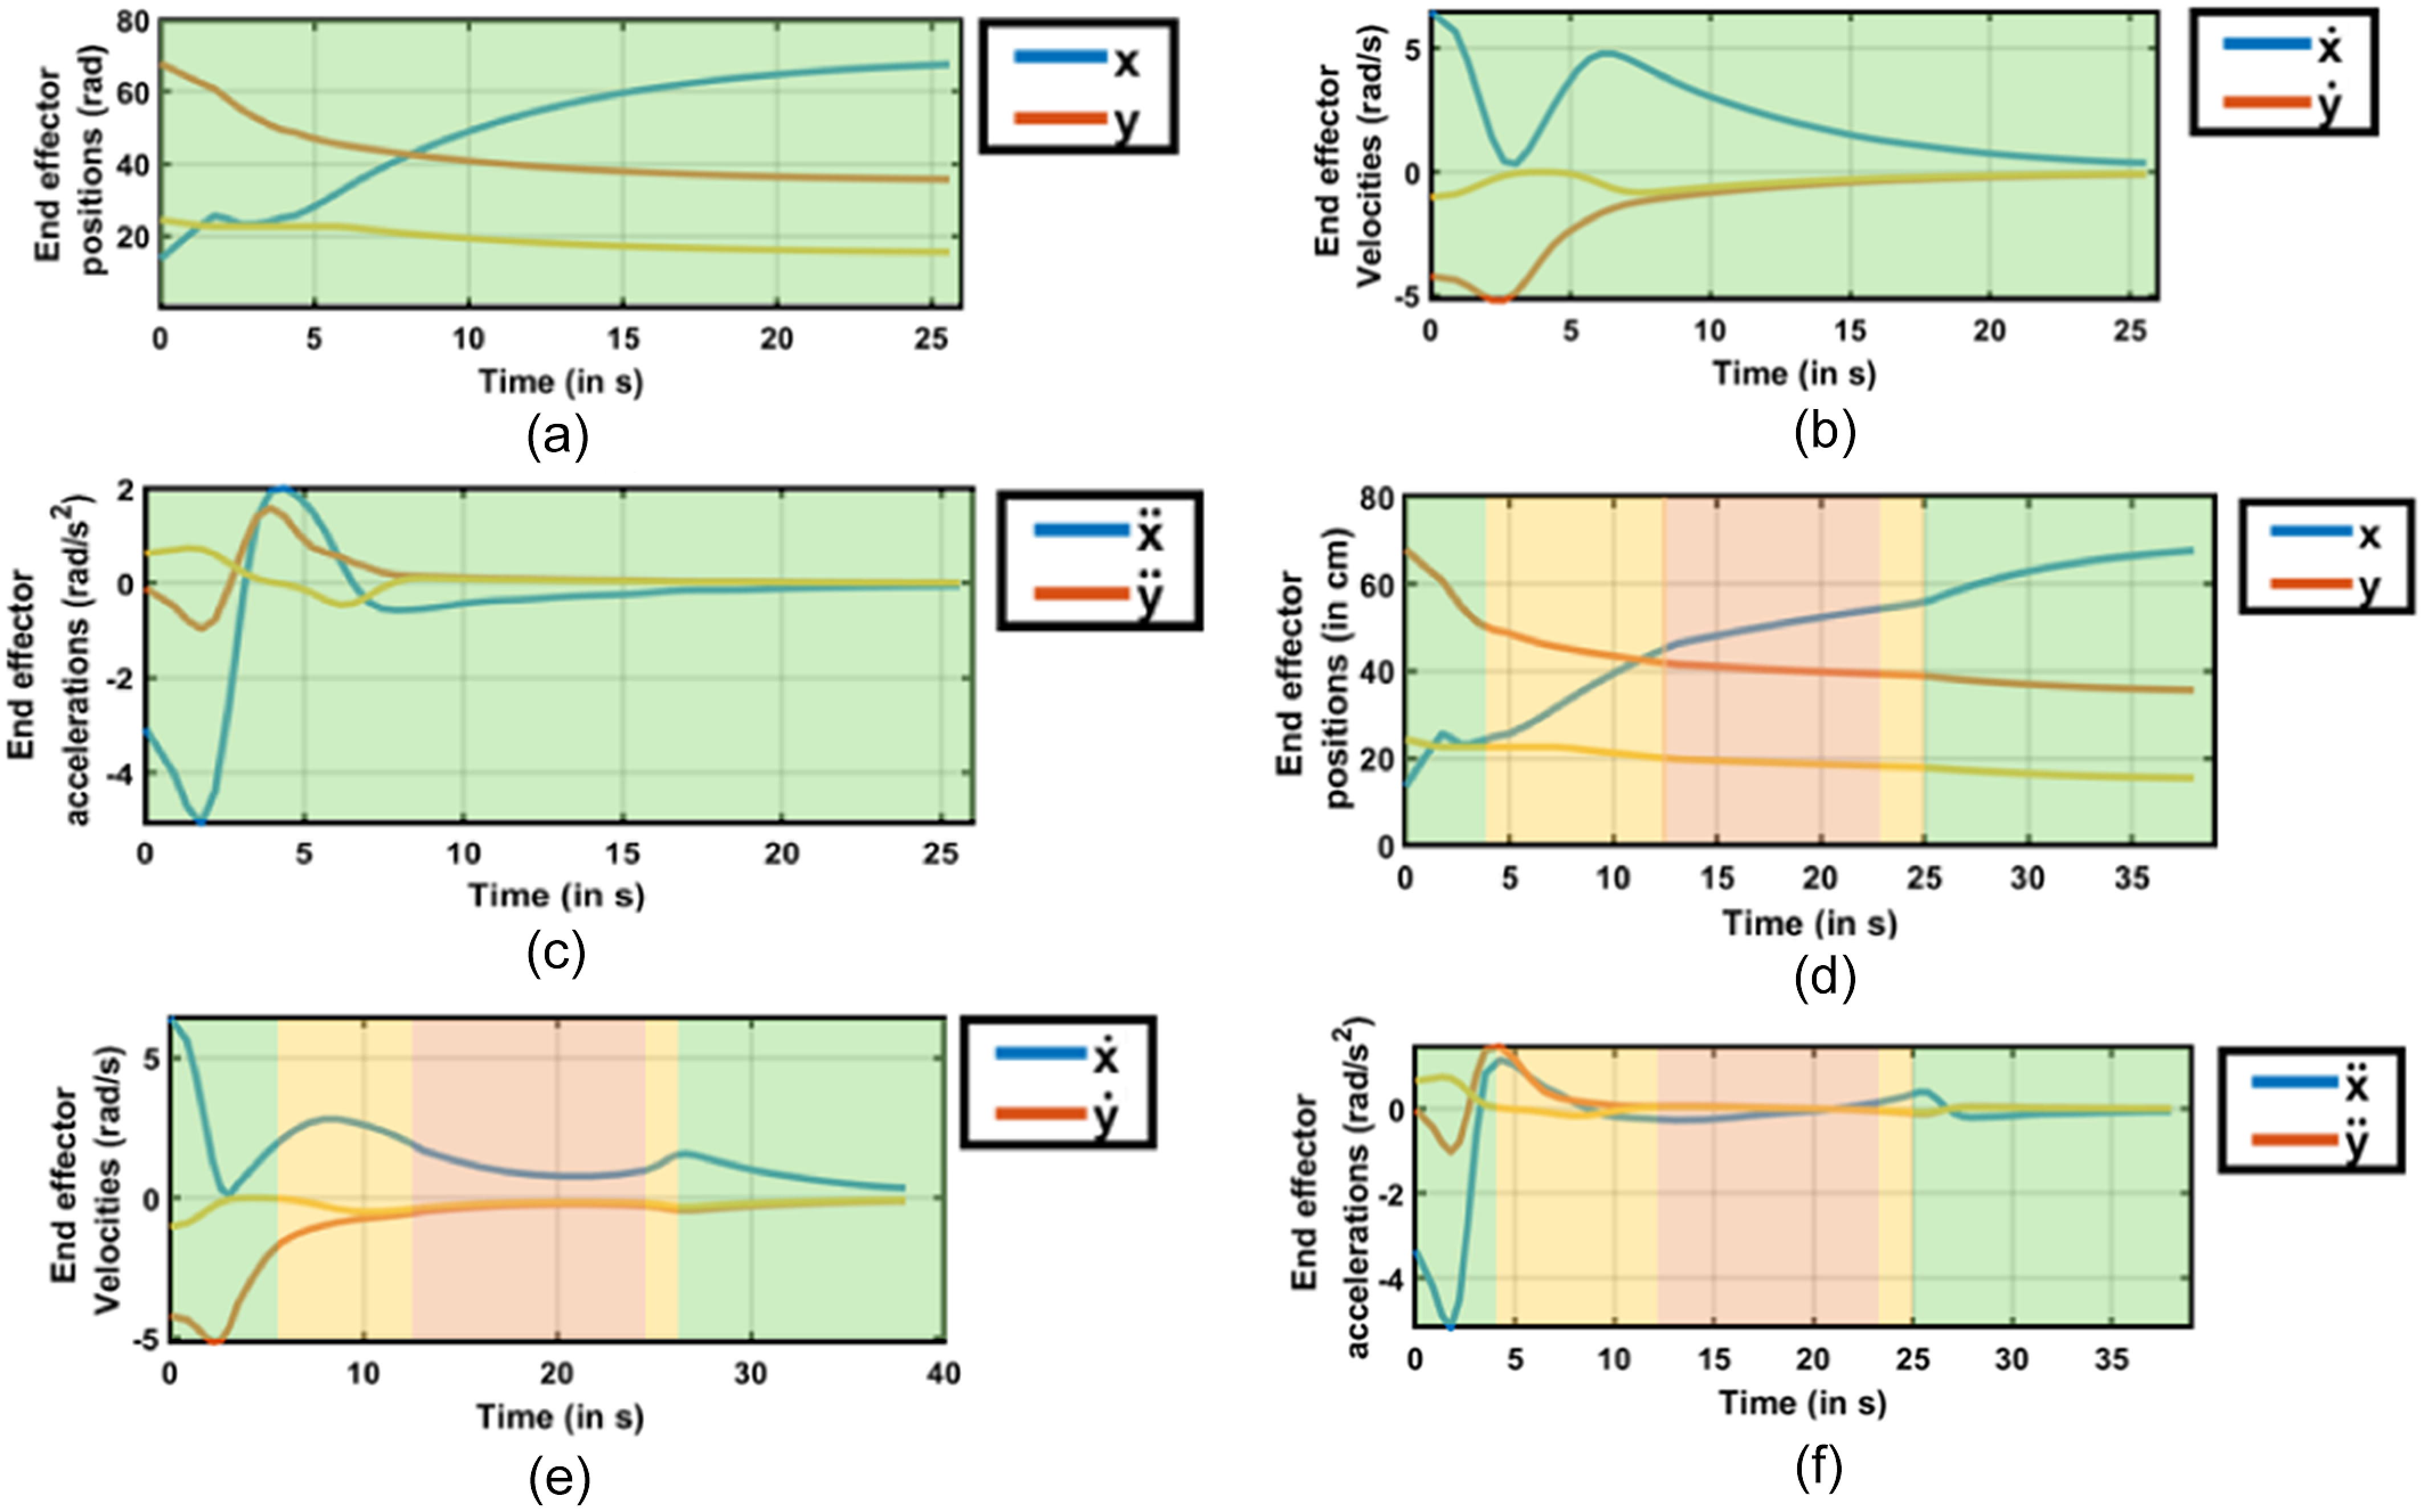
To ensure safety during constrained conditions, dynamic safety zones were utilized, adjusting the robot’s behavior relative to the distance between the human and the robot. The green zone represented a safe distance, allowing the robot to move along its path at maximum speed. In the yellow zone, the robot reduced its velocity to comply with cautionary safety thresholds, dynamically replanning its trajectory while maintaining adherence to the predefined path. Finally, the red zone marked the closest allowable proximity, where the robot reduced its velocity significantly to prioritize operator safety. While these real-time adjustments emphasized safety, they preserved the robot’s progress along the predefined path, demonstrating the capability of the proposed architecture to integrate safety without compromising task efficiency.
The study simulates an e-waste sorting scenario in a constrained industrial environment. The human operator’s task was to sort e-waste components, specifically motors and batteries, into designated bins within the workspace. This task required random movements by the human operator, creating dynamic and unpredictable proximity changes with the robot. The robot’s response to these changes was evaluated by analyzing its trajectory, defined by velocity and acceleration profiles, while executing the predefined path under varying proximity constraints. Figure 15(a-c) illustrates the robot’s trajectory characteristics in the unconstrained scenario, where it completed the path at maximum speed under ideal conditions. Figure 15(d-f) depicts trajectory adjustments resulting from dynamic replanning triggered by safety zone encroachments. These results highlight the robot’s adaptive response in maintaining safety while ensuring operational efficiency.
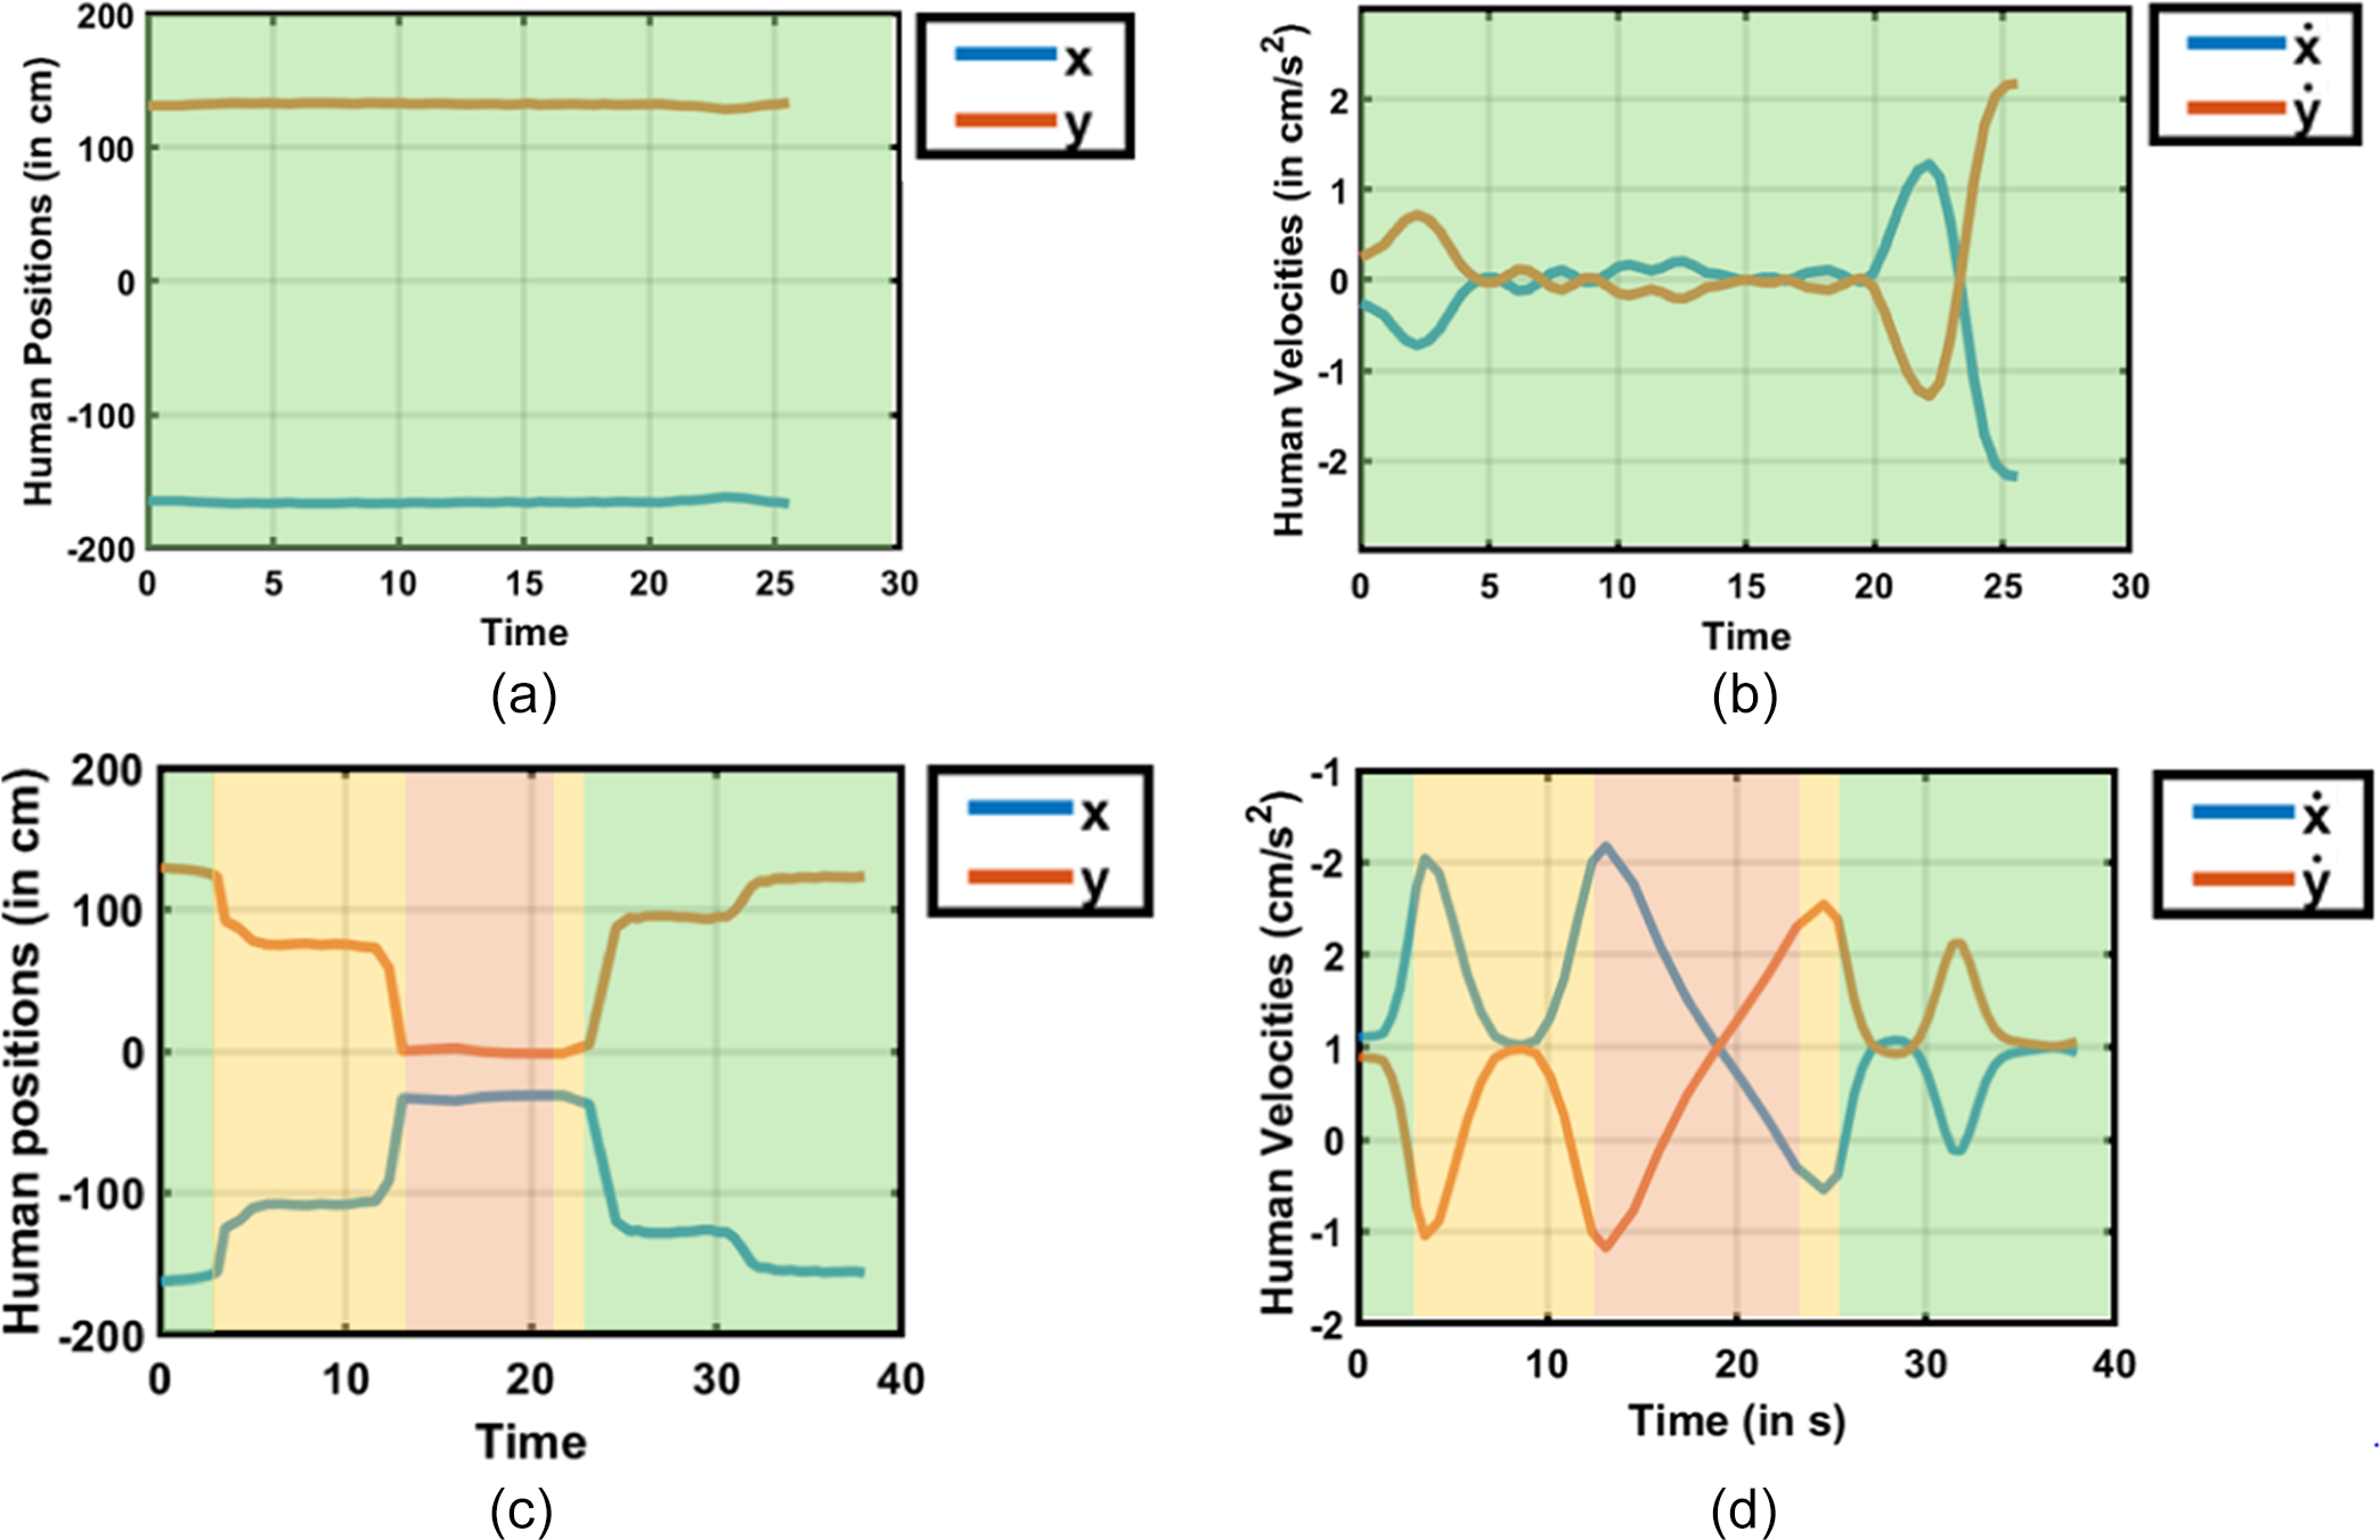
Further analyses were conducted to evaluate the motion of the robot’s end-effector and joint states as it traversed the operational workspace. Figure 16(a-e) provides detailed insights into the end-effector’s position and velocity, while maintaining the color-coded safety zones. These visualizations elucidate how the robot adjusted its motion parameters dynamically, preserving the balance between safety and task execution. Additionally, in Figure 17(a-b), the positional and velocity profiles of the nearest human skeletal point, as observed relative to the robot’s base frame, are presented. These behaviors were compared across different safety zone scenarios in Figure 17(c-d). The proximity-induced trajectory adaptations emphasize that safety compliance was achieved without altering the geometric path, showcasing the effectiveness of the proposed safety architecture in real-time HRC.
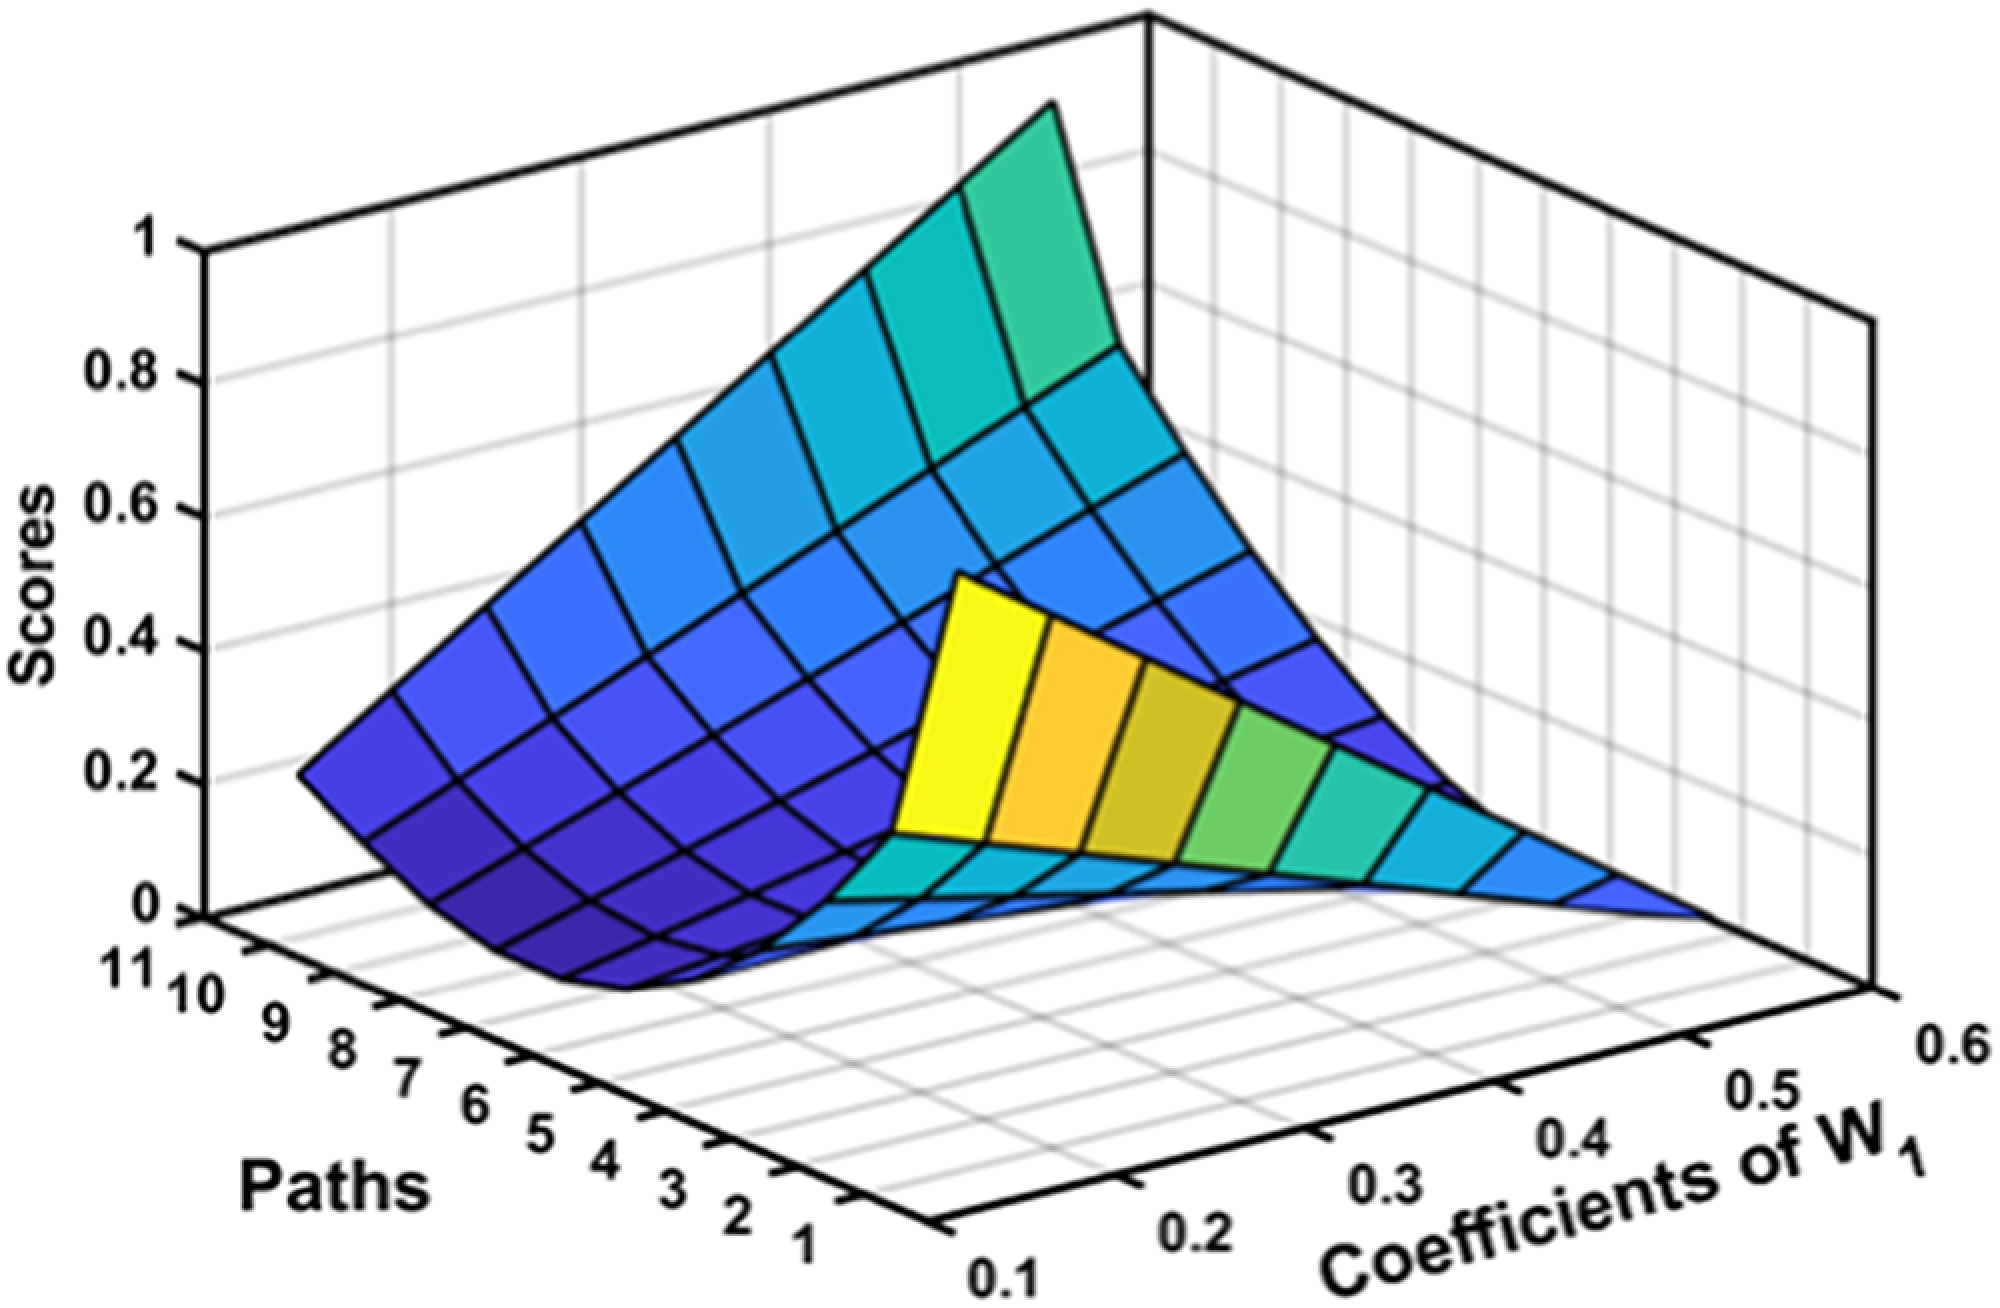
Scores obtained on optimization.

Path optimization.

Surface plot comparing the path scores.

Experimental scenarios (a-c) without safety zones (d-f) with safety zones.

End effector’s position, linear velocity, and accelerations vs. time (a-c) without safety zones (d-f) with safety zones.

(a-d). Position and velocity profile of nearest human points.

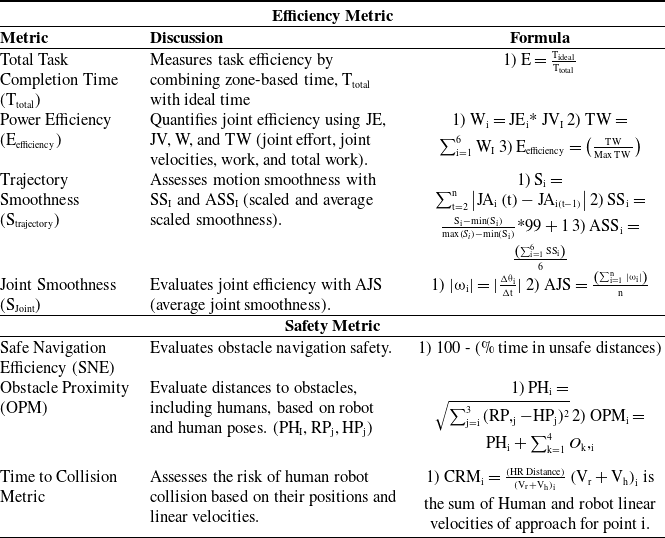
Performance evaluation metric [Reference Crandall, Goodrich, Olsen and Nielsen52–Reference Kulic and Croft56].

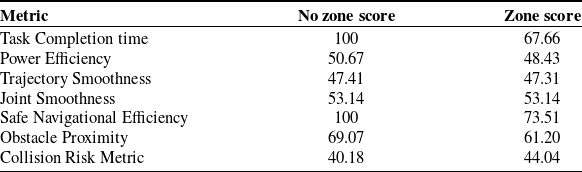
Performance evaluation metric scores.

5. Performance evaluation metric
In advancing HRI systems, we introduce a unified performance metric seamlessly combining safety and efficiency. This innovative metric offers a clear, trustworthiness score enabling reliable interactions. Based on the parameters that are discussed in Table IX, we have obtained the results for the experimental cases as highlighted in Table X. The final performance metric is calculated as follows:
 \begin{align*} \text{Overall Score}=\text{Safety Score}\mathrm{*A}+\text{Efficiency Score}\mathrm{*B}\\[-30pt] \end{align*}
In this equation, A and B represent the weights assigned to the safety and efficiency scores, respectively. The performance evaluation metric introduced in this study integrates safety and efficiency to provide a holistic assessment of our novel motion planning framework in HRI contexts. Unlike simplistic approaches, our metric is meticulously designed to reflect the dual priorities of safety and efficiency crucial in industrial settings.
Each metric component is carefully chosen based on rigorous analysis and relevance to real-world scenarios [Reference Crandall, Goodrich, Olsen and Nielsen52–Reference Kulic and Croft56], ensuring a balanced evaluation. Safety parameters weighted at 0.4, 0.3, and 0.3, while efficiency metrics are weighted at 0.3, 0.3, 0.1, and 0.3, respectively (based on Table IX order). These weights are determined through iterative refinement and sensitivity analysis, aiming to capture the critical aspects of operational safety and task efficiency that impact overall system performance.
The proposed solution-based system achieved a score of 83.87% relative to the system without zones, affirming concurrent reliability in safety and efficiency. Safety and efficiency scores obtained were 61% and 55%, respectively. The final performance score, computed with specific weights ‘A = 0.8’ and ‘B = 0.2,’ encapsulates a comprehensive evaluation. This score underscores the system’s nuanced collaborative capabilities, emphasizing the ongoing refinement required for heightened trustworthiness in operational contexts.
Furthermore, the formulation of our performance evaluation metric builds on existing methodologies in HRI research [Reference Crandall, Goodrich, Olsen and Nielsen52–Reference Kulic and Croft56], integrating and refining them to develop a unique metric specifically designed for the challenges presented by dynamic industrial environments. While this study primarily focuses on quantitative assessments, we also plan to incorporate qualitative user studies and field validations in future work to enhance the metric’s applicability and robustness. This structured approach ensures that our performance evaluation metric not only provides a clear and interpretable score but also lays the groundwork for establishing standardized metrics that are vital for fostering trust and reliability in human–robot collaborative systems. By combining insights from established metrics with our original contributions, we aim to advance the discourse in safety and efficiency within collaborative settings.
6. Conclusion
In this study, we present a kinematic strategy designed for safe and energy-efficient motion planning within industrially confined spaces, where the feasibility of replanning is constrained. Our approach leverages gesture-based communication to facilitate operator-task space mapping, enhancing adaptability and mitigating search space complexities. The efficacy of our proposed framework is demonstrated through the acquisition of optimal paths and subsequent experimental evaluation, showcasing its effectiveness in human–robot collaborative scenarios. Our proposed approach exhibits an efficiency of 83.87% on evaluation in comparison to a baseline ideal case scenario of human robot safety. Comparative analyses against analogous scenarios and base algorithms instill confidence in the applicability of our approach in real-world settings.
Our future work is geared toward refining motion planning in confined spaces through predictive control mechanisms to generate smoother speed profiles. We recognize the critical necessity for a universal standardized metric for safe HRC, with a focus on delivering trustworthy values to instill a sense of security among human operators. Additionally, we plan to conduct user studies to validate the safety and effectiveness of our approach in real-world settings, ensuring that our methods meet the practical needs of human operators. We also aim to extend this work to mobile manipulators, further advancing safety measures within diverse operational environments.
By integrating quantitative metrics and emphasizing the pivotal role of our approach in addressing real-world challenges, we aim to underscore the significance of our contributions. The pursuit of enhanced motion planning and the establishment of standardized safety metrics, need for time optimal path planning and teleoperation-based task space mapping align with broader objectives of of ensuring seamless and safe HRIs in industrial settings.
Supplementary material
To view supplementary material for this article, please visit https://doi.org/10.1017/S0263574725000323.
Acknowledgments
The authors acknowledge the support of the Robotics and Autonomous Systems group at Brunel University and the Robert Bosch Centre for Cyber Physical Systems at IISc Bangalore. We also thank Mr. Yu She, Mr. Mark Plecnik, Mr. Roel Pieters, Mr. Gianmarco Pisanelli, and Mr. Xuesu Xiao for discussions on robot CAE, HRI dynamics design, and motion planning. We also acknowledge the useful feedback provided by Mr. Gerd Herzinger & Ms. Barbara Schilling (TU Munich) and Ms. Averil Horton (Brunel).
Author contributions
Darren Alton Dsouza: DAD; Shravan Shenoy: SS; Mingfeng Wang: MFW: Abhra Roy Chowdhury: ARC. DAD and ARC contributed to conceptualization. DAD and SS contributed to data collection. DAD and ARC contributed to formal analysis. ARC contributed to funding acquisition. DAD and SS contributed to investigation. DAD, SS, and ARC contributed to methodology. DAD and ARC contributed to project administration. MFW and ARC contributed to resources. ARC contributed to supervision. DAD, MFW, and ARC contributed to validation. DAD, MFW, and ARC contributed to manuscript draft. DAD, MFW, and ARC contributed to manuscript review and edit.
Financial support
This work is supported by the CORE grant CRG2021006698 from the Department of Science and Technology (DST), Government of India, and the Indo-UK Brunel Fellowship Academy (IKB) Grant in digital manufacturing project.
Competing interests
The authors declare no conflicts of interest exist.