1. INTRODUCTION
Nuclear fusion processes are expected to occur quite easily in ultra-dense deuterium D(-1) due to its large density of 1029 cm−3 or 140 kg cm−3 (Badiei et al., Reference Badiei, Andersson and Holmlid2009a; Reference Badiei, Andersson and Holmlid2009b; Reference Badiei, Andersson and Holmlid2010a; Reference Badiei, Andersson and Holmlid2010b; Andersson & Holmlid, Reference Andersson and Holmlid2009; Reference Andersson and Holmlid2010; Reference Andersson and Holmlid2011; Reference Andersson and Holmlid2012a; Reference Andersson and Holmlid2012c; Andersson et al., Reference Andersson, Lönn and Holmlid2011; Reference Andersson, Holmlid and Fuelling2012; Holmlid Reference Holmlid2012c; Holmlid et al., Reference Holmlid, Hora, Miley and Yang2009). Laser-induced fusion in D(-1) using nanosecond-pulsed lasers (Badiei et al., Reference Badiei, Andersson and Holmlid2010a; Andersson & Holmlid, Reference Andersson and Holmlid2012b; Holmlid, Reference Holmlid2012a; Reference Holmlid2013a) and picosecond-pulsed lasers (Olofson et al., Reference Olofson, Ehn, Bood and Holmlid2012) was reported previously. It was also recently reported (Holmlid, Reference Holmlid2013a; Reference Holmlid2013b) that break-even was reached in fusion in D(-1) with 0.2 J laser pulses. Fusion is probably not initiated by a high temperature in this fuel, since high temperature will just destroy the structure and increase the D-D distance in D(-1). Instead, D(-1) is transferred by the laser pulse from the normal level s = 2 to the level s = 1 with a D-D distance of only 0.56 pm (Holmlid, Reference Holmlid2013d). From there, fusion follows rapidly. Thus, it is important to understand the internal function in the D(-1) material and look for special signatures in experiments using this material (Holmlid Reference Holmlid2013a; Reference Holmlid2013b; Olofson et al., Reference Olofson, Ehn, Bood and Holmlid2012). Here, we report production of lepton (electron-positron) pairs by the 1–20 MeV u−1 H(-1) fragments.
D(-1) is a quantum material which is superfluid at room temperature (Andersson & Holmlid, Reference Andersson and Holmlid2011). It also shows a Meissner effect at room temperature (Andersson et al., Reference Andersson, Holmlid and Fuelling2012), which indicates that it is superconductive. It may involve formation of vortices in a Cooper pair electron fluid as discussed by Winterberg (Reference Winterberg2010a; Reference Winterberg2010b). It forms a thin superfluid film on metal surfaces but not on polymer surfaces (Olofson & Holmlid, Reference Olofson and Holmlid2012b). The bond distance in D(-1) is normally 2.3 ± 0.1 pm (Badiei et al., Reference Badiei, Andersson and Holmlid2010b). This material consists of chain-like clusters D2N with N integer. The D-D pairs rotate around a vortex in the cluster (Andersson & Holmlid, Reference Andersson and Holmlid2012a). The massive MeV particles ejected by laser-induced processes in D(-1) have been studied by time-of-flight (TOF) (Holmlid; Reference Holmlid2013a; Reference Holmlid2013b; Reference Holmlid2013e). They are neutral cluster fragments, mainly with energies in the range 1–30 MeV u−1. Their intensity is so large that the charge ejected from the collectors can be measured directly as a mA current on an oscilloscope. The total energy of these clusters can be calculated from their absolutely measured TOF distributions. This gives the energy gain in the process, which seems to range up to several hundreds (Holmlid, Reference Holmlid2013b). The present study investigates the properties of the ejected particles and the processes they initiate at surfaces in the experimental setup. Three collectors in-line are used simultaneously for this at distances up to 1 m from the laser target. This is a useful type of setup since the particles penetrate through the metal collectors with some scattering loss, giving discrimination between particles with different kinetic energies. This investigation is part of a program to understand the fusion processes in the ultra-dense deuterium D(-1) fuel. This is done by defining and developing suitable experiments to prove different partial processes and particles ejected in the processes. Due to the complexity of the processes and particles observed, a battery of methods is not a useful approach as known from many scientific fields. Conversely, the step-wise approach has proved its value in our studies, for example in the detection and investigation of the unexpected neutral particles with energy of 1–20 MeV u−1.
Nuclear fusion processes are easier to initiate in ultra-dense hydrogen than in ordinary hydrogen ice used in most laser-induced fusion studies so far (Hurricane et al., Reference Hurricane, Callahan, Casey, Celliers, Cerjan, Dewald, Dittrich, Döppner, Hinkel, Hopkins, Kline, Le Pape, Ma, MacPhee, Milovich, Pak, Park, Patel, Remington, Salmonson, Springer and Tommasini2014; Holmlid, Reference Holmlid2014). A method to form very dense interstitial regions of hydrogen in a hydrogen-dissociating Pd metal layer has been demonstrated by Lipson et al. (Reference Lipson, Heuser, Castano, Miley, Lyakhov and Mitin2005). They observed anomalies in conductivity and magnetic susceptibility below 70 K, which were attributed to ultra-dense hydrogen filamentary superconductivity. The relation to ultra-dense hydrogen and the use of this material as a fusion target were further discussed in Holmlid et al. (Reference Holmlid, Hora, Miley and Yang2009) and Miley et al. (Reference Miley, Yang, Hora, Flippo, Gaillard, Offermann and Cort Gautier2010). Ultra-dense hydrogen (deuterium) was also discussed in Yang et al. (Reference Yang, Miley, Flippo and Hora2011) as a means of producing a MeV flux of ions for ion-beam induced inertial confinement (ICF) fusion.
2. THEORY
Ultra-dense materials do not exist for all atoms. Due to the bond distances on the order of a few pm or less in ultra-dense materials, hydrogen is the only atom to form such materials since inner electrons in all other atoms prevent the creation of the ultra-dense structure. Ultra-dense hydrogen in the form of ultra-dense protium p(-1) has been studied by laser-induced TOF in Olofson and Holmlid (Reference Olofson and Holmlid2012a) and Holmlid (Reference Holmlid2013c). It is similar but not identical to the ultra-dense deuterium D(-1), which is used in the present experiments and which has been studied in detail previously. The D-D bond distance in D(-1) is normally 2.3 ± 0.1 pm (Badiei et al., Reference Badiei, Andersson and Holmlid2010b). The most precise bond distance measurement in small clusters D4 under low laser excitation (Holmlid, Reference Holmlid2011) gave 2.15 ± 0.02 pm. This type of cluster is not a chain cluster D2N as most clusters of D(-1) are, and may thus be slightly more contracted. Other excitation levels of D(-1) exist, for example, with D-D distances 0.56 pm for electron spin quantum number s = 1 (Holmlid, Reference Holmlid2013d). It is likely that this level gives spontaneous fusion processes, due to the very short D-D distance. Experiments show that D(-1) is a superfluid, for example, observed through a “fountain” effect (Andersson & Holmlid, Reference Andersson and Holmlid2011). This means that D(-1) is quite sensitive to energy input like laser light and can be converted to similar states, either with shorter D-D distances at s = 1 or larger distances (Holmlid, Reference Holmlid2012b). The energy transport in D(-1) is fast and may give energy pooling to small cluster fragments. This gives ejection of keV (Andersson & Holmlid, Reference Andersson and Holmlid2010) and MeV (Holmlid, Reference Holmlid2012a; Reference Holmlid2013a) fragments. It is also shown that nuclear fusion exists in D(-1) under laser impact (Badiei et al., Reference Badiei, Andersson and Holmlid2010a; Andersson & Holmlid, Reference Andersson and Holmlid2012b; Holmlid, Reference Holmlid2012a; Reference Holmlid2013a). The energy range for the ejected particles is 1–30 MeV u−1 (Holmlid, Reference Holmlid2013b; Reference Holmlid2013e). The formation of MeV particles indicates nuclear fusion, either as the source of the particles or as a result of the MeV particles. It is even shown in Holmlid (Reference Holmlid2013b) that the laser-induced process gives an energy gain, since the summed energy of the MeV particles is much larger than the laser pulse-energy. If the lowest level of D(-1) with s = 1 gives spontaneous fusion, the laser energy may transfer D(-1) from its most common form s = 2 with 2.3 pm D-D distance to this s = 1 level, where fusion takes place with a large probability. This means that the laser pulse does not need to create a very high temperature in D(-1), but only needs to transfer a large enough number of the deuterons to the s = 1 state of D(-1). The MeV particles observed are thus likely a result of D + D fusion. The laser-induced plasma is concluded to have a temperature of > 50 MK (Andersson & Holmlid, Reference Andersson and Holmlid2012b).
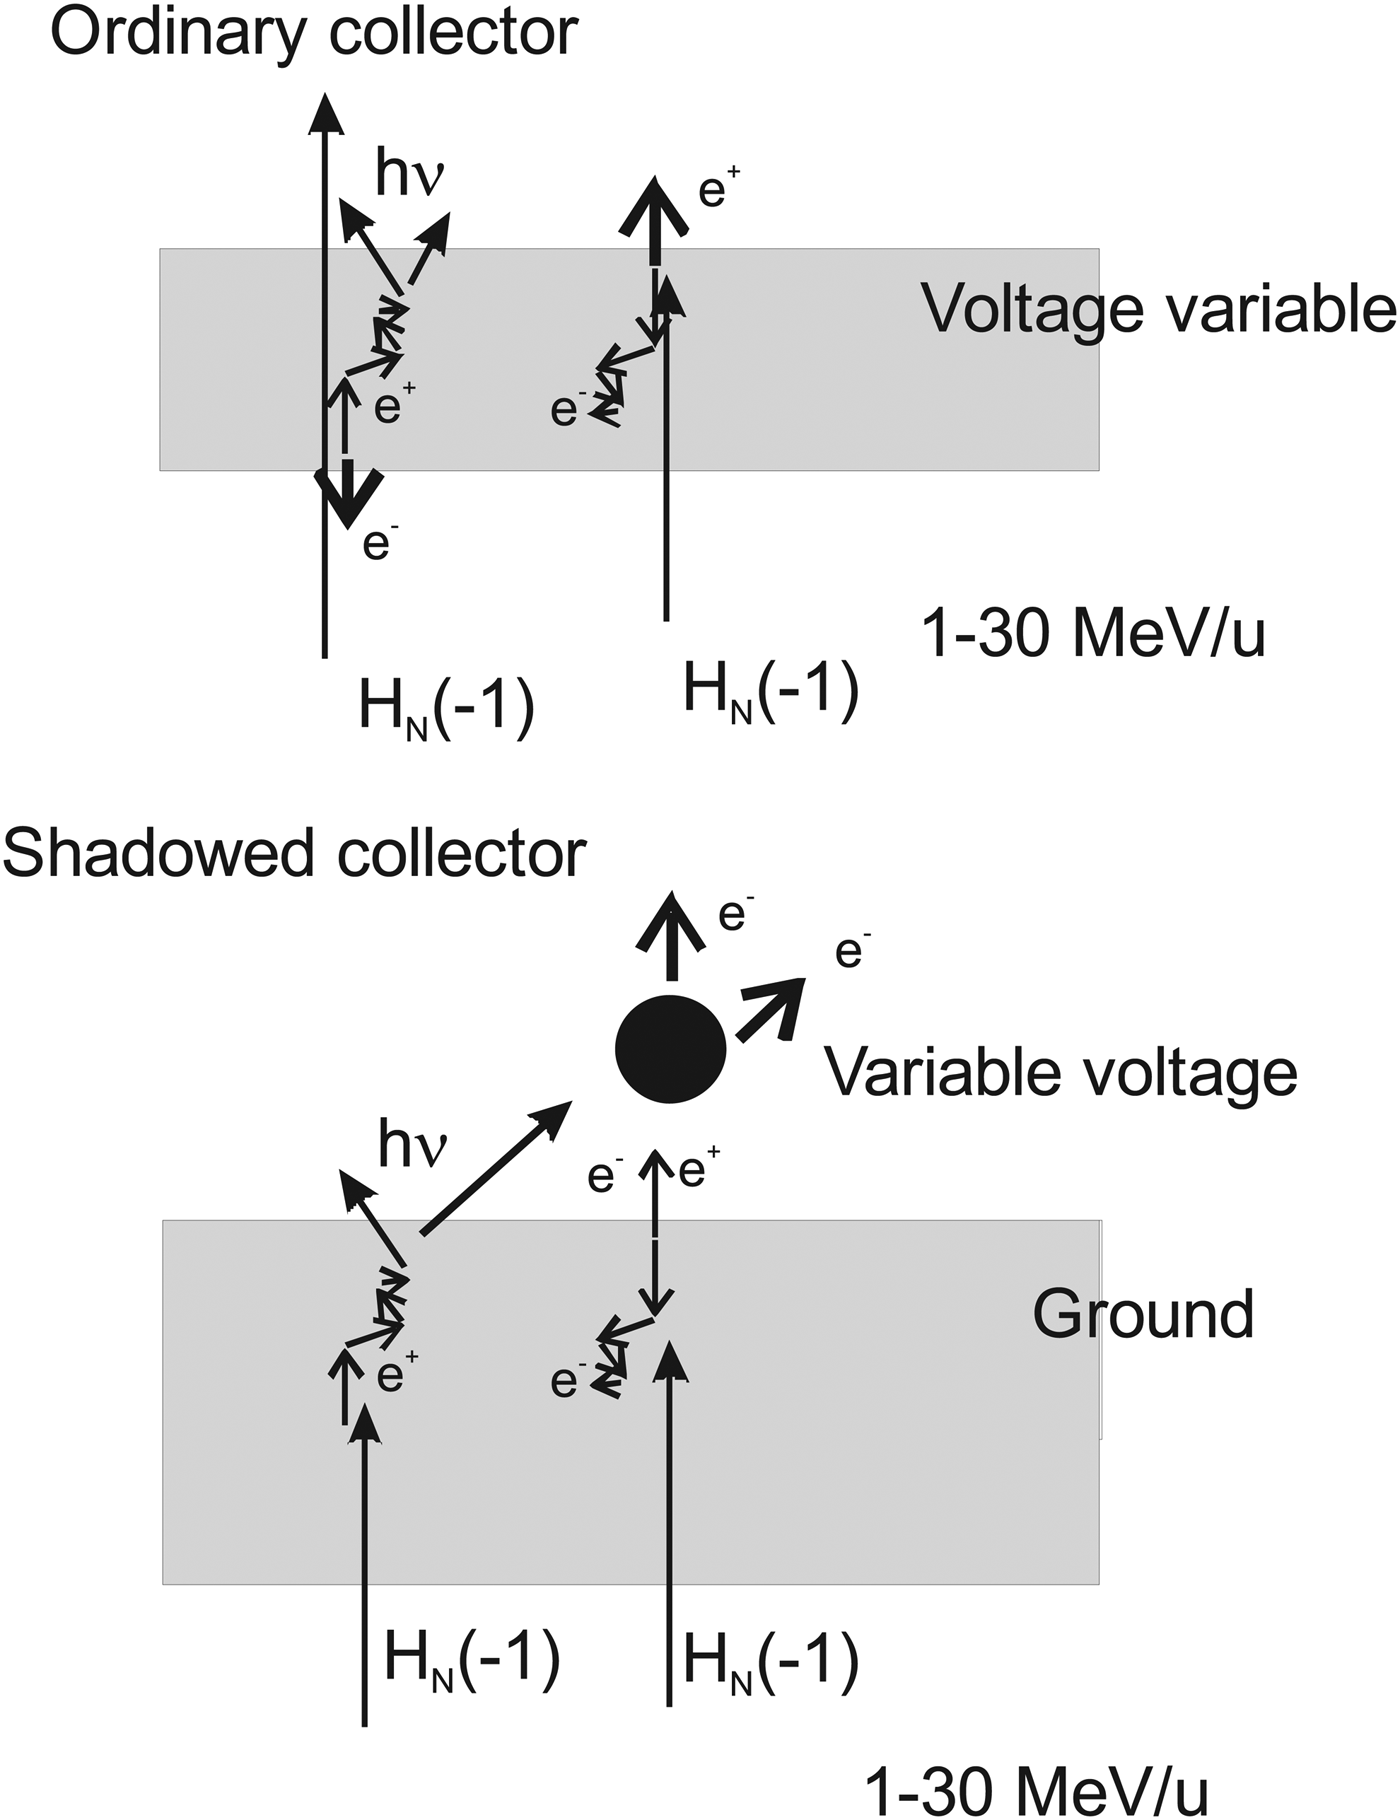
Pair production is the process where an energetic photon or other boson may form particles, like an electron-positron pair (lepton pair), in collision with a nucleus (L'Annunziata, Reference L'Annunziata2007). This process here produces an easily measurable result in the metallic collectors. The minimum energy required to form two such particles is 1.02 MeV since the mass of each electron or positron is 0.511 MeV. The neutral H(-1) particles studied previously (Holmlid, Reference Holmlid2013a; Reference Holmlid2013b; Reference Holmlid2013e) have kinetic energy up to 30 MeV u−1, which means that the energy required is easily available. Particles HN(-1) composed of protons and electrons are bosons, as are also the deuterons probably also existing in the H(-1) material ejected from the laser-induced processes on the target. The H(-1) particles are observed to penetrate through metal plates in the present experiments. Due to the finite distance of motion of electrons and also of positrons in the metal collectors caused by inelastic collisions, there exists an escape depth (NIST database) of the electrons and positrons from the metal. This means that the penetrating H(-1) particles create charges that can escape from the collectors only close to the front and the back surfaces. This situation is shown in the upper sketch in Figure 1. The escape depth effect means that the thickness of the collector does not directly influence the signals obtained. Further, the energy of the escaping particles will on average be relatively small, if the thickness of the collectors is large enough to slow down the electrons and positrons formed inside the collector plate. A positron formed in pair production will annihilate with an electron, normally after losing most of its kinetic energy by collisions with electrons for example in a metal part (L'Annunziata, Reference L'Annunziata2007). This can take place either in the collector material or, after escape from the collector, at other surfaces in the chamber. The annihilation process normally gives two gamma photons each with energy 0.511 MeV (L'Annunziata, Reference L'Annunziata2007), thus further pair production by these photons is not possible.
Interaction of H(-1) particles with a relatively thin metal collector gives pair production, with a polarity of the signal varying with the applied bias (top sketch). At the bottom, the process with a thicker metal plate and a “shadowed” collector is depicted. In this case few H(-1) particles penetrate through the plate, giving mainly electrons to and from the collector. The signal fluxes are shown by thick arrows.

In the experiments, both two- and three-collector arrangements are used, with the function of the collectors depicted in the upper sketch of Figure 1. Also the other arrangement used for complementary information, with so-called “shadowed” collector is sketched in Figure 1, lower part. When most H(-1) particles are stopped by a denser metal plate, only the fastest ones penetrate and give a signal at a collector behind the grounded dense plate. The probability that positrons are ejected is thus smaller, since they will annihilate inside the metal. Mainly photons and electrons will be able to reach the shadowed collector, giving photoelectrons and secondary electrons at the collector surface. The actual signal observed will of course vary with the sign of the voltage on the shadowed collector.
Pair production does not seem to have been studied during laser-induced fusion conditions previously. Gamma photons from laser-induced fusion processes have been studied by Lerche et al. (Reference Lerche, Cable and Dendooven1996) and Mack et al. (Reference Mack, Berggren, Caldwell, Christensen, Evans, Faulkner, Griffith, Hale, King, Lash, Lerche, Oertel, Pacheco and Young2006) aiming at diagnostic measurements in the National Ignition Facility. They were mainly using Cherenkov detectors for the small number of 16.7 MeV gammas from D + T fusion and do not mention pair production. On the other hand, high-energy laser-induced plasma studies giving pair production and other nuclear processes (Cowan et al., Reference Cowan, Perry, Key, Ditmire, Hatchett, Henry, Moody, Moran, Pennington, Phillips, Sangster, Sefcik, Singh, Snavely, Stoyer, Wilks, Young, Takahashi, Dong, Fountain, Parnell, Johnson, Hunt and Kühl1999) have been reported by a few groups. They have often aimed at forming large densities of positrons (Chen et al., Reference Chen, Wilks, Bonlie, Liang, Myatt, Price, Meyerhofer and Beiersdorfer2009) or dense pair-plasmas (Myatt et al., Reference Myatt, Delettrez, Maximov, Meyerhofer, Short, Stoeckl and Storm2009) with no direct relation to laser-induced fusion. Theoretical descriptions of laser-generated pair formation have been given notably by Hora et al. (Reference Hora, Osman, Castillo, Collins, Stait-Gardener, Chan, Hölss, Scheid, Wang and Ho2002; Reference Hora, Castillo, Stait-Gardner, Hoffmann, Miley and Lalousis2011), also mentioning the relation to laser-induced fusion of the fast ignitor type.
3. EXPERIMENTAL
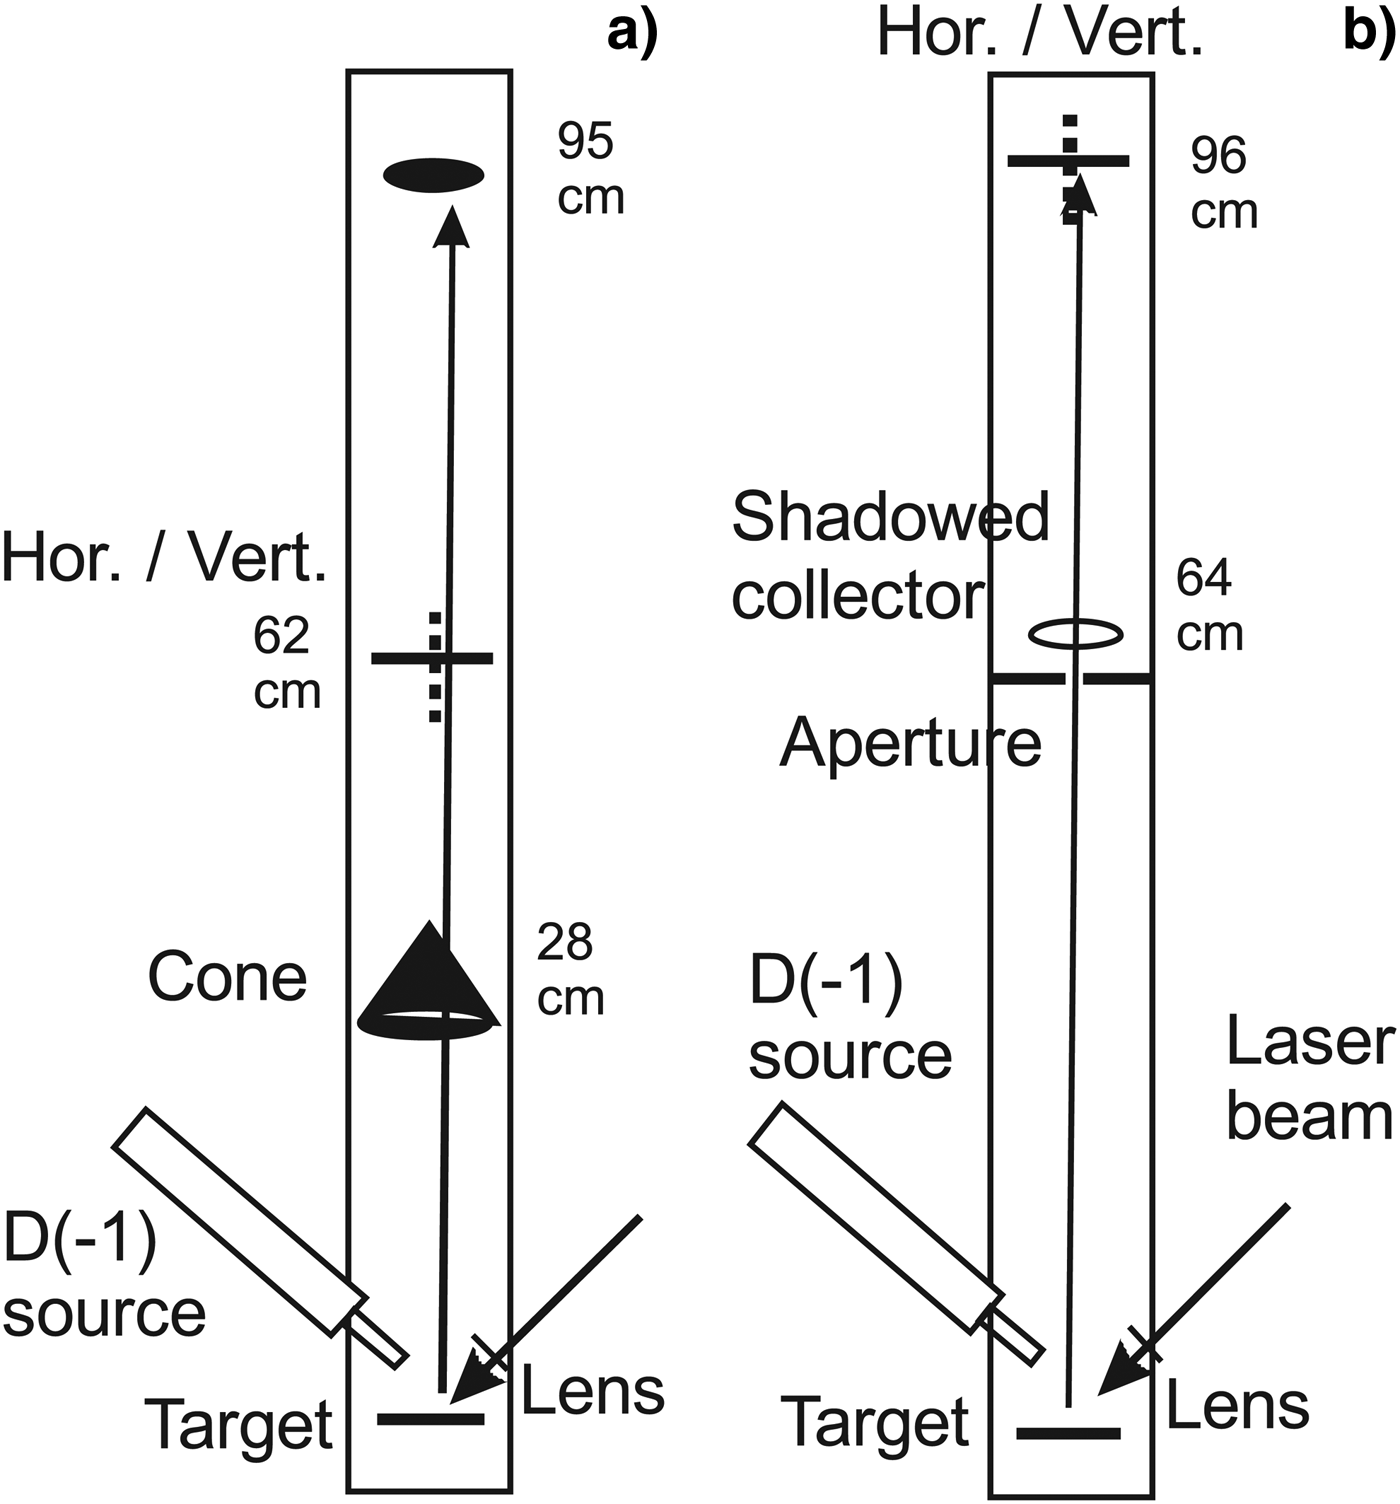
The two main layouts of the experiments are shown in Figure 2. A Nd:YAG laser with pulse energy of < 120 mJ was used with the cone setup shown in Figure 2a, with 5 ns pulses at 532 nm and normally 10 Hz repetition rate. In the shadowed collector experiments (Fig. 2b), < 400 mJ pulses at 1064 nm were used. The laser beam was focused with an f = 50 mm lens on the D(-1) surface layer on a target in a small vacuum chamber. This means a laser intensity of < 2 × 10¹⁴ (at 532 nm) or < 4 × 10¹³ (at 1064 nm) Wcm−2 for a Gaussian beam. The lens can be moved from the outside around the center of the target. In this way, different parts on the target can be sampled with the laser beam. In the present experiments, a piece of iridium metal in cylinder form (3.5 mm diameter) was normally in the laser focus. The source for producing D(-1) is similar to a published construction (Andersson et al., Reference Andersson, Lönn and Holmlid2011) modified for higher pressure operation. In the source, a potassium doped iron oxide catalyst sample (Meima & Menon, Reference Meima and Menon2011; Muhler et al., Reference Muhler, Schlögl and Ertl1992) forms D(-1) from deuterium gas (99.8% pure). The D(-1) formed falls down to the horizontal target plate below the source and is partially adsorbed on the iridium surface. The D2 gas pressure in the chamber is 0.1–1 mbar with constant pumping.
Principle of the apparatus used for the experiments with pair production (a). To the right, the apparatus with the “shadowed” collector is sketched (b). Vertical cuts. A similar source for ultra-dense deuterium D(-1) is described in Andersson et al. (Reference Andersson, Lönn and Holmlid2011).
The main information about the laser-induced processes is obtained from collectors located in the direction normal to the target plate, at varying distances from the target as shown in Figure 2. The cone collector at 28 cm is made from 0.5 mm thick copper plate, at an angle giving a distance close to 1 mm for penetration through the material in the main direction of the chamber. The (inverted) cone form prevents scattering of particles and photons around its edge. The cone covers 6.4 × 10⁻² sr above the target. A 1.5 mm thick aluminum plate collector can be rotated to expose just its edge to the particle flux (vertical orientation). It is called the middle collector in setup (Fig. 2a) and is used at a distance of 64 cm. It covers 1.2 × 10⁻² sr above the target. When rotated to the vertical orientation, it allows passage of particles to a third collector made from aluminum foil, called the upper collector. This collector covers 2 × 10⁻³ sr above the target. The rotatable collector is moved to the distance 96 cm in the setup in Figure 2b and is then named upper collector. The so-called shadowed collector is a wire ring above a 1 cm aperture in a stainless steel plate of 1.5 mm thickness, which is mounted light-tight against the wall of the chamber. It is at a distance of 64 cm from the target. The collectors are connected directly to an oscilloscope via a short 50 Ω coaxial cable. The oscilloscope used is a fast digital two-channel oscilloscope (Tektronix TDS 3032, 300 MHz). The impedance of the oscilloscope input is 50 Ω. A 50 Ω RF attenuator is used with large signals to give a factor of three (−10 dB) lower signal at the oscilloscope. This introduces a signal delay of 7 ns but no change in the curve form. A shielded 50 V battery can be inserted into the signal path at the feed-through in the vacuum wall to give positive or negative voltages on the collector, still giving a 50 Ω connection to the oscilloscope. It may introduce a small delay of the signal (see below). In another signal extraction construction, a variable voltage up to ± 500 V can be fed to the collector, with the signal taken to the oscilloscope through a 1 nF high-voltage capacitor and a 50 Ω cable. The plasma current and the power required become often too large at high voltages for this last method to be useful. This bias method may give a small delay of the signal.
4. RESULTS
With the cone setup shown in Figure 2a, various properties of the particle emission from the plasma can be studied. The particles are penetrating and a large fraction of them can move through the two first collectors to the final one, called the upper collector, at almost 1 m distance from the laser target. Starting at the cone-shaped collector closest to the target, the signal is shown in Figure 3. The signal is positive with negative bias, and conversely. The time variation is similar with positive and negative bias up to 150 ns, after which electrons from the chamber walls and the target reach the cone collector, as can be observed at positive bias. Adding the two biased signals gives the form in Figure 3b. This shows the constant flux of electrons from the chamber structure at times up to 1.8 µs, and the initial photoelectron current from the cone given by photons from the target. The similarity of the positive and negative signals as shown in Figure 3a is interpreted as pair production. The peak signal corresponds to 0.4 A or a charge in the pulse of approximately 4 × 10⁻⁸ As, thus 2.5 × 10¹¹ charges. This gives a total particle intensity of 4 × 10¹² sr−1 in the forward direction. A thermal particle distribution at 400 keV u−1 or 4 × 10⁹ K is included in Figure 4, matching the rise of the signal quite well. However, the remaining signal is not thermal in shape but rather indicates a process that emits fast particles during 150 ns. The signal with zero bias is much smaller than the other signals. This indicates symmetry in the generation of positive and negative charges at the cone collector as in a pair production process. A more arbitrary process for creating secondary charges would likely give a higher signal for the easily released electrons and thus a higher signal with negative collector bias.
Signals at the cone collector with various biases. In panel (b), the signals for +50 and −50 V bias are added, removing the pair production signal. The fraction of the full sphere covered by the collector is 5 × 10⁻³. The long dash curve is a thermal particle distribution.
Signals at the middle collector at 62 cm with various biases. Experiments both with and without the cone collector are shown. Hor. means horizontal orientation, Vert. vertical orientation of the middle collector shown in Figure 2a. The fraction of the full sphere covered by the collector is 1 × 10⁻³. The long dash curve is a thermal particle distribution.
In Figure 4, two different conditions for the signal measured at the middle collector are shown. The upper panel is found for a case with the cone collector, while the lower panel is for a case with the cone collector removed. The signal with no cone is approximately a factor of two larger than the one with cone. Thus, the cone removes 50% of the particles giving the signal at the middle collector. Otherwise, the two cases are quite similar, which shows that the signal generation process is not strongly influenced by the obstructing cone. In the case with no cone, the negative signal from the chamber structure is more extended in time, as expected when electrons from the target can move directly to the collector. One interesting fact is that the signal is only weakly influenced when the middle collector (where the signal is measured) is rotated from horizontal (thus exposing a large area for the flux from the target) to vertical, only exposing a thin edge (and the turning axis) for this flux. This shows that the signal is not due to a surface effect (like photo emission), but to a volume effect with low probability from the interaction between the collector and the penetrating particle flux. Note that this conclusion is in agreement with the escape depth effect described in the theoretical section. This independence of the collector rotation is true for both negative and positive bias, which makes it unlikely that the signal is due to electrons from the chamber walls. It should be observed that the signal with zero bias is small relative to that found with a positive or negative bias. Thus, the bias separates the charges from a process forming both positive and negative charges which means pair production. With no bias, the total charge leaving and staying in the collector is balanced to almost net zero contribution. This is simplified if positive and negative particles have similar masses and energies as in pair production. The total charge to the middle collector in Figure 4 is close to 5 × 10⁻⁹ As. This means a total number of charges of 3 × 10¹⁰ to this collector or 2.6 × 10¹² sr−1 in the forward direction. This is approximately 65% of the intensity per steradian at the cone, which is reasonable. A thermal particle distribution at 2 MeV u−1 or 2 × 10¹⁰ K is included in Figure 4, matching the rise and peak of the signal quite well. The tail of the thermal distribution is not observed in the experiments, possibly due to the braking of the slow particles and time-broadening of the signal for example in the cone or the plasma.
The signal to the upper collector with no cone collector is displayed in Figure 5. The influence of the orientation of the middle collector is shown, indicating that this collector transmits approximately 50% of the particle flux to the upper collector. By adding the signals for the positive and negative biases of the upper collector, the signals in the lower panel are obtained. They indicate that there exists a difference signal at short time which is unchanged by the blocking collector orientation, similar to that observed in Figure 3b. This remaining signal (with the contribution from pair production removed by the addition) may be due to penetrating X-ray photons giving mainly photoemission at the collector, while the slower-varying signal at longer times is due to photoelectrons from the structure in the chamber. These slower electrons are partially blocked by the rotatable collector. The same type of signals to the upper collector but with the cone collector in place is shown in Figure 6. This means that the particles observed there have passed through both the cone collector and the middle collector. The signal there is a factor of approximately four lower than in Figure 5, which agrees well with the other results. The total charge to the upper collector in Figure 6 with the cone in place is around 1.1 × 10⁻⁹ As or a total number of 7 × 10⁹ charges with the middle collector vertical, i.e., transmitting. This corresponds to 3.4 × 10¹² sr−1 in the forward direction, slightly larger than the intensity at the middle collector. This higher intensity is found when the middle collector is vertical, and probably means that the upper collector (close to the top of the apparatus) is a dump for all the remaining intensity in the beam: in the case of horizontal middle collector, the data in Figure 6 give a factor of four lower total signal or a factor of two lower intensity relative to the middle collector. This is as expected. The addition of the curves in the lower panel in Figure 6, which cancels the signal due to pair production, indicates a lower relative signal due to photoemission with the middle collector horizontal (closed) compared to Figure 5. It is notable that the second bump at 60 ns in Figure 5 (lower panel) has been removed in Figure 6 by the thicker total metal to penetrate. This bump is proposed to be caused by X-ray photons. A thermal particle distribution at 4.5 MeV u−1 thus at 5 × 10¹⁰ K is included in Figure 6, matching the rise and peak of the signal quite well. The tail of the theoretical TOF distribution is not observed with bias −50 V. This may be due to lower penetration of the slower particles in the tail.
Signals at the upper collector, with no cone collector. Hor. means horizontal orientation, Vert. vertical orientation as in Figure 2a. The fraction of the full sphere covered by the collector is 1.7 × 10⁻⁴. In the lower panel, the signals are added pairwise to cancel the pair production signal.
Signals at the upper collector, with cone collector in place. Hor. means horizontal orientation, Vert. vertical orientation of the middle collector as shown in Figure 2a. The fraction covered by the collector is 1.7 × 10⁻⁴. In the lower panel, the signals are added pairwise to cancel the pair production signal. The long dash curve is a thermal particle distribution.
The timing of the signals needs also to be analyzed here. In Figure 7, the signals to the three collectors in-line are shown in a logarithmic plot to simplify the comparison of the first signal rise. While the upper collector signal rise is a few nanosecond later than the signal rise from the cone collector, the middle collector is simultaneous with or faster than the signal rise at the cone collector. The slow response of the cone collector may be due to its shape, preventing a larger number of the formed pairs to directly leave the collector, or be due to its larger capacitance toward the structure of the apparatus compared to the other collectors. The signal delay for the photons giving the first photoelectronic part of the signal is only 2 ns from the cone to the upper collector, thus within trigger error limits. The signal delay from the trigger diode at the chamber is 14 ns. This is composed mainly of the delay in the attenuator (7 ns) and a 2–3 ns delay due to battery bias (see below). The cabling to the oscilloscope has the same length for the trigger and for the signal. The time for the first photons or particles from the target to the collector is 2–4 ns, all adding up to 11–13 ns. This accounts for the observed signal delay on the oscilloscope relative to the trigger signal.
Signals at the three collectors in-line at bias −50 V. See the text for the initial timing of 14 ns from the trigger.
A few further factors influence the timing of the signals, with examples shown in Figures 8 and 9. In these experiments, the trigger diode does not observe the laser pulse, but triggers on the electromagnetic pulse from the charges ejected from the target. This trigger is slightly later than that with the visible laser pulse used for the other measurements, and the laser pulse impact is in fact 3 ns earlier than the trigger pulse shown in Figures 8 and 9 due to the location of the trigger diode along the beam path above the target. In Figure 8, it is shown that the addition of the biasing battery gives a delay of 2–3 ns of the signal to the oscilloscope. It is also shown that the penetration of the particles through the aluminum foil in the middle collector takes time, apparently at 1–2 ns. This indicates that the particles are massive and not photons. This effect may be even better observed in Figure 9. The results in Figure 9 further show that the signal with bias +50 V is 1–2 ns slower than with bias −50 V. This is probable since the first signal with −50 V bias is due to photoelectrons and not to pair production. These results are general even if only a few examples are shown in Figures 8 and 9.
Trigger and first signal rise with the trigger diode reacting on the electromagnetic pulse outside the chamber. Mcoll means middle collector open/closed as shown in Figure 2a. To the left, no bias, and to the right, -50 V bias at the upper collector.
To test if the pair production process is reasonable with high energy charges created with both signs, experiments have also been done at larger bias voltages. Results are shown in Figures 10 and 11, with one example in Figure 10 for the signal at the upper collector (at negative bias) and one example in Figure 11 for the signal at the middle collector (with positive bias). No plateau is reached in the signal variation with bias voltage, which means that the energy of most of the emitted charges is larger than 500 eV. Photoelectrons would normally have low energy, which means that a small applied positive bias voltage would retain most photoelectrons at the collector. This is not observed. Thus, the charged particles observed from the collectors have higher initial energy, as expected for pair production even after penetration out from the bulk metal.
Variation of signals at the upper collector with large negative bias, no cone collector, middle collector horizontal. No limiting was observed.
Variation of signals at the middle collector with large positive bias, no cone collector, middle collector horizontal. No limiting was observed.
The second setup used with the shadowed collector (Fig. 2b) observes the particles after penetration through a thicker metal plate, a short distance in front of the wire-loop collector. The results in Figure 12 show that this collector signal has even less tailing than in Figure 6, probably since the slower particles in the tail do not penetrate through the metal. (The signals with zero bias also shown are mainly due to photoelectrons and are similar in apparent energy for the shadowed collector and the upper collector.) This conclusion is clear by the comparison with the signal at the upper collector, in this experiment due to particles moving directly from the target with no penetration through metal parts. This means that the TOF distributions observed at the upper collector are thermal or even broader, comparable to some of the distributions in Figures 4–6. Such distributions indicate thermalized massive particles. The signal to the shadowed collector with +50 V and −50 V bias is shown in Figure 13, plotted as in Figures 3–6. This is an example which is different from the general behavior in Figures 3–6, since the two signals are different in shape and not only different in sign. However, adding the two signals as in the bottom panel in Figure 13 gives a similar behavior to that in Figure 6, with a first photoelectron peak. This means that pair production in the collector in this case is a smaller process, as expected since the pair production in this “shadowed” case will mainly take place in the thicker metal plate in front of the collector. As expected, these plots do not show a second bump as in Figure 5. This bump is caused by X-ray photons from the target, which cannot efficiently penetrate the plate in the case of Figure 13, or the cone in Figure 6.
Signals at the shadowed collector in the setup in Figure 2b, with simultaneous upper collector signal. Collector biases 0 V and −50 V are shown. The long dash curves are thermal particle distributions.
Signals at the shadowed collector in the setup in Figure 2b, with biases −50 V and +50 V. The long dash curves are thermal particle distributions. The two signals are added in the lower panel, showing photoelectron signal from the collector (positive) and from the walls (negative).
The same setup with the aperture in a steel plate division (Fig. 2b) has also been used for magnetic testing of the particle flux. A deflecting magnetic field was arranged just above the aperture in the plate by four permanent magnets, giving field strength of 0.4 T over a distance of 28 mm along the beam path. This means that even electrons with an energy as high as 10 keV (28 MeV u−1) will have a radius of motion in the field of < 1 mm. They will be strongly deflected and dispersed by the magnetic field. Protons with energy of 5 MeV will have a radius of motion of 0.8 m in the field. The total deflection at the upper collector is 1 cm for such protons, which means that they will still reach the collector. No change in the TOF signal was observed with the magnetic field, but only a signal decrease due to the slit used in front of the magnets. Thus, it is concluded that the TOF distributions observed are not caused by electrons of low energy. High-energy electrons cannot give the broad TOF distributions observed.
5. DISCUSSION
Pair production appears to be the main signal forming process in the present experiments. Another process, which could give both positive and negative currents to a collector, is gas phase ionization. The deuterium gas in the chamber has 0.1–1 mbar pressure, and the negative current could be due to electrons from the ionized gas, while the positive current could be due to the gas ions D2+. However, the much lower mobility of the ions would mean that the positive current is (much) slower than the negative current. The contrary is observed, and the positive and negative current time variations are almost identical. Further, it is not possible to collect an ion current in the A range from a stationary gas volume in a few nanoseconds at field strengths on the order of 1–2 V cm−1. In fact, the mean free path of a low-energy ion in the D2 gas is small, and fast collection of the ions is not possible at all. Typical drift velocities of hydrogen ions in hydrogen gas at 1 mbar are on the order of 10 cm s−1 (Dutton et al., Reference Dutton, Llewellyn Jones, Rees and Williams1966), giving typical times for the signal variation of milliseconds instead of nanoseconds as observed. Increasing the collection voltage as in Figures 9–10 would give slower signals collected from larger distances, not faster signals as observed. Thus, gas phase ionization is excluded, and the source of the charges is definitely the collectors themselves. Due to the symmetry of positive and negative currents with the quite high gas pressure, both types of particles must have similar mass and collision cross-section with the D2 molecules. Thus, the dominating process observed is concluded to be pair production.
The signal observed could possibly be due to four different types of particles from the laser target, namely electrons, gamma photons, protons or particles of ultra-dense hydrogen H(-1) (including both p(-1) and D(-1)). Fast electrons and gamma photons exist in the flux from the target and give typical signatures, especially in the signals observed with zero bias. However, the interest here is in the particles which penetrate the metal plates forming the collectors and give the pair production at the different collector surfaces and the broad TOF distributions. The typical distribution energy of 5–10 MeV u−1 observed in many figures here corresponds to 2.7–5.4 keV for electrons. Such electrons have a range of less than 1 µm in most materials and are not penetrating. They have too low energy to give any kind of pair production. Thus, such electrons do not give the TOF signals observed. Protons will penetrate the metal plats to some extent. A 14 MeV proton has a range of 1.3 mm in aluminum (NIST database). To penetrate the 1.5 mm thick steel plate in the shadowed collector experiments, the proton energy must be at least 30 MeV (NIST database). However, the distributions in Figures 12 and 13 have energies down to 2 MeV u−1, and the particles in the tails have much lower energy. Thus, the particles observed to penetrate the metal plates are not protons. This leaves the two real possibilities as gamma photons and H(-1) particles.
If H(-1) particles are considered to exist of loosely bound protons and electrons, as in a material composed of hydrogen atoms, they cannot penetrate through mm thick metal. However, the bonding state of H(-1) is very different from this (Holmlid Reference Holmlid2013d), and the dimensions of the particles (clusters) is around a few pm, probably small enough to pass through a normal material. The small size of the particles means that they will behave as neutral down to an interaction distance of the same size as the electron-nucleus distance of 0.5–2 pm (Holmlid, Reference Holmlid2013c; Reference Holmlid2013d). Thus, such particles may penetrate through metal plates more easily than protons. They may however interact and scatter or decompose to a certain extent during the passage through the metal plates. The results in Figures 8 and 9 where the signal is delayed when the middle collector is in the particle flux indicate H(-1) particles. This type of partial penetration and delay in the metal plates indicates H(-1) particles instead of gamma photons.
The broad TOF distributions in Figures 3, 4, and 6 show an interesting trend, from 0.4 MeV u−1 at the cone collector to 2 MeV u−1 at the middle collector and finally 4.5 MeV u−1 at the upper collector. These changes are probably due to a loss of the particles coming late in the distributions, even if the signal in some cases appears to be too early at longer distances from the target. Further evidence exists in Figure 6, where the signal at upper collector is measured with the cone in place. When the middle collector is in the horizontal orientation, thus blocking the signal, the signal is decreased strongly and is faster than with the middle collector open. This means that many slow particles are prevented from reaching the final upper collector. This type of change in the distributions does not agree with gamma photons. If the distributions were gamma photons they would then be due to a 200 ns period of photon emission, and the loss in the collectors would be due to absorption in the plate used. A half-thickness on the order of 0.4 g cm−2 (for 1.5 mm aluminum plate) indicates (NIST database) photons with energy of 25 keV. The first part of the distributions would contain photons with > 25 keV, while the later part would contain photons with < 25 keV energy. However, no delays would be possible of the type seen in Figures 8 and 9. Further, such photons have much too low energy to give pair production. Only electrons could be produced, and the general distributions in Figures 3–6 and 10–13 would be unexplained. Thus, also gamma photons are excluded due to their too low energy, similar to the case of electrons as the possible detected particles.
One further possibility to consider seriously is that the H(-1) particles that penetrate a plate do not give any pair production there, since they do not collide strongly with any nuclei in the metal. This could mean that the fastest particles only give pair production at the upper collector, while the slow particles will give pair production already in the cone collector. This would explain the different temperatures found by the different collectors in a nice and consistent way.
Thus, it is concluded that it is only the case of H(-1) particles that may explain the results. Of course, their properties are not so well known as for the other particles discussed here. The penetration of MeV u−1 particles through metal foils has however been studied with a different type of detection method in another setup where such massive particles are formed in large quantities and delayed in metal foils (Andersson & Holmlid, Reference Andersson and Holmlid2012b; Holmlid, Reference Holmlid2012a). From other experiments (Holmlid Reference Holmlid2013b; Reference Holmlid2013e) it is clear that the size of the HN(-1) particles, thus the N value, will determine if they penetrate easily or not. Particles with large N are unlikely to pass through the plates used in the present experiments, and the probable size here is assumed to be H1(-1)–H6(-1). Such particles are found in many experiments (Andersson & Holmlid, Reference Andersson and Holmlid2012a; Holmlid Reference Holmlid2011). Some forms are symmetric and do not have any vortex or axis.
In the figures, several different temperatures are found to characterize the TOF distributions. Since the total energy release to the particles is large in the MeV u−1 range, fusion processes are most likely as the origin of the energy. In experiments in another setup, temperatures up to 20 MeV u−1 have been found for the particles of H(-1) (Holmlid, Reference Holmlid2013b; Reference Holmlid2013e). In principle, the energy given to protons by the fusion reaction steps is between 2 and 14 MeV. The ejection process from the target is however a layer acceleration or shock wave formation (Holmlid, Reference Holmlid2013e), giving similar energy to a large number of particles. The thermal distributions are due to the subsequent interaction between the particles thrown off the target. Assuming the total fusion process to be the conventional 3D → 4He + p + n, this means a total energy release of 21.6 MeV. However, the 4He nuclei will probably not interact strongly with the H(-1) phase which is blown off, and they will probably carry only the 3.5–3.6 MeV given to them by the fusion process. Thus, the two light masses p and n may receive a total energy of approximately 14 + 3 MeV at average energy 8.5 MeV u−1. This is close to the maximum observed temperature of the distributions at 9–11 MeV u−1. If the total energy of 21.6 MeV instead is released in a complex of six nucleons (3D) with one of them carrying away the excess energy from the complex, its energy will be 18 MeV. This may explain the somewhat higher energy of 11 MeV u−1 in Figure 12. The lower energy distributions may be formed by gas collisions or plasma collisions during the expansion of the sheath of material or during the transport to the collectors. For example, the higher energy results in Figure 12 are found at 0.1 mbar pressure, while the data in Figures 3–6 were taken at 1 mbar pressure, presumably giving a stronger collision with the gas during the transport through the apparatus. With the cone collector in place, the particles will also collide with this structure, giving reflections and broad TOF distributions as seen in Figure 3. The large degree of penetration through the cone however means that results consistent with the other collector signals can be found.
6. Conclusions
The signal to three collectors in-line from laser-induced processes in ultra-dense deuterium D(-1) on an iridium surface is studied at 0.1–1 mbar D2 gas pressure, up to distances of 1 m. Pair production is observed as symmetric positive-negative time variation of the signals at the three collectors simultaneously. The broad initial TOF distribution observed at the first collector is distorted by transmission through the mm thick metal collectors and decreased in size by a factor of two at the second collector. The next step is similar, leaving a particle distribution at higher energy in each attenuation step. The particle penetration through the collectors also gives delays of the signal. It is concluded that only small particles H(-1) composed of a few atoms in the ultra-dense form can explain the experimental results.
ACKNOWLEDGMENT
The construction of the apparatus used here was supported by GU Holding, The Holding Company at University of Gothenburg.