Introduction
The existence of life beyond Earth is a fascinating question that remains unanswered. The answer to this question strongly depends on our ability to detect biosignatures indicative of life, particularly under the extreme conditions of pressure, temperature and radiation to which the solar system bodies are exposed, see, e.g. Röling et al. (Reference Röling, Aerts, Patty, Ten Kate, Ehrenfreund and Direito2015). Specifically, the search for extraterrestrial life on Mars occurs mainly due to its early geological history shared with our planet (Vago et al., Reference Vago, Westall, Coates, Jaumann, Korablev, Ciarletti, Mitrofanov, Josset, De Sanctis, Bibring, Rull, Goesmann, Steininger, Goetz, Brinckerhoff, Szopa, Raulin, Westall, Edwards, Whyte, Fairén, Bibring, Bridges, Hauber, Ori, Werner, Loizeau, Kuzmin, Williams, Flahaut, Forget, Vago, Rodionov, Korablev, Svedhem, Sefton-Nash, Kminek, Lorenzoni, Joudrier, Mikhailov, Zashchirinskiy, Alexashkin, Calantropio, Merlo, Poulakis, Witasse, Bayle, Bayón, Meierhenrich, Carter, García-Ruiz, Baglioni, Haldemann, Ball, Debus, Lindner, Haessig, Monteiro, Trautner, Voland, Rebeyre, Goulty, Didot, Durrant, Zekri, Koschny, Toni, Visentin, Zwick, van Winnendael, Azkarate, Carreau and The ExoMars Project Team2017). In this context, the search for evidence of past or present life on this planet has been the subject of intense research in recent decades, including several orbital and landed missions, as well as numerous laboratory-simulated experiments. In this sense, experiments addressed to detect biosignatures in Mars-like conditions are valid for shedding light on such investigations and guiding future planetary missions, e.g. ExoMars (Westall et al., Reference Westall, Foucher, Bost, Bertrand, Loizeau, Vago, Kminek, Gaboyer, Campbell, Bréhéret, Gautret and Cockell2015).
Extremophiles organisms, like some black fungi, lichens, and cyanobacteria species, are extremely resistant to very unusual physical and chemical environmental conditions. Several studies have recognized the capability of these organisms to survive Mars and space conditions (Onofri et al., Reference Onofri, Barreca, Selbmann, Isola, Rabbow, Horneck, de Vera, Hatton and Zucconi2008, Reference Onofri, D La Torre, Vera, Ott, Zucconi, Selbmann, Scalzi, Venkateswaran, Rabbow, Inigo and Horneck2012, Reference Onofri, De Vera, Zucconi, Selbmann, Scalzi, Venkateswaran, Rabbow, De La Torre and Horneck2015; Scalzi et al., Reference Scalzi, Selbmann, Zucconi, Rabbow, Horneck, Albertano and Onofri2012; Zakharova et al., Reference Zakharova, Marzban, De Vera, Lorek and Sterflinger2014). In agreement with these studies, Tan et al. (Reference Tan, Lewis and Sephton2018) suggest that lipids from microbial sources can be preserved in the Martian soil, and their occurrence, therefore, could be associated with fossil life. Although it is known that fatty acids with a relatively short chain of around 2–12 carbons may be attributed to abiotic sources (Lai et al., Reference Lai, Pearce, Pudritz and Lee2019), lipids that have relatively long unsaturated carbon chains are intrinsically related to biochemical processes. For instance, cell membranes generally have chains 12–20 carbons long (Deamer and Pashley, Reference Deamer and Pashley1989). They are exciting biomarker molecules since they have structural patterns and physical characteristics that can only result from biological processes, discarding their origin from abiotic sources (Georgiou and Deamer, Reference Georgiou and Deamer2014). Therefore, studies that addressed the detection of these molecules on Mars are of current interest.
In the current research, we report an experimental study towards detecting lipid biosignatures from an extremophile black yeast strain dispersed on a matrix composed of a mimetic of Martian soil. For these studies, we have used the analogue to global basaltic regolith on Mars, as represented by the Rocknest windblown deposit at Gale crater, namely Mars Global Simulant (MGS-1), proposed by Cannon et al. (Reference Cannon, Britt, Smith, Fritsche and Batcheldor2019). Samples containing the black yeast strain intact cells and a lipid extract derived from these cells were studied. Only the apolar portion of the lipid extract was studied to improve the identification of biosignatures from fatty acids of relatively long unsaturated carbon chains. Pure oleic and linoleic fatty acids dispersed in MGS-1 and oleic acid dispersed in a matrix of Fe2O3 were also studied. All samples were analysed using geomatrix-assisted laser desorption/ionization-mass spectrometry (GALDI-MS). Additionally, an analysis of the lipid extract by gas chromatography (GC)-MS was carried out to support our investigation.
Due to the samples' mineral nature, GALDI-MS is a useful technique in identifying low molecular weight organic compounds. To the best of our knowledge, this technique was first used to investigate microbes' interactions with heterogeneous minerals by Scott et al. (Reference Scott, Yan and Stoner2006) and was proposed to identify mineral-associated by Yan et al. (Reference Yan, Stoner, Kotler, Hinman and Scott2007). Later, the same research group reported a detailed investigation about glycine identification in natural jarosites and its implications for the search for life on Mars (Kotler et al., Reference Kotler, Hinman, Yan, Stoner and Scott2008) and how mineral thenardite improves detection and identification of glycine (Richardson et al., Reference Richardson, Hinman, McJunkin, Kotler and Scott2008) and aromatic amino acids (Richardson et al., Reference Richardson, Hinman and Scott2009) by GALDI-MS. More recently, the same approach has been applied by Li et al. (Reference Li, Danell, Brinckerhoff, Pinnick, Van Amerom, Arevalo, Getty, Mahaffy, Steininger and Goesmann2015) to investigate the detection of organics trace in Mars-simulated samples containing perchlorate. Wörmer et al. (Reference Wörmer, Elvert, Fuchser, Lipp, Buttigieg, Zabel and Hinrichs2014) reported the only previous study focused on lipid analysis using a GALDI-MS-based approach. This study shows the feasibility of detecting such molecules directly from marine sediment samples without any preparation. GALDI-MS is interesting because it does not require sample preparation. Unlike other techniques for desorption/ionization, GALDI makes use of the ability of minerals to perform desorption/ionization assistance. Thus, it is expected that the presence of Na-sulphate and other alkaline minerals on Mars, here represented by the MGS-1, and in other bodies of the Solar System, leads to the formation of cation-attached organic ions like [M + Na]+, where M is the molecular mass of analytes (Yan et al., Reference Yan, Stoner, Kotler, Hinman and Scott2007; Kotler et al., Reference Kotler, Hinman, Yan, Stoner and Scott2008; Richardson et al., Reference Richardson, Hinman and Scott2009). The occurrence of alkali metal adducts in mass spectra obtained using condensed phases ionization techniques such as matrix-assisted laser desorption/ionization (MALDI) and GALDI is well documented in the literature (Fuji, Reference Fuji2000; Ahn et al., Reference Ahn, Park, Moon, Lee and Kim2016). Therefore, it may be useful in the identification of organic matter in planetary geological investigations.
Materials and methods
Chemicals
Oleic acid (C18:1) and linoleic acid (C18:2), both of analytical grade, hexamethyldisilazane (HMDS/GC-MS grade), iron oxide (Fe2O3) and silica gel (63–200 μm) were purchased from Sigma-Aldrich (Saint Louis, MO). Acetonitrile (ACN), hexane and ethyl acetate (AcOEt), all of HPLC grade, were purchased from Panreac (Castellar del Vallès, Barcelona). The Mars Global Simulant (MGS-1) regolith was obtained from Exolith Laboratory at the University of Central Florida (Cannon et al., Reference Cannon, Britt, Smith, Fritsche and Batcheldor2019).
Fungal strain and culture conditions
The black yeast strain was surprisingly found and isolated from an old HCl aqueous solution with pH 1.5 and was later identified as Exophiala oligosperma (Santos and Rodrigues-Filho, Reference Santos and Rodrigues-Filho2019). This strain is deposited in the culture collection of Micromolecular Biochemistry of Microorganisms Laboratory (LaBioMMi) of the Department of Chemistry at the Federal University of São Carlos (Brazil) under registration code LaBioMMi-1324. The working Petri dishes were prepared using Czapek Agar medium, composed of glucose (26.7 g l−1), NaNO3 (3.0 g l−1), K2HPO4 (1.0 g l−1), MgSO4⋅7H2O (0.5 g l−1), KCl (0.5 g l−1), FeSO4 (0.01 g l−1) and Agar (30.0 g l−1). A cell suspension of E. oligosperma was prepared by collecting mycelium from the Petri dishes and then shaken it in sterile water. The suspension was inoculated in 70 ml autoclaved Czapek broth liquid in Erlenmeyer flasks and allowed to grow for 7 days on a rotary shaker at 120 rpm and 25°C.
Microbial lipid extraction process
The total lipids of E. oligosperma were obtained by washing and filtering the biomass produced following the methodology described by Modenez et al. (Reference Modenez, Sastre, Moares and Marques Netto2018). An amount of 20 g of freeze-dried yeast biomass was transferred to an Erlenmeyer flask, and the extraction process was carried out through the addition of AcOEt and shaking under an ultrasonic bath for 1 h. The extraction protocol was repeated three times. The mixture was filtered in a Buchner funnel and dried over anhydrous magnesium sulphate (MgSO4) and under vacuum to remove residual solvents. The extract was eluted with a mixture of hexane and AcOEt, 8 : 2 (v : v), in a chromatography column packed with silica to remove polar substances. The apolar compounds interact with the silica weakly than the polar ones, and then they come out of the column first. Only the portion containing apolar or much less polar molecules, such as fatty acids, was collected, having obtained 0.115 g of yellowish oil. Polar compounds, such as phospholipids, sugars from the culture medium, secondary polar metabolites and amino acids were removed with this procedure.
Derivatization and GC-MS analysis of lipid extract
The derivatization reaction was performed in an ultrasonic water bath (60–65°C) for 25 min by adding 5.0 ml of HMDS in 10 mg of the lipid extract. The reaction content was then diluted to 0.1 mg ml−1 in AcOEt. The GC-MS analyses were performed using a QP-2010-plus Shimadzu system. The GC oven was fitted with a Restek Rxi-5ms fused silica column (J&W Scientific, 10 m × 0.10 mm × 0.10 μm), and helium was used as a carrier gas at a linear velocity of 45 cm s−1. The injector temperature was set at 250°C. The column was kept initially at 60°C for 1 min and then raised at a rate of 20°C min−1 to 300°C and maintained at this temperature for 2 min. The ion source temperature was set at 250°C and the interface at 270°C. The ions of m/z between 40 and 500 were monitored from 1 to 15 min with 1 μl of injection volume in splitless mode. Identification of fatty acid trimethylsilyl ester was achieved by comparing the mass spectra with the NIST database library and mechanism fragmentation.
GALDI-time-of-flight (TOF) sample preparation
Solutions of oleic and linoleic acids, and lipid extract isolated from E. oligosperma, were prepared in H2O : ACN 1 : 4 (v : v). The oleic acid solutions were prepared at concentrations of 0.002, 0.2, 200, and the linoleic acid and the lipid extract at a concentration of 0.2 ppm. The volume of 1.0 ml of these solutions was transferred to microtubes containing 0.04 g of MGS-1 (or Fe2O3) and left in an ultrasonic bath for 5 min. The biological sample was prepared by adding 0.008 g of lyophilized yeast in 0.08 g of MGS-1. This mixture was suspended in 1.0 ml of H2O and homogenized in a vortex at the frequency of 70 Hz. The methodology was adopted to promote a homogeneous mixture of the biomolecules with the matrix. A volume of 1 μl of each prepared suspension was transferred to different sample holder spots using a micropipette and dried for 15 min at room temperature before being introduced and pumped into the spectrometer vacuum chamber.
GALDI-TOF instrumentation and parameters
The measurements were performed using an Autoflex Speed™ Mass Spectrometer (Bruker Daltonics, Bremen, Germany). A 355 nm Nd:YAG laser source operating at a frequency of 10 Hz and 70% of the nominal power focused on a ≈5 μm diameter spot was used to induce the ionization/desorption processes. The positive ion mass spectra were acquired after TOF separation in the reflectron mode with an acceleration voltage of 19 kV. The ions were detected by microchannel plates. All spectra were collected from an average of 100 laser shots. The mass calibration was carried out using a standard mixture for low masses. An MTP 384 polished steel target and matrices of mineral origin (MGS-1 and Fe2O3) were used in the current study. The working pressure of the spectrometer was around 10−7 mbar.
Results and discussion
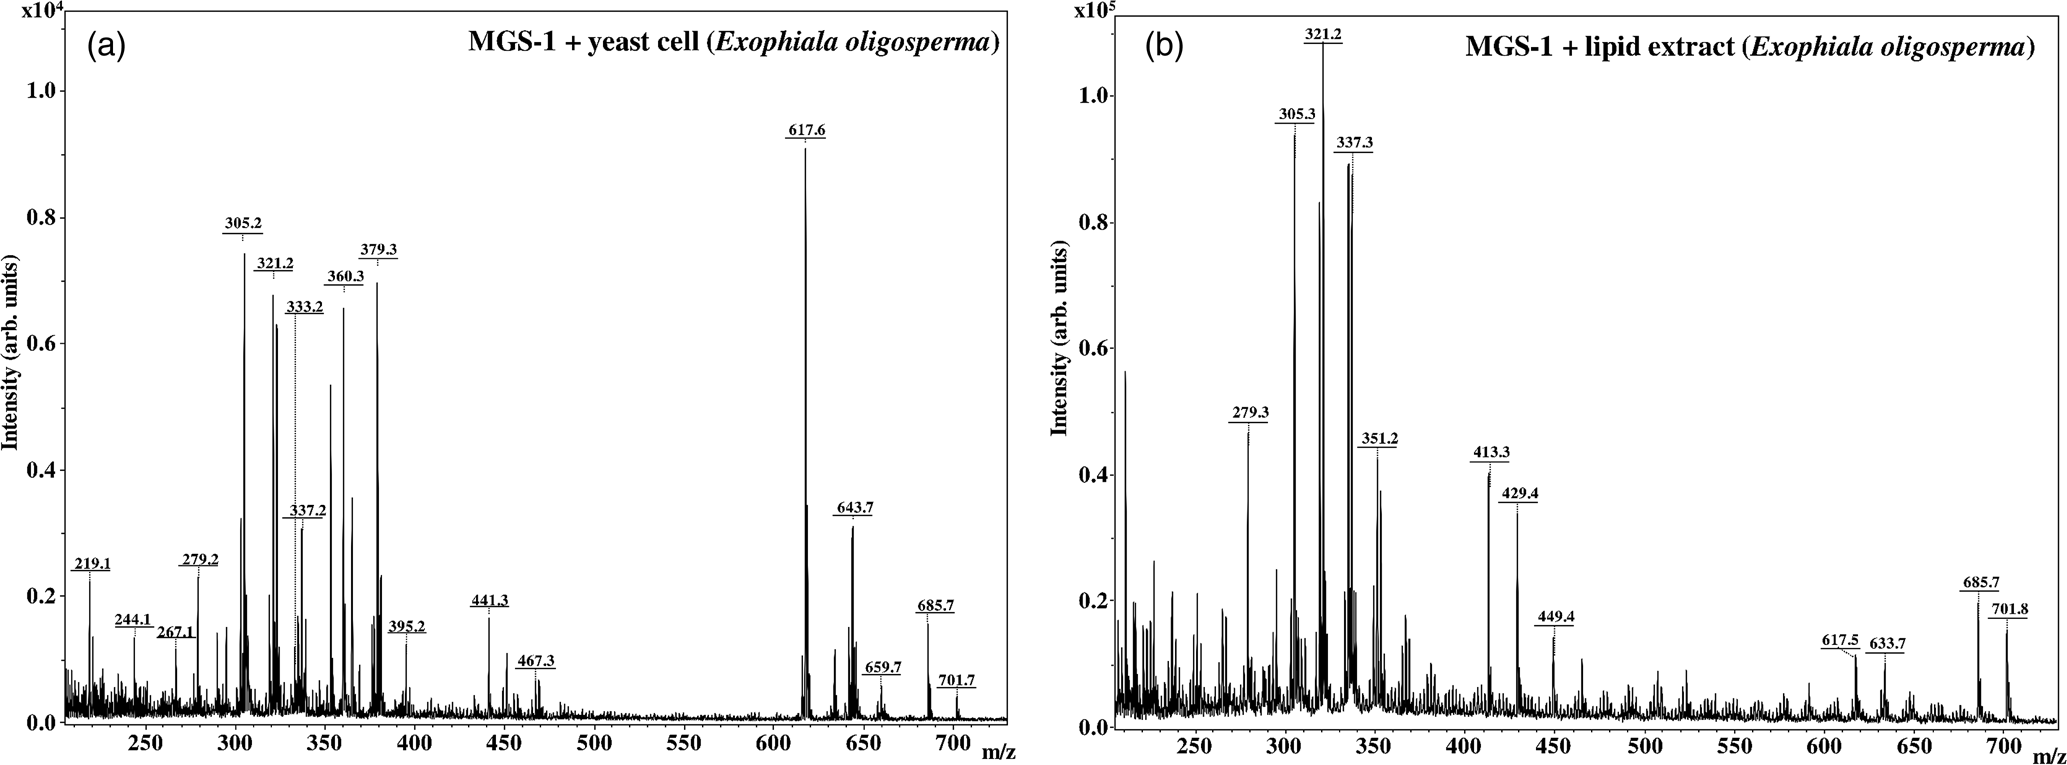
GALDI-MS measurements in the 200–750 m/z range of samples containing E. oligosperma intact cells and their lipid extract dispersed in MGS-1 are shown in Fig. 1(a) and (b), respectively. Despite the MGS-matrix's roughness, it was possible to obtain spectra with sufficient mass resolution to identify the target compounds. The GALDI-MS spectrum of the lipid extract was obtained to support the assignments of the ions observed in Fig. 1(a) and to provide information about the lipid pattern itself. The lipid extract's GC-MS analysis, whose details are given in the Supplementary material, supports the present investigation. Besides, the spectra were interpreted considering the possibility of cation-attached organic ion formation due to the matrix mineral nature (Yan et al., Reference Yan, Stoner, Kotler, Hinman and Scott2007; Richardson et al., Reference Richardson, Hinman and Scott2009). No attempt was made to quantify relationships between the various ions observed in the current study since they are dependent on the ionization efficiencies of the elements and compounds and their interactions with the matrix minerals (Yan et al., Reference Yan, Stoner, Kotler, Hinman and Scott2007; Kotler et al., Reference Kotler, Hinman, Yan, Stoner and Scott2008). For instance, the difference in ion abundances observed in Fig. 1(a) and (b) can be partially attributed to the presence of several polar molecules in the former spectrum. Since the GALDI-MS ionization processes occur by the acid–base reaction in the gas phase induced by the laser, the polar molecules will be more promptly ionized due to the presence of heteroatoms, suppressing the ionization of apolar molecules, such as fatty acids. In this sense, the remotion of the lipid extract's polar substances facilitates identifying the free fatty acids adsorbed on the matrix (Leopold et al., Reference Leopold, Popkova, Engel and Schiller2018). This procedure enables us to identify the fatty acids' biosignatures that can be present in the spectrum of Fig. 1(a). The lipid pattern study is also essential, for instance, if we assume that free fatty acids are present on Mars rather than intact phospholipids. Finally, the laser beam spot size is smaller compared with the MGS-1 nominal mean grain size of 122 μm (Cannon et al., Reference Cannon, Britt, Smith, Fritsche and Batcheldor2019). Since the ionization/desorption processes' assistance is strongly related to the mineral species, the observed pattern is also associated with the interaction site's predominant mineral. In the current study, no further study about the ionization pattern's dependence with the heterogeneity of the matrix for the samples containing the intact cells and the lipid extract was carried out. However, results showing this dependence for a fatty acid sample are discussed below.
GALDI-MS spectrum of the MGS-1 samples containing (a) intact cells of the black fungi E. oligosperma and (b) its corresponding lipid extract.

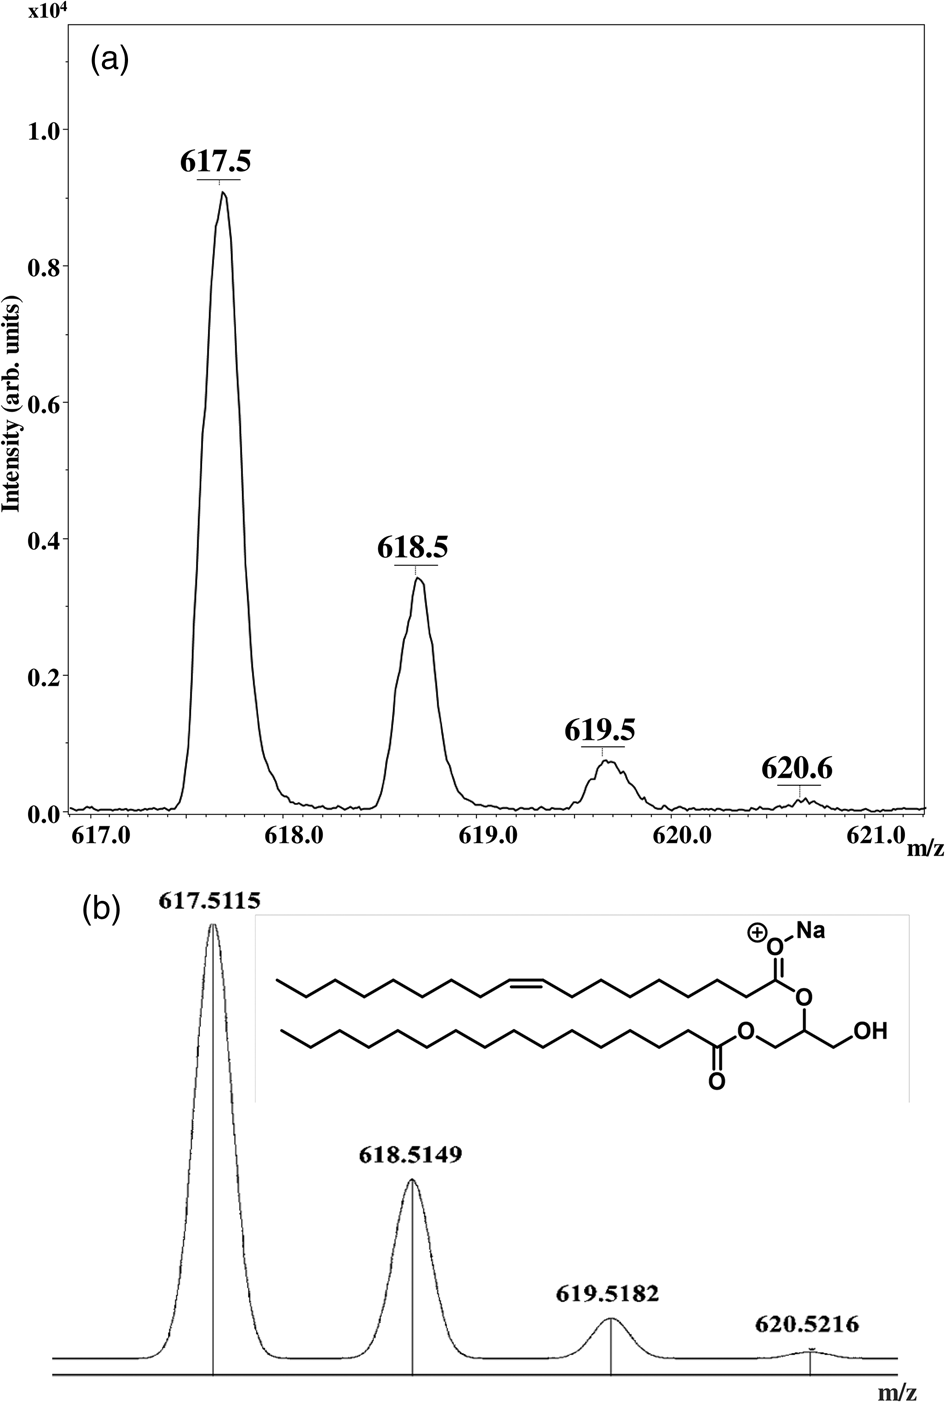
In Fig. 1(a), we attribute the occurrence of the base peak at m/z 617.6 to the presence of diacylglycerol (DAG). This molecule was already reported in previous studies of yeast by using MALDI-MS (Stübiger et al., Reference Stübiger, Wuczkowski, Mancera, Lopandic, Sterflinger and Belgacem2016). From these studies, it is known that most yeast DAGs contains oleic acid (C18:1) and palmitoleic acid (C16:0) (Ganesan et al., Reference Ganesan, Shabits and Zaremberg2016). Since the matrix is composed of several minerals largely associated with Na+ and K+ ions, e.g. pyroxene (Cannon et al., Reference Cannon, Britt, Smith, Fritsche and Batcheldor2019), it is reasonable to assume that the ion at m/z 617.6 probably correspond to the sodium adduct of the C18:1/C16:0 DAG (theoretical molecular formula: C37H70O5, calc. [M + Na]+ at m/z 617.5). This hypothesis is supported by the occurrence of such fatty acids in the sample analysed by GC-MS and also by the presence of ions at m/z 618.5, 619.5 and 620.6 corresponding to the carbon isotopic pattern of the DAG (C18:1/C16:0) sodium adduct, as shown in Fig. 2(a). This experimental data are also in excellent agreement with the simulated isotopic pattern shown in Fig. 2(b).
(a) Expanded mass spectrum around ion m/z 617 region and (b) simulation of the isotopic pattern of the DAG (C18:1/C16:0) sodium adduct by Compass IsotopePattern® software.

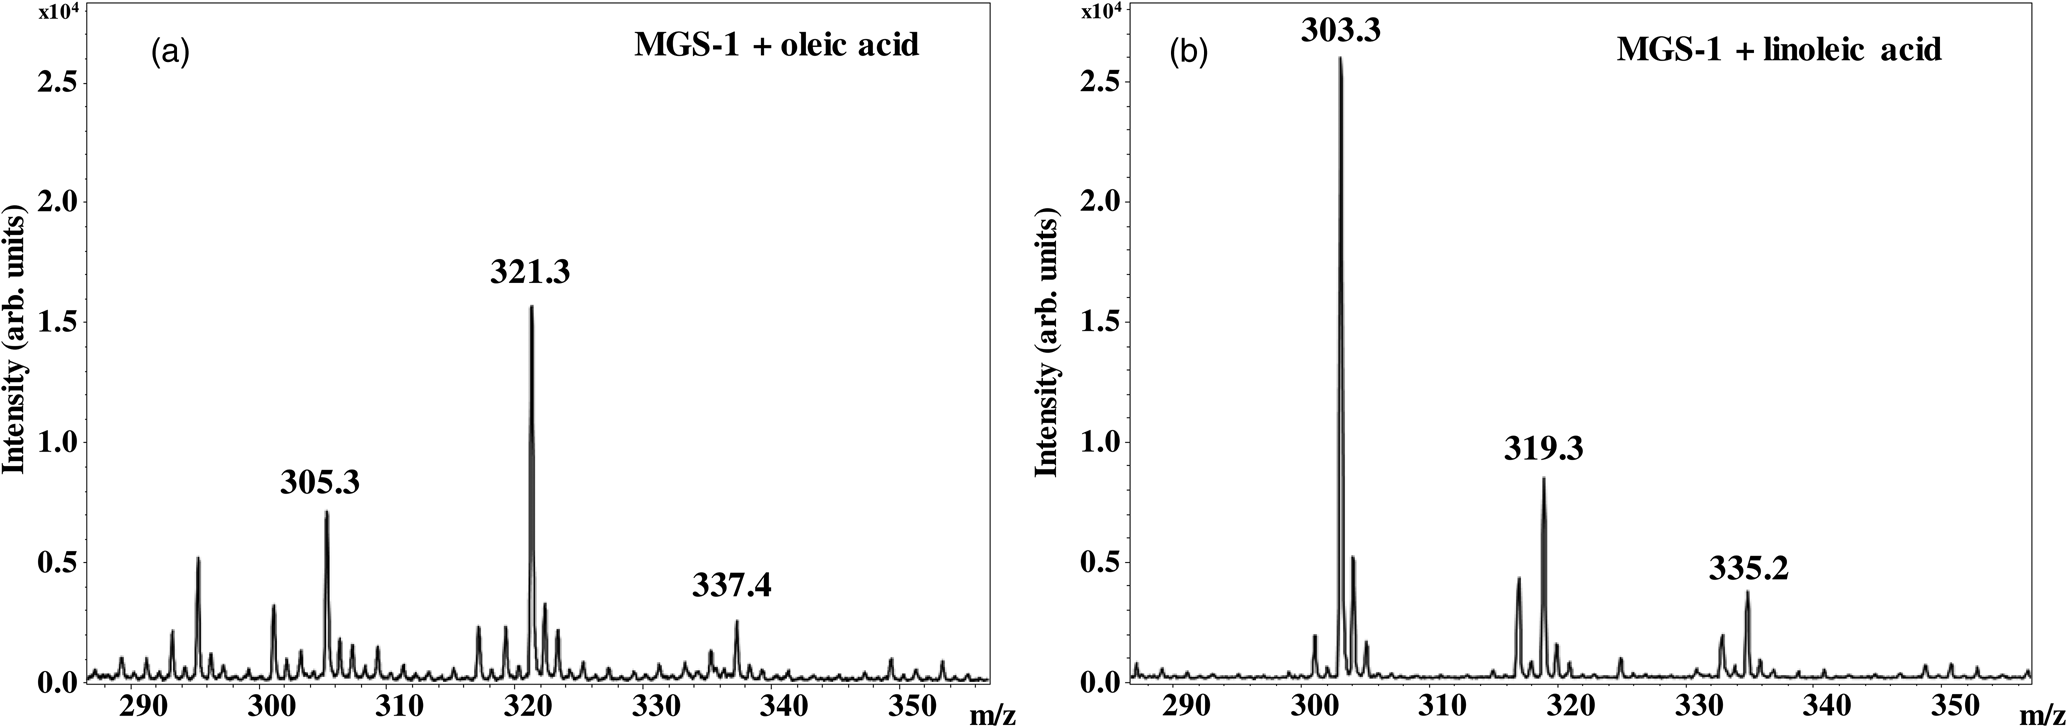
The ions in the range below m/z 500 shown in Fig. 1(a) are probably associated with the fatty acid adducts since they are also present in the mass spectrum of the lipid extract. To accurately identify these ion adducts, we performed measurements using solutions containing only oleic acid (C18:1) and linoleic acid (C18:2) dispersed in the MGS-1 matrix. Both of them were identified in the GC-MS. The results for the concentration of 0.2 ppm are shown in Fig. 3(a) and (b), respectively. The spectra obtained for C18:1 fatty acid at concentrations of 0.002 and 200 ppm, along with the mass spectrum from pure MGS-1 matrix, are shown in Fig. S4 available in the Supplementary material. The observed variation in ion abundance between oleic acid concentrations could probably be related to the nature of the interaction between the analyte and the matrix, as already mentioned. Even at concentrations of 0.002 ppm, the peaks at m/z 305.2 and 321.2 are still observed above the matrix background. These ions correspond to the C18:1 sodium ([M + Na]+) and potassium ([M + K]+) adducts, respectively. The designation of these ions as alkaline adducts of C18:1 became evident when replacing it with C18:2, where the decreasing displacement of two mass units in its mass spectrum is observed, as shown in Fig. 3(b). Besides, the mass separation of 16 u between the labelled peaks is a typical signature of alkaline adducts in the mass spectrum corresponding to the difference between the potassium (39 u) and sodium (23 u) molar masses. Peaks with such mass differences were also observed by Kotler et al. (Reference Kotler, Hinman, Yan, Stoner and Scott2008). However, those authors argue that this is most likely related to the replacement of O by S in the cluster ions observed by them. In addition to the fact that our matrix is less rich in S, our spectra’ isotopic pattern is not consistent with such substitution. It is also chemically improbable for the samples under study. Therefore, our results indicate that the observed pattern is associated with sodium and potassium cationization reactions. In this sense, the ion at m/z 279.3 can presumably be associated with the sodium adduct of C16:0.
GALDI-MS spectrum of (a) oleic acid (C18:1) and (b) linoleic acid (C18:2), both at a concentration of 0.2 ppm, dispersed in the MGS-1 matrix.

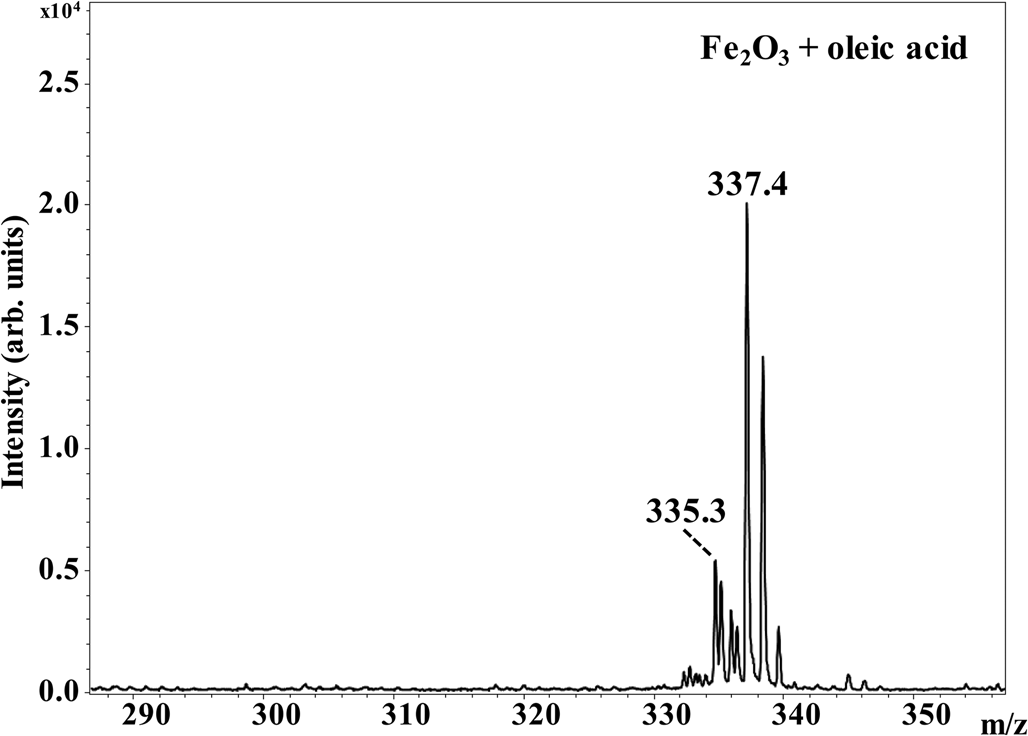
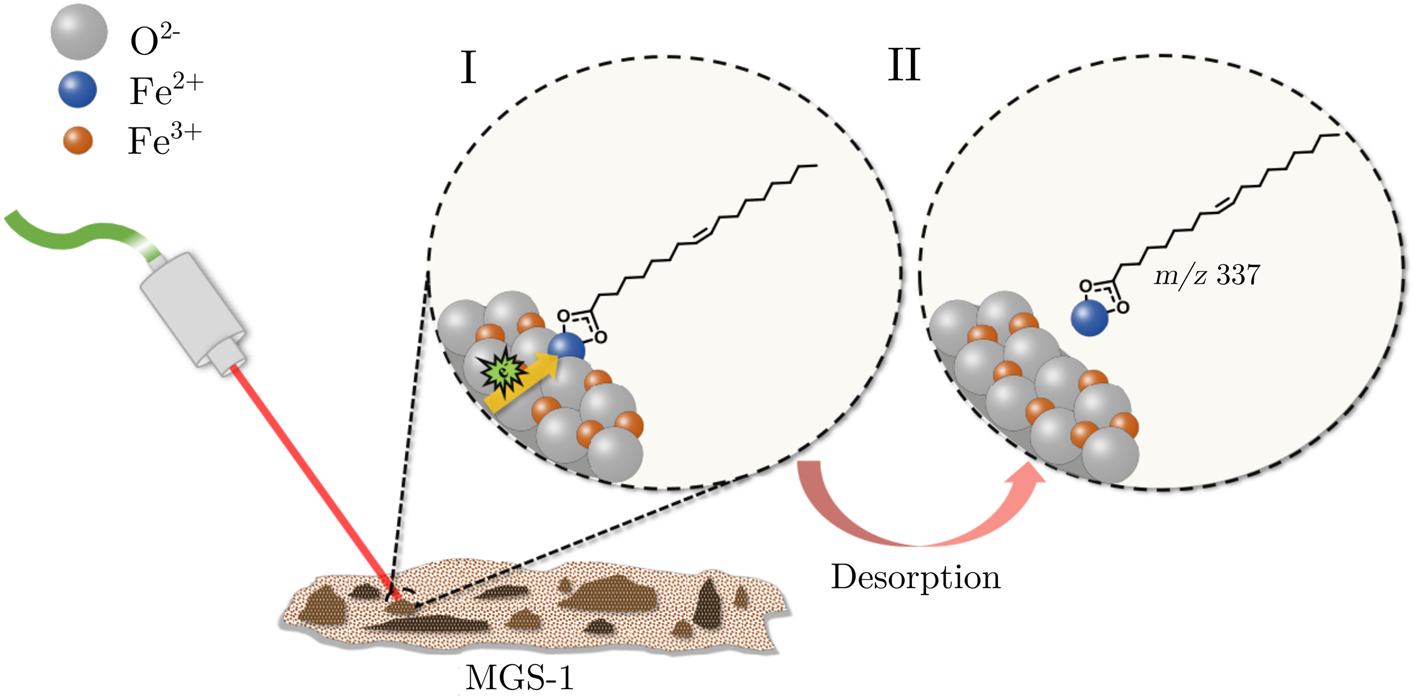
An interesting situation is related to the ions at m/z 337.4 and 335.2 in Fig. 3(a) and (b), respectively. These ions are most likely associated with iron adduct formation, corresponding to the addition of 56 u from iron-cation to the mass of C18:1 (MW = 282 u) and C18:2 (MW = 280 u), respectively. A high concentration of iron oxides present in the minerals hematite (Fe3+), jarosite (Fe2+) and magnetite (Fe3+ and Fe2+) contained in MGS-1 may be responsible by the presence of these adducts in our mass spectra. However, the complexation of Fe3+ with the carboxyl group of fatty acids would result in a double charged state species, leading to an ion at m/z 168.5, which was not observed in the current study. To test the hypothesis to the formation of iron complexes, we have used a matrix with only Fe3+. This oxidation state is the most abundant on the Martian surface (Price et al., Reference Price, Pearson, Schwenzer, Miot and Olsson-Francis2018) and, therefore, of great interest. The mass spectrum of oleic acid dispersed on the Fe2O3 matrix is shown in Fig. 4 and contains the ion m/z 337.4 as base peak. The presence of ions at m/z 335.3, 337.4 and 338.2 is in some agreement with the expected Fe isotopic pattern with the relative abundances of the ions 335.3 and 338.2 higher compared with the simulated pattern shown in Fig. S3 (Supplementary material). Mathematically, the number 337.4 corresponds to the combination of the ionized carboxylic fatty acid (281 u, [M − H]) with the most stable isotope of iron (56Fe), resulting in a positively monocharged ion, detected in our spectra as [M − H + Fe2+]+. The formation of this iron-adduct is only possible if we consider a reduction reaction Fe3+ to Fe2+ probably induced by secondary electrons in the plume generated by the laser pulse (Knochenmuss and Zenobi, Reference Knochenmuss and Zenobi2003). In Fig. 5, we present the possible pathway that leads to the formation of the [M − H + Fe2+]+ ion. A similar situation can hypothetically occur on Martian soil due to secondary electrons' presence from ionizing radiation to which the planet's surface is exposed.
GALDI-MS spectrum of oleic acid (0.2 ppm) in the Fe2O3 matrix.

Possible pathway to the formation of ion at m/z 337.4. Secondary electrons from the highly ionized laser plume promotes the reduction of Fe3+ in Fe2+ and the production of [M − H + Fe2+]+ ion.

Therefore, our results indicate the possibility of detecting iron adduct ions in lipid samples studied by GALDI-MS. This is in disagreement with the results reported by Yan et al. (Reference Yan, Stoner, Kotler, Hinman and Scott2007) that studied samples of amino acids in matrices of Fe2O3 by GALDI-MS observed no iron-attached ions. They suggested that the lack of such ions is due to the fragmentation of the amino acids that most likely occur due to the abundance of excited state Fe ions in the gas phase. However, the reason for the discrepancy observed between our results and those of Yan et al. (Reference Yan, Stoner, Kotler, Hinman and Scott2007) is not clear to us. We believe that the detection of iron-attached ions may be linked to the fact that in the current study, the ratio between the amount of analyte and matrix is ~1000 times less than that used by those authors. Further studies are intended to be performed by our research group to clarify this issue.
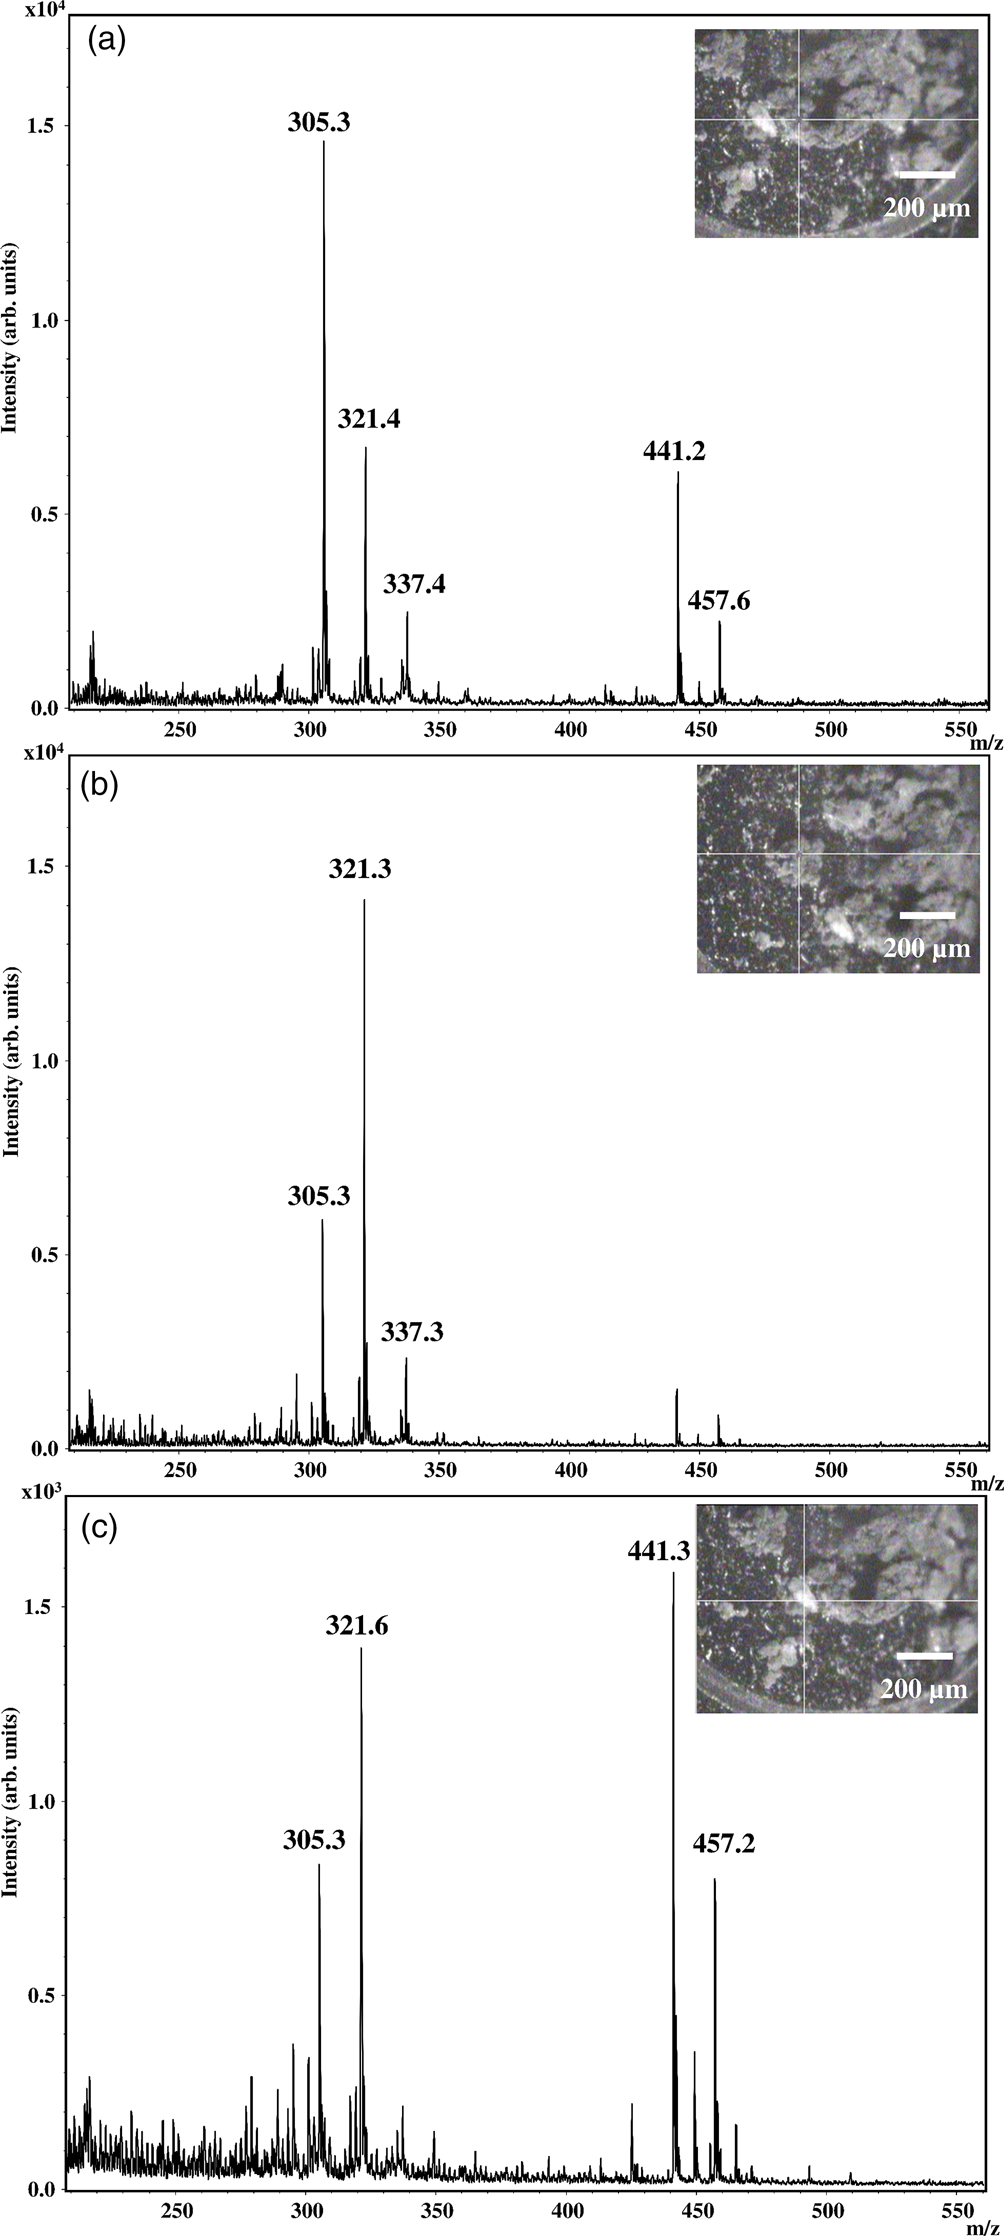
Finally, further concern about the complexity of the observed spectra must be addressed. Figure 6 shows the mass spectra of pure oleic acid dispersed in MGS-1 obtained from different positions on the same spot target. The ions at m/z 441.3 and 457.2 could not be unambiguously identified. It is observed that the relative abundance of the ions in the mass spectrum is strongly dependent on the heterogeneity of the matrix. The concentrations of different minerals or the mineral phases throughout the matrix significantly interfere with the observed signal's intensity. As pointed out by Yan et al. (Reference Yan, Stoner, Kotler, Hinman and Scott2007), this results from how different minerals assist the ionization/desorption process. In this context, the results of the current study differ from those obtained by traditional GALDI/MALDI-MS mainly due to the matrix's complexity. Despite this, our study shows that quite useful results in the identification of biomolecules can be obtained.
GALDI-MS spectra of pure oleic acid at concentrations of 0.2 ppm dispersed in the MGS-1 matrix obtained from different positions on the same spot target.

Conclusion
We performed an analysis of microbial lipids deposited on MGS-1 regolith using the GALDI-MS technique. The results obtained are encouraging and indicate that lipids from intact microbial cells of a black yeast strain can be detected in Martian soil samples. These lipid molecules are predominantly associated with the occurrence of adducts in the GALDI-MS spectra. Sodium adducts of DAG and fatty acid adducts of sodium, potassium and iron are observed in the mass spectra. Different adducts arise due to the geological complexity of the soil, here represented by the MGS-1 matrix. The detection of adducts instead of isolated molecules in the mass spectra can better identify lipid compounds or other organic molecules in Martian soil. Therefore, the regolith's ability to assist the ionization/desorption process makes the GALDI technique very promising in the search for mineral-associated lipid, an important group of organic molecules intrinsically linked to biochemical processes. We hope that our investigation can contribute to efforts in the search for extraterrestrial life.
Supplementary material
The supplementary material for this article can be found at https://doi.org/10.1017/S1473550421000100.
Acknowledgements
This research was supported by the Brazilian agencies: Conselho Nacional de Desenvolvimento Científico e Tecnológico (CNPq) – Grant no. 311152/2016-3 and 304867/2017-9, Coordenação de Aperfeiçoamento de Pessoal de Nível Superior (CAPES) – Finance Code 001 and Fundação de Amparo à Pesquisa do Estado de São Paulo (FAPESP) – Grant no. 2010/52312-8. A.S. is grateful to CAPES for his Ph.D. scholarship (Grant no. 88887.598052/2021-00). The authors also would like to thank one of the reviewers for kindly bringing significant references to our attention.