Introduction
The concepts of non-fermented liquid feeding (NFLF) and fermented liquid feeding (FLF) have been well described by Canibe and Jensen (Reference Canibe and Jensen2003). Liquid feeding of pigs can significantly reduce production costs as it allows the use of low, dry matter by-products and can, to some extent, offer welfare benefits under hot, summer conditions (Scott et al., Reference Scott, Chennells, Armstrong, Taylor, Gill and Edwards2007). The advantages of liquid compared with dry feeding include improved growth rates, shorter time to slaughter, improved feed to gain ratio or a combinations of these performance parameters (Braude, Reference Braude1967 and Reference Braude1971; Jensen and Mikkelsen, Reference Jensen and Mikkelsen1998; Lawlor et al., Reference Lawlor, Lynch, Gardiner, Caffrey and O’Doherty2002; Canibe and Jensen, Reference Canibe and Jensen2003). For example, average daily live-weight gain (ADG) of newly weaned pigs offered NFLF was 12 ± 9.4% higher than those observed following dry feeding (Jensen and Mikkelsen, Reference Jensen and Mikkelsen1998), and ADG was further increased by offering FLF (Dung et al., 2005). Pigs offered liquid feed acidified with lactic acid performed similar to those offered FLF (Geary et al., Reference Geary, Brooks, Beal and Campbell1999). However, others have found that the benefits of FLF (Lawlor et al., Reference Lawlor, Lynch, Gardiner, Caffrey and O’Doherty2002) and NFLF (Murphy, 2002) are no longer observed as the animal ages. Moreover, differences in carcass characteristics between pigs are not apparent between dry and liquid feeding systems (Murphy, 2002; Stotfold, 2005).
Although it is accepted that liquid feeding generally has a beneficial effect on pig performance, the amount of water in the feed influences the degree of improvement. For example, earlier work using feed-to-water ratios of 1 : 1.5 and 1 : 2.5 failed to report improvements (Barber et al., Reference Barber, Braude and Mitchell1963; Braude and Rowell, Reference Braude and Rowell1967). In contrast, increasing the feed : water ratio to 1 : 3 or 1 : 3.5 improves growth and feed efficiency (Gill et al., Reference Gill, Brooks and Carpenter1987; Barber et al., Reference Barber, Brooks and Carpenter1991a and Reference Barber, Brooks and Carpenter1991b). However, when a higher water diet is fed (i.e. 1 : 6) dry matter intake, and hence ADG, is depressed (Rerat and Fevrier, Reference Rerat and Fevrier1965; Kornegay and Vander Noot, Reference Kornegay and Vander Noot1968). Much of the work on water-to-feed ratios was conducted more than 15 years ago and there is a limited number of recent investigations on the water-to-feed ratio using modern pig genotypes and management systems.
It has been suggested that the improved performance of newly weaned pigs offered a liquid diet is due to the increased daily feed intake (DFI) coupled with the maintenance of gut integrity following weaning, and changes in the structure of villi (Deprez et al., Reference Deprez, Deroose, van den Hende, Muyelle and Oyaert1987; Pluske et al., Reference Pluske, Hampson and Williams1997), which act to maintain the digestive capacity of the pig. Pig performance on FLF is claimed by some (e.g. Brooks, Reference Brooks1999a and Reference Brooks1999b) to be better than NFLF. The reduction in the pH of fermented and acidified feeds due to the activity of Lactobacillus sp. is thought to underline the improvements through effects on proteolysis in the stomach (Longland, Reference Longland1991). It may also help to eradicate harmful Coliform microbes such as Escherichia coli from the digestive tract (Jensen and Mikkelsen, Reference Jensen and Mikkelsen1998), consequently reducing the incidence of scours and malabsorption. The overall objective of the study was to examine the growth performance of pigs offered liquid feed or dry feed as either a restricted or an ad libitum ration, and whether their growth performance was further influenced by the water-to-feed ratio.
Material and methods
Animals and experimental design
All pigs used in these studies were supplied by Cotswold Pig Development Company Ltd and maintained at their Pig Research and Development Unit at Wye, Kent, UK. At all stages of life animals were kept within the guidelines set out by the Department for Environment Food and Rural Affairs (DEFRA, 2003), and the study had been approved by the Local Ethical Committee. Pigs were housed in pens with the lying area measuring 2.54 × 2.75 m, with a dunging area of 2.75 × 1.8 m. Individual feeding crates were situated within the pens to enable feed intake to be restricted; pigs had free access to each of these feeding crates. All pens contained two self-drinkers and water was provided ad libitum. The pen floors were concrete with a covering of wood shavings, which were scraped out and replaced daily. The test house was mechanically ventilated and an ambient temperature of between 15°C and 20°C was maintained by adjusting the ventilation rate.
The study was split into two parts to enable unrestricted (trial 1) and restricted (trial 2) feeding to be compared. The first trial was designed as a completely randomised design with eight pens of male pigs (n = 64) randomly assigned to one of two treatments (n = 32 per treatment), which were offered as an unrestricted (UR) ration: (i) D diet (DUR) or (ii) D diet mixed with water at a feed-to-water ratio (w/w) of 1 : 3 (1 : 3 UR). The standard feeding systems for commercially reared pigs on the unit were used in this trial, and hence provided a baseline for production traits under this particular management system. Dry feed was offered from a single hopper in each pen. Liquid feed was prepared by mixing in a bulk tank and offered in the non-fermented form supplied by pipeline into a single trough in each pen (Hampshire Feeding System, Feed Manager 1, Hampshire Feeding Systems Ltd, New Milton, Hampshire, UK). The pH of the liquid feed was similar to the 1 : 3 diet offered in the second trial, indicating fermentation was not occurring. The DFI was calculated per group of pigs rather than for each individual animal; thus more replicates were included.
Trial two was arranged as a completely randomised design involving thirty-two boars, which was subsequently duplicated to give a total of 64 animals (n = 16 per group). Within each pen of eight pigs, two animals were randomly assigned to one of four treatments, which were subsequently offered as restricted (R) rations. The four treatments were: (i) Standard dry pellet diet (DR: BOCM Pauls Ltd; 19% CP, 1.15% lysine and 14 MJ/kg digestible energy (DE)) or D diet soaked in water at a feed-to-water ratio (w/w) of (ii) 1 : 1.5 (1 : 1.5 R) (iii) 1 : 3. (1 : 3 R) or (iv) 1 : 3 diet with the addition of lactic acid immediately prior to feeding (Lactic Acid Feed 80, Purac Biochem) to adjust the feed to a pH of 4 (1 : 3(4) R). The acid was substituted for an equal volume of water to maintain the same dry matter concentration as in (iii). The amount of lactic acid required to achieve the correct pH varied to some extent but was approximately 6 ml lactic acid per litre of wet feed. A ratio of 1 : 1.5 was chosen to act as an intermediate for the dry diet and at a 1 : 3 ratio, and these rations have been used by others (Barber et al., Reference Barber, Braude and Mitchell1963; Holme and Robinson, Reference Holme and Robinson1965; Gill et al., Reference Gill, Brooks and Carpenter1987). Diet 1 : 3(4) represents a pH value similar to that of fermented feed (Brooks, Reference Brooks1999a). The pH of the water added to the feed and supplied to the pigs for drinking did not vary from 7.25 during the entire trial. The pH of each meal was tested and recorded immediately prior to feeding the pigs.
The rations were freshly prepared daily and on weekdays pigs were individually fed three times daily at 0700, 1200 and 1700 h. Water was available ad libitum at all times except during the meals. Animals voluntarily entered the individual feeding crates at the specific feeding times, and were allowed sufficient time to finish the ration following which they were released and all refusals collected and weighed. Feeding three times daily was adopted in order to ensure a high DFI with minimum refusals of feed. The total amount offered per day was approximately 5% to 10% below the ad libitum intakes previously recorded for similar genotype, dry-fed pigs in trial 1 above. Initially pigs were given 7 days to adapt to their respective experimental diets and the amount was adjusted to a level where all animals readily consumed their entire ration. The amount of feed offered was reviewed weekly and increased from 1.45 to 2.65 kg of air-dry feed per day from week 1 to slaughter (week 6).
The pigs on trial one were weighed at the start and again at the end of the study, while those on the second trial were weighed at weekly intervals throughout the 6-week experimental period. DFI and ADG were recorded to allow their feed conversion ratio (FCR) to be calculated. In addition, ultrasound measurements of backfat and eye muscle depth were recorded (Aloka-echo camera 550-500, Aloka Ltd, Japan) at the start and end of the study. Lean tissue growth rate (LTGR) was estimated using the following formula:

(Whittemore, Reference Whittemore1998).
Although it is acknowledged that this equation may not be directly applicable to the porcine genotype and management system used in the current study, it does give an indication of differences between groups. In the second trial, the eating rate of pigs in the first replicate was recorded on 2 consecutive days each fortnight. On each day the pigs were brought into their feeding pens, presented with their meal and the time taken to finish it was recorded. On the few occasions when a pig failed to eat all of the meal, the total eating time recorded was divided by the amount actually eaten. If a pig totally refused to eat or was observed playing with the feed, these data were omitted from the analysis but in practice this was rare.
Feed analysis
Analysis of the feed was conducted in duplicate to determine crude protein %, ash %, oil %, and neutral detergent fibre % and water-soluble carbohydrate % (MAFF, 1986; Association of Official Analytical Chemists, 1990). The mean values were subsequently used to calculate the DE content of each dietary treatment (MAFF, 1993).
Statistical analysis
One animal in the 1 : 1.5 R dietary treatment group developed serious scours at the start of the trial and was removed. The data from the replicates were pooled as pen did not appear to influence the data. Statistical differences between dietary-treated groups were assessed using analysis of variance using Genstat 5.4. Regression analysis was used to determine ADG, DFI and FCR, and comparisons of the regression slopes and intercepts undertaken on ADG and FCR using Genstat 5.4. The eating rate data were subjected to analysis using the general linear model in Minitab 13 and further analysed by linear regression of eating rate against live weight.
Results
Chemical composition and physical characteristics of the diets
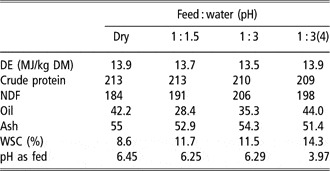
Chemical analyses of the diet showed marginal differences between DE, NDF, oils and ash components of the diet (Table 1). The biggest difference was in water-soluble carbohydrates but the values were subject to variation between samples both within and between dietary treatments. The mean pH values for all meals confirmed that the time allowed for soaking did not permit fermentation-induced changes in pH to occur. The average pH of the 1 : 3(4) diet was close to the intended pH of 4.0, which is generally observed in FLF.
Analysis of the main nutrient components (g/kg DM unless otherwise stated) and calculated digestible energy (DE) contents of each dietary treatment

NDF = neutral detergent fibre; WSC = water soluble carbohydrates.
Animal performance
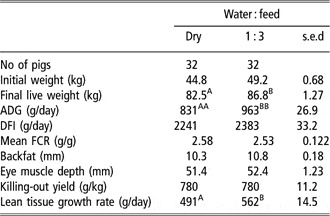
Live weight of the pigs was similar between the dietary treatment groups at the start of the study (Table 2). ADG (P < 0.001) and hence their live weight (P < 0.01) at the end of trial 1 were greater in pigs offered the 1 : 3 UR diet compared with D UR animals. In contrast, there were no differences observed in either DFI or FCR between the two groups. Although backfat thickness, eye muscle depth and killing-out percentage were similar, LTGR was improved (P < 0.01) in animals receiving the 1 : 3 UR diet.
The effects of water to feed ratio of the diet over a period of 6 weeks of unrestricted feeding on pig growth performance, daily feed intake, feed conversion ratio and carcass characteristics (FCR) of male pigs

Values are presented as means. ADG = average daily gain; DFI = daily feed intake; FCR = feed conversion ratio. Within a row means with different superscripts are significantly different, ABP < 0.01 and AABBP < 0.001.
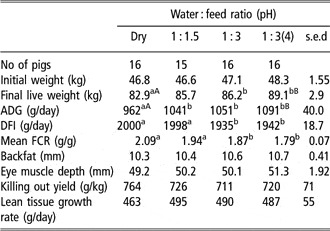
Within the restricted feeding groups, pigs offered the 1 : 3 diets were heavier (P < 0.05) and their ADG greater than those receiving dry pellets, with the greatest increases observed when lactic acid was added to the diet (Table 3). Although the 1 : 1.5 R group exhibited intermediate ADG (P < 0.05), there was no difference in their final live weight compared with the DR group The opposite was observed with respect to DFI, which was lower (P < 0.01) in the 1 : 3 R and 1 : 3(4) R animals, resulting in markedly improved (P < 0.001) FCR in these two groups. Backfat, eye muscle depth, killing-out yield and LTGR were similar between treatments (Table 3).
The effects of varying the water-to-feed ratio and pH of the diet over a period of six weeks of restricted feeding (5% to 10% below ad libitum intake) on pig growth performance, daily feed intake, feed conversion ratio and carcass characteristics (FCR) of male pigs

Values are presented as means. ADG = average daily gain; DFI = daily feed intake; FCR = feed conversion ratio. Within a row means with different superscripts are significantly different, abP < 0.05 and ABP < 0.01.
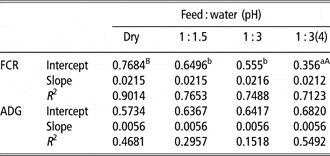
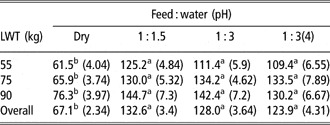
The gradients of the regression lines for FCR and ADG were similar between the four R groups as was the intercepts for ADG (Table 4). In terms of FCR, the intercepts of the 1 : 3 R and 1 : 3(4) R diets were significantly lower (P < 0.05) than the D diet and the 1 : 3(4) R value was lower (P < 0.05) than the 1 : 3 R group. Liquid-fed R pigs had faster (P < 0.001) eating rates compared with the D pigs but generally there was little difference in the rate between the liquid treatments despite the fresh weight and volume of the 1 : 3 R diets being 60% greater than the 1 : 1.5 R (Table 5). A comparison between the eating rates at the 0700 h meal after the pigs had fasted overnight with those at the 1200 h meal revealed no statistical differences. There was a close correlation between eating rate (y) and live weight (x) for the D (y = 0.5203x + 31.747), 1 : 1.5 (y = 0.7501x + 78.484) and 1 : 3 (y = 1.0747x + 53.552) diets with R 2 values of 0.78, 0.67 and 0.83. The 1 : 3(4) diet had a much lower correlation of 0.256 (y = 0.4262x + 89.961) than observed in the other groups.
Regression intercept, slope and R 2 values for feed conversion ratio (FCR) and average daily live weight gain (ADG : g/day) between the restricted dietary treatments when parallel regression lines are fitted

Values with different superscripts are significantly different, abP < 0.05 and ABP < 0.01.
Mean eating rates of pigs (expressed as eating rate of dry pellet equivalent in g/min) on liquid and dry diets measured during three 2-week periods at live weights of approximately 55, 75 and 90 kg

The means were calculated from four separate meals over 2 days. Means with different superscripts differ significantly, P < 0.05.
Discussion
There is a plethora of data to indicate that liquid feeding of pigs may significantly reduce production costs, improve growth rates, time to slaughter, lower feed to gain ratio or a combinations of these performance parameters besides offering welfare benefits (Braude Reference Braude1967 and Reference Braude1971; Jensen and Mikkelsen, Reference Jensen and Mikkelsen1998; Lawlor et al., Reference Lawlor, Lynch, Gardiner, Caffrey and O’Doherty2002; Canibe and Jensen, Reference Canibe and Jensen2003; Scott et al., Reference Scott, Chennells, Armstrong, Taylor, Gill and Edwards2007). However, there has been little new work on liquid feeding in growing-finishing modern porcine genotypes. Our findings clearly indicate benefits of feeding liquid diets to modern genotypes, whereas results obtained in earlier studies (e.g. Meade et al., Reference Meade, Hanke, Tumbleson, Wass and Hanson1964, Braude and Rowell, Reference Braude and Rowell1967; Forbes and Walker, Reference Forbes and Walker1968; Klay et al., Reference Klay, Smith and Weller1969) were much more variable.
DFI was similar between D UR and 1 : 3 UR groups. Liquid feeding did improve ADG and LTGR, agreeing with previous results demonstrating an increase in ADG on liquid feeding (Chae et al., Reference Chae, Han, Kim, Yang, Ohh and Rhee1997). Both the FCR and ADG observed in the current study are comparable with the results published by Stotfold (2005) for finishing pigs reared on an unrestricted diet. It is of interest to note that ADG are greater when feed intake is restricted and hence FCR are substantially improved. FCR was 7% to 10% better in animals offered a restricted liquid diet and are in accordance with the findings of (Jensen and Mikkelsen, Reference Jensen and Mikkelsen1998), but these advantages disappeared on an ad libitum diet. Differences are most likely due to wastage or spillage around the trough (Forbes and Walker, Reference Forbes and Walker1968; Brooks, Reference Brooks1999a and Reference Brooks1999b) but may also be partially attributed to the eating behaviour and social hierarchies of grouped compared with individually fed pigs (Bryant and Ewbank, Reference Bryant and Ewbank1972; Vargas et al., Reference Vargas, Craig and Hines1987).
Previous studies have used a range of water ratios and have reported a beneficial effect of increasing the water-to-feed ratio on the growth rate and FCR (Gill et al., Reference Gill, Brooks and Carpenter1987). Other workers have reported better results obtained with ratios of 1 : 2.5 to 1 : 4, which coincidentally are also in the best operating range for pipeline distribution systems. Higher water ratios have been shown to increase digestibility (Barber et al., Reference Barber, Brooks and Carpenter1991a). In contrast to the earlier work of Barber et al. (Reference Barber, Braude and Mitchell1963) and Braude and Rowell (Reference Braude and Rowell1967), we have shown that a lower feed-to-water ratio of 1 : 1.5 R can result in improvements in both FCR and ADG compared with the D R diet. The lack of differences observed in the previous work may be because diets were offered ad libitum rather than as a restricted ration. While the present study shows improved performance with liquid feeding there was little difference between the water-to-feed ratios, suggesting the exact amount of water may not be critical in achieving better utilisation, a view supported by Yalda and Forbes (Reference Yalda and Forbes1996). The ADG of pigs offered FLF has been demonstrated to be approximately 13% higher than that found with NFLF (Jensen and Mikkelsen, Reference Jensen and Mikkelsen1998; Dung et al., 2005), and that pigs reared on liquid feed acidified with lactic acid perform similarly to those animals offered FLF (Geary et al., Reference Geary, Brooks, Beal and Campbell1999). Following the addition of lactic acid to the 1 : 3 R diet, there was little improvement in ADG or FCR, which is not surprising as the feed intake was similar between both groups.
Eating rate was considerably higher in the liquid-fed compared with the dry-fed R pigs, roughly doubling their DM intake and of similar values to those reported by others (Hsia and Lu, Reference Hsia and Lu1985; Miyawaki et al., Reference Miyawaki, Hoshina and Itoh1997). There were no further influences of the water : feed ratio as shown by others, which may be because the experimental diets offered were close to the range of optimum ratios (Miyawaki et al., Reference Miyawaki, Hoshina and Itoh1997). Faster eating rates suggesting a reduced level of energy expenditure may be necessary in order to deal with wet food, which the pigs tend to drink with little mastication prior to swallowing. Post swallowing, the indications are that the flow of digesta, particularly the liquid phase, is quicker (Castle and Castle, Reference Castle and Castle1957; Rayner and Miller, 1990) and presumably requires less energy to transport it along the gut, resulting in more energy being available for growth. A close correlation was observed between a higher eating rate and a live-weight gain, supporting the concept that liquid feed is more efficiently utilised for growth.
There is little evidence in the literature of changing responses to wet feed over time or weight range but Smith (Reference Smith1976) reported that between 30 and 45 kg live-weight liquid feeding made no difference to performance, but thereafter ADG and FCR were better. As seen in other production animals, FCR deteriorated progressively as live weight increased and the demand on nutrients for maintenance became a larger proportion of the energy intake. However, the animals on the 1 : 3 and 1 : 3(4) diets appeared to use their feed more efficiently throughout the growth period.
Backfat and LTGR were not significantly different between treatments, although in numerical terms pigs fed liquid diets, particularly on an ad libitum basis, had a slightly better LTGR. These findings are similar to those reported by others (e.g. Barber et al., Reference Barber, Braude and Mitchell1963; Kornegay and Vander Noot, Reference Kornegay and Vander Noot1968; Patterson, Reference Patterson1989a and Reference Patterson1989b; Murphy, 2002; Stotfold, 2005). It has been suggested that the increased LTGR observed following liquid feeding may be due to extra nutrients being partitioned towards protein deposition. This further indicates that one of the main advantages of liquid feeding may be the ability to overcome appetite limitations and to access the genetic potential of the pig to lay down muscle. Several studies have reported no differences in the killing-out percentage (Forbes and Walker, Reference Forbes and Walker1968; Kornegay and Vander Noot, Reference Kornegay and Vander Noot1968; Chae et al., Reference Chae, Han, Kim, Yang, Ohh and Rhee1997) and a similar scenario was observed between our UR groups. In contrast, the killing-out percentage was consistently lower in the pigs offered a restricted ration on the three liquid diets compared with D and is in accordance with observations by others (Patterson, Reference Patterson1989a and Reference Patterson1989b). Alterations in killing-out percentage is not a constant feature of liquid feeding and any differences may be simply attributed to the different feeding regimes producing differences in gut fill or fasting time prior to slaughter.
Conclusions
It is concluded that liquid feeding has a beneficial influence on pig performance of modern porcine genotypes during the growth/finishing phase, and this is further modulated by the water-to-feed ratio. The addition of lactic acid to the liquid feed can improve pig performance beyond that seen for liquid feeding alone. Liquid feeding ad libitum rather than as a restricted ration reduces ADG of finishing pigs while increasing FCR, thus offering little production advantages.