NOMENCLATURE
- ALTWPT
altitude at a given waypoint
- ATC
Air Traffic Control
- CCD
cruise/climb/descent
- CDA
continuous descent approach
- CO
carbon monoxide
- CO2
carbon dioxide
- DA
decision altitude
- EIHC
emissions index of hydrocarbon
- EICO
emissions index of carbon
- EINOx
emissions index of nitrogen oxide
- EMEP
European Monitoring and Evaluation Programme
- EEA
European Environment Agency
- FMS
Flight Management System
- HC
hydrocarbons
- IAP
instrument approach procedure
- IAS
indicated air speed
- ICAO
International Civil Aviation Organization
- LARCASE
Research Laboratory in Active Controls, Avionics and Aeroservoelasticity
- LTO
landing to take-off cycle
- MAP
missed approach point
- NOx
nitrogen oxides
- PDB
performance database
- TOC
top of climb
- TOD
top of descent
- TOGA
take-off go-around setting
- WPT
waypoint
1.0 INTRODUCTION
The aeronautical industry has set for itself fuel consumption pollution-related goals to reduce its pollution global share, currently estimated at 2% according to various aeronautical associations(1,2) . Some of the most important emissions are given by carbon dioxide (CO2) and nitrogen oxides (NOx). The CO2 emissions contribute to global warming and the NOx very likely damage the ozone layer. It has been estimated that the number of aircraft in service will increase in the next years, and therefore, the amounts of pollution related to aircraft are expected to increase. With more aircraft in service, even more air and noise pollution will be released near airports, due to aircraft take-offs and descents.
Airports are normally located close to population areas where it would be necessary to reduce noise and polluting emissions to further reduce negatively affecting the population and the environment. It is well known that air and noise pollution lead to respiratory, stress and other health problems(Reference Black, Black, Issarayangyun and Samuels3). The descent phase studies have, therefore, been of particular interest in the efforts to reduce air and noise pollution.
Flight crews can vary their approach procedures and flap selections to match the objectives of flight, which include fuel conservation and noise and emissions reductions. Decisions on the type of approach to be used varies for each airline and sometimes even for each flight.
An overview of aircraft trajectory management procedures to produce noise reduction is given in Reference Prats, Quevedo and PuigRef. 4. Noise produced by overflying aircraft was modelled using fuzzy logic as a function of the received noise level during the flight, the sensibility of the areas being over-flown and the aircraft departure time. A non-linear, multi-objective optimal control problem was solved to find the best trajectory for a given scenario, aircraft and time of the day. A practical example was given for the departure of an Airbus A340-600 to demonstrate how the methodology could help airspace designers and airport authorities to implement noise-reduction procedures.
The Continuous Descent Approach (CDA) is a promising operations procedure to reduce noise and fuel consumption. The CDA is a descent technique in which, instead of the conventional step descent that requires engine thrusts, a constant descent slope is followed, setting the aircraft engines to the IDLE mode, and thus, requiring very little thrust.
The Directorate of Operational Research and Analysis (DORA) measured the approach noise levels and observed the aircraft configurations and flight paths of some 700 Westerly approaches in 1976 and 1977 at London Heathrow airport(5). From that data, the average reductions in peak noise level resulting from use of the Low Power/Low Drag (LP/LD) and CDA procedures were estimated. This technique has been studied in a number of airports(Reference Clarke, Brooks, Nagle, Scacchioli, White and Liu6−Reference Kwok-On, Anthony and John11) and has produced both fuel and noise reductions.
Various parameters, such as the Top of Descent (TOD) location, weight and wind, are required to correctly execute the CDA. In Reference StellRef. 12, a number of 70 descents each in Boeing 757 and Airbus 319/320 aircraft were used to apply multiple regressions and estimated the TOD location as a linear function of the available predictive factors.
During the descent phase, many problems may appear that could lead to the landing procedure being aborted, in which case the so-called missed approach (go-around) procedure must be followed. Among the problems that can cause a landing procedure to be aborted are:
• Unexpected traffic in the runway: Aircraft that are unable to take off on time and are still on the runway, aircraft flying close to the runway, more rapid traffic overtaking the landing being performed, etc.
• Errors and misjudgments in the approach: Flying too high or too low on the final approach, flying too fast or too slow, overshooting the final approach start point, etc.
• Incorrect landing: Excessive bouncing at landing.
• Wind effects: A sudden change in the crosswinds, a wind direction or speed different than the expected wind direction and speed, problems with the automatic weather broadcast, etc.
• The cloud ceiling below the published minimum altitudes.
• Flight visibility below published instrument approach procedures’ minimums.
This procedure is expensive for airlines, as it normally requires high amounts of fuel. According to Boeing, the fuel required for a missed approach procedure can burn up to 28 times the fuel consumed during a normal landing procedure(Reference Roberson and Johns13). It is clear that executing this procedure increases the fuel requirements for a given flight, which would reduce profits to operators, such as airlines. Since the missed approach procedure is executed close to airports, the additional fuel requirements would release more air and noise pollution and generate noise, affecting population centres.
The missed approach procedure cost might represent a problem in the future, since it is likely that economic measures will be applied to airline operators that exceed certain pollution limits. There is not a direct, simple method to assess fuel consumption and emissions. A tool to assess the potential fuel savings and pollution reduction in avoiding the missed approach procedure is not available at this time. The motivation for this paper is to provide a cost-calculation methodology in terms of fuel and emissions that can justify the development of products and services, which would be implemented in low-computation devices such as the Flight Management System (FMS).
Given the importance of the missed approach computation problem, it is surprising that there are not more studies that address the missed approach cost computation, in addition to our LARCASE preliminary work for this paper(Reference Murrieta-Mendoza, Botez and Ford14) and the work developed by Dancila et al(Reference Dancila, Botez and Ford15).
There have been studies on optimising runways by maximising the number of landings per hour on a given runway, in which the number of missed approaches was used as a tool to minimise their costs(Reference Jeddi and Shortle16). Following those studies, a method to estimate the cost of missed approaches was not developed; instead, a constant value of $4000 was selected to approximate the missed approach cost.
Algorithms have been developed to optimise trajectories and reduce fuel consumption(Reference Félix-Patrón, Botez and Labour17−Reference Félix-Patrón, Schindler and Botez27), but these algorithms have only been applied for the cruise phase, the descent phase, or the climb – cruise – descent phase, without considering the missed approach procedure. Calculating the cost of a missed approach is needed in order to optimise aircraft trajectories and save fuel while following a given missed approach procedure.
Three methods to calculate aircraft emissions, including one method to calculate the fuel burn in any flight, were described in Ref. 28. However, these calculations were performed for entire flights and were not applied for specific landing approach procedures. These methods used information from the tables provided by the Emission Inventory Guidebook (EIG)(Reference Randt, Jessberger and Ploetner29−Reference Pham, Tang, Alam, Lokan and Abbass31). Other different tools have been developed to estimate noise and pollution released to the atmosphere. In Reference Randt, Jessberger and PloetnerRef. 29, a tool that computed fuel saving along with pollution reduction as a consequence from the development of new, more efficient aircraft was developed. Another method that focuses on fuel cost's effect on pollution and noise reduction was studied in Reference Murphy, Miller and SherryRef. 30. A real-time aviation emission inventory focusing on Australian airspace was developed in Reference Pham, Tang, Alam, Lokan and AbbassRef. 31. The missed approach was not considered in these methods(Reference Randt, Jessberger and Ploetner29−Reference Pham, Tang, Alam, Lokan and Abbass31).
The objective of this paper is to develop a rapid methodology that computes the fuel burn and the emissions related to fuel consumption, which justifies the development of products and services where the missed-approach prevention is of interest. The European Environment Agency (EEA) generates and updates an open source guide called the ‘EMEP/EEA Air Pollutant Emission Inventory Guidebook,’ which shows fuel consumption and emissions for various aircraft. Other methodologies to compute fuel burn exist, although they differ from the emissions inventory guidebook; such is the case with the Equations of Motions, widely used in the literature(Reference Soler-Arnedo, Hansen and Zou32), and Performance Database (PDB) methods(Reference Murrieta-Mendoza and Botez33,Reference Murrieta-Mendoza and Botez34) . These alternate methods are time consuming for the objectives of this paper. However, they could be used for the validation of our methodology. In addition, the work by Gleim(Reference Gleim and Gleim35) will be considered in the development of future methods.
The method described here calculates the fuel burn and the polluting emissions released to the atmosphere when a missed approach procedure is executed, as well as the fuel burn and the polluting emissions for a successful landing. These values are then added to the whole flight cost to compare the final cost of the missed approach procedure to that of a flight without a missed approach procedure. This method separates flights into two modes: the below-3000ft mode and the above-3000ft mode. When an aircraft is flying below 3000ft, the time flown in that mode is calculated; and when an aircraft is flying above 3000ft, the distance travelled is the calculated value. Once those two parameters have been obtained (time and distance), the total distance is interpolated using the data in the EIG to calculate the parameters of interest, such as the fuel consumed, nitric oxide produced, etc.
The new methodology described in this paper for the missed approach procedure was implemented using Microsoft Excel 2007, Visual Basic for Applications (VBA) and MATLAB.
2.0 METHODOLOGY
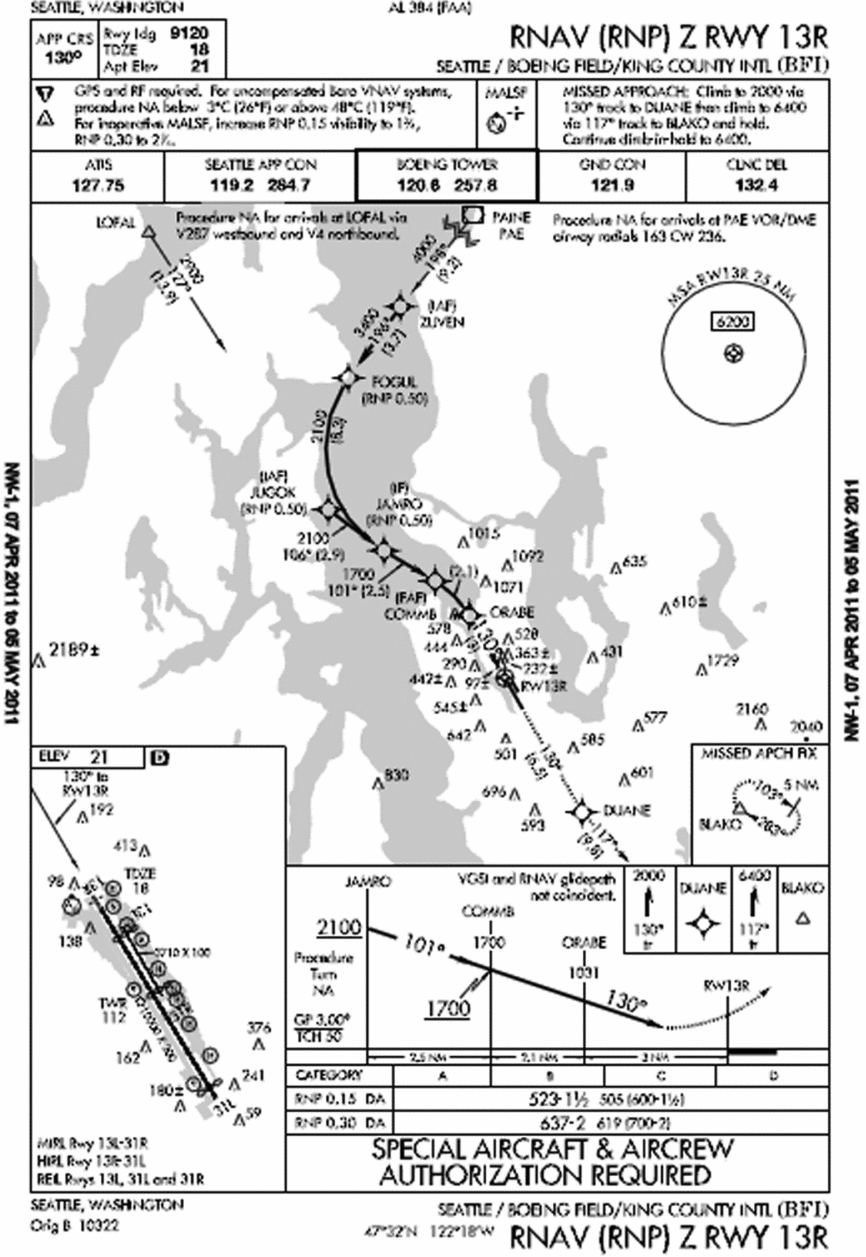
The methodology described here is used for two main modes: Climb/Cruise/Descent (CCD) and Landing to Take-Off (LTO). The landing procedure waypoints and the missed approach waypoints must be defined in order to utilise this methodology. The waypoints for a descent are published in the instrument approach procedure charts, which the pilot should be familiar with to carry out the selected landing sequence (see Fig. 1 for an example of an Instrument Approach Procedure (IAP) chart). Each waypoint must have the correct information: altitude, flight speed and distance between the current waypoint and the next. Weather influence is not taken into consideration in an IAP.
Instrument approach procedure chart for runway 13R of Boeing field in Seattle.

By definition, the CCD and the LTO modes are separated at the level of 3000ft in altitude. An aircraft is in the CCD mode when it is located at an altitude equal to or above 3000ft. If the aircraft is located at another waypoint below 3000ft, then it is in the LTO mode.
The procedure of a missed approach is the following: The aircraft starts to fly in the CCD mode at the initial waypoint (WPT) of the descent procedure found in the approach plan. It starts to descend, passing through all the WPTs in the CCD mode, eventually reaching 3000ft; below this altitude, the aircraft enters into the LTO mode and continues to descend until it reaches the point where the pilot must make a decision to either land or execute the missed approach procedure. This ‘decision point’ is considered to be the Missed Approach Point (MAP) for non-precision approaches or the Decision Altitude (DA) for precision approaches. If the pilot judges that a safe landing can be performed, the aircraft lands and the flight ends; otherwise, the missed approach procedure is executed from that point instead of landing. Air Traffic Control (ATC) can command a pilot to perform the missed approach procedure; in which case, new steps are followed to execute the missed approach procedure.
In the first missed approach procedure step, the pilot sets the engines to Take-Off Go-Around (TOGA), which means that the engines will be at their maximum power for the aircraft to gain altitude and arrive at the required altitude in accordance with the IAP. The aircraft will then follow different WPTs in the LTO mode with the engines in a normal operation mode. Eventually, the aircraft will come back to the CCD mode until it reaches a safe holding zone. Then, when traffic conditions allow it, ATC will assign the aircraft a return vector and the pilot will try to land again. The aircraft will follow this vector, which is normally within the limits of the CCD mode. Eventually, the aircraft will enter the LTO mode, again, to begin the landing approach. Figure 2 shows these procedures in a graphical form.
Successful approach and approach with a missed approach procedure.
2.1 CCD mode
In order to perform the required calculations in the CCD mode, the total distance travelled in this mode must first be determined. This can be accomplished by verifying all the consecutive WPTs of the defined trajectory and then calculating the CCD distance travelled. If two consecutive WPTs exist within the CCD mode limits, then the distance value is saved as an accumulative variable. This variable, which will eventually contain the total distance travelled in CCD mode, will be used to calculate the parameters of interest such as fuel burned, NOx, the Emissions Index of Nitrogen Oxide (EINOx), hydrocarbons (HC), the Emissions Index of Hydrocarbon (EIHC), carbon monoxide (CO) and the Emissions Index of Carbon Monoxide (EICO).
It is important to note that not all of the consecutive WPTs will be in the CCD mode – some points will be located in the LTO mode, a situation which will be explained later in Sections 2.2 and 2.3 of this paper. If all the WPTs are within the CCD limits, the total distance travelled in the CCD mode can also be expressed in the following way where dist is distance and it is expressed in nm:
 $$\begin{eqnarray}
{\rm{Total}}\;{\rm{Distanc}}{{\rm{e}}_{CCD}} = \ {\textit{WPT}_1}\;to\;{\textit{WPT}_2}\;{\rm{dist}} + {\textit{WPT}_2}\ to\ {\textit{WPT}_3}\;{\rm{dist}}\nonumber\\
&& +\, {\textit{WPT}_3}\ to\ {\textit{WPT}_4}\ {\rm{dist}} + \ldots
\end{eqnarray}$$
Depending on the total nautical miles travelled in this mode, an interpolation or an extrapolation of the distance may be needed. If the CCD distance is greater than 125nm, an interpolation of the distance in the tables provided by the EIG is required. This distance of 125nm was chosen as the lower limit because it is the smallest distance in CCD mode given in the EIG consumption tables.
Nevertheless, the distance travelled in the landing approach procedure in the CCD mode is usually less than 125nm. Since the EIG tables do not have values below 125nm, a vector must be created, for which the first distance is not 125nm, but 0nm, and the fuel consumption at 0nm is considered to be 0kg. This vector makes it possible to interpolate from 0nm to the maximal distance value available in the EIG tables for a specific aircraft. As an example, for the values of the distance and fuel consumption parameters of the Boeing 737-400, our vectors of distance and fuel are represented in the following two equations:
 $$\begin{equation}
{\rm{Distance}}\;\left( {nm} \right) = \ \left[{0\ \ 125\ \ \ 250\ \ \ 500\ \ \ 750\ \ \ 1000\ \ \ 1500\ \ \ 2000} \right]
\end{equation}$$
and
 $$\begin{eqnarray}
{\rm{Fuel}}\;{\rm{consumption}}\;\left( {{\rm{kg}}} \right) = \ \left[{0\ \ 777.7\ \ \ 1442.6\ \ 2787.4\ \ 4134.9\ \ \ 5477.2\ \ \ 8362.3\ \ \ 11342.2} \right]\nonumber\\
\end{eqnarray}$$
With these vectors, a polynomial of interpolation of a given order can be used to calculate the fuel consumption as a function of distance. In this paper, the polynomial of order 8 was selected because 8 was the lowest order where the real values were almost the same as the interpolated values. In Fig. 3, the polynomial function is traced versus the real data expressed by Equations (2) and (3). It can be seen that there is no error because the polynomial function superposes over the real data.
Polynomial interpolation function versus real data.
To find the values of polynomial coefficients for the fuel consumption as a function of the distance x, the Matlab function polyfit was applied. The resultant polynomial Fuel(x) for the Boeing 737-400 is shown below:
 $$\begin{eqnarray}
{\rm{Fuel}}\ \left( x \right) = {3.1721^{ - 18}}\ {x^7} - {1.9907^{ - 14}}\ {x^6} + \ {4.8834^{ - 11}}\ {x^5} - \ {5.9714^{ - 8}}\ {x^4} + \ {3.8605^{ - 5}}\ {x^3}\nonumber\\
&& - \; 0.0128\ {x^2} + \ 7.3288\ x + {0.613^{ - 11}}\
\end{eqnarray}$$
The fuel consumption dependency with the distance is obtained by solving the polynomial function expressed in Equation (4) for the distance x value; the fuel (kg) was, thus, calculated for the CCD mode. Polynomials of order 8 are found for each parameter of interest: Fuel, NOx, EINOx, HC, EIHC, CO and EICO. The polynomials created for the variation of these parameters with distance for the Boeing 737-400 are described by the following equations, where x is the distance expressed in nautical miles:
 $$\begin{eqnarray}
N{O_x}\ \left( x \right) & =& {1.8042^{ - 18}}\ {x^7} - {1.0821^{ - 15}}\ {x^6} + {2.5081^{ - 12}}\ {x^5} - {2.8556^{ - 9}}\ {x^4}\nonumber\\
&& +\; {1.6815^{ - 6}}\ {x^3} - {4.9689^{ - 4}}\ {x^2} + 0.1165\ x + {0.468^{ - 12}}
\end{eqnarray}$$
 $$\begin{eqnarray}
EINO\ \left( x \right) = {4.7816^{ - 19}}\ {x^7} - {2.9052^{ - 15}}\ {x^6} + {6.8835^{ - 12}}\ {x^5} - {8.1352^{ - 9}}\ {x^4}\nonumber\\
&& +\; {5.0878^{ - 6}}\ {x^3} - {1.6361^{ - 3}}\ {x^2} + 0.236\ x + {1.3256^{ - 11}}
\end{eqnarray}$$
 $$\begin{eqnarray}
HC\ \left( x \right) = - {1.7991^{ - 18}}\ {x^7} + {1.011^{ - 14}}\ {x^6} - {2.1141^{ - 11}}\ {x^5} + {1.9988^{ - 9}}\ {x^4} - {7.4545^{ - 6}}\ {x^3}\nonumber\\
&& -\; {6.1818^{ - 4}}\ {x^2} + 1.3658\ x - {3.5121^{ - 11}}
\end{eqnarray}$$
 $$\begin{eqnarray}
EIHC\ \left( x \right) = {4.6595^{ - 21}}\ {x^7} - {2.9178^{ - 17}}\ {x^6} + {7.2031^{ - 14}}\ {x^5} - {9.0009^{ - 11}}\ {x^4}\nonumber\\
&& +\; {6.0685^{ - 8}}\ {x^3} - {2.153^{ - 5}}\ {x^2} + {3.4222^{ - 3}}\ x - {1.4542^{ - 13}}
\end{eqnarray}$$
 $$\begin{eqnarray}
CO\ \left( x \right) = - {2.3525^{ - 17}}\ {x^7} + {1.3095^{ - 13}}\ {x^6} - {2.694^{ - 10}}\ {x^5} + {2.4633^{ - 7}}\ {x^4}\nonumber\\
&& -\; {8.2008^{ - 5}}\ {x^3} - {1.6059^{ - 2}}\ {x^2} + 22.2419\ x - {4.3744^{ - 10}}
\end{eqnarray}$$
 $$\begin{eqnarray}
EICO\ \left( x \right) = {8.2757^{ - 20}}\ {x^7} - {5.1359^{ - 16}}\ {x^6} + {1.2541^{ - 12}}\ {x^5} - {1.5476^{ - 9}}\ {x^4}\nonumber\\
&& +\, {1.0291^{ - 6}}\ {x^3} - {3.5973^{ - 4}}\ {x^2} + {5.6498^{ - 2}}\ x + {2.5003^{ - 12}}
\end{eqnarray}$$
2.2 LTO mode
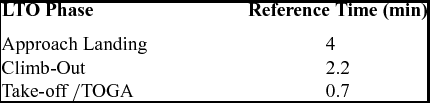
Three different phases can be identified in the LTO mode: Approach Landing, Climb-Out and TOGA. All these phases occur during a missed approach procedure. According to the International Civil Aviation Organization (ICAO), the three phases of an LTO mode have fixed reference times, given in Table 1. These reference times are provided in the EIG, in the FAA Advisory Circular 34-1B and in the ICAO 2013 Environmental Report, among others.
ICAO reference times

Manufacturer data tables provide information to better estimate the ICAO reference times, including details such as the ‘horizontal travelled distance,’ the ‘time’ for a given altitude gain, ‘recommended True Air Speed (TAS),’ ‘fuel flow,’ etc. However, in order to keep the generality of the generic method developed in this paper, the ICAO reference times are used here.
In order to identify in which phase an aircraft is located between two WPTs, the following definitions of these phases must be considered:
• Approach Landing: The WPT (n – 1) is at the same or higher altitude than the WPT (n).
• Climb-Out: The WPT (n – 1) is at a lower altitude than the WPT (n).
• TOGA: At the DA, the pilot determines if the landing procedure should be aborted; therefore, the missed approach procedure should start.
In a successful approach, where no missed approach procedure is executed, the approach landing phase is the only phase considered for the LTO calculation, since in a successful landing, the aircraft is not supposed to climb or to perform a TOGA. If an aircraft needs to climb, that indicates that either the aircraft is leaving airport A on its way to airport B or that the aircraft is performing a missed approach procedure.
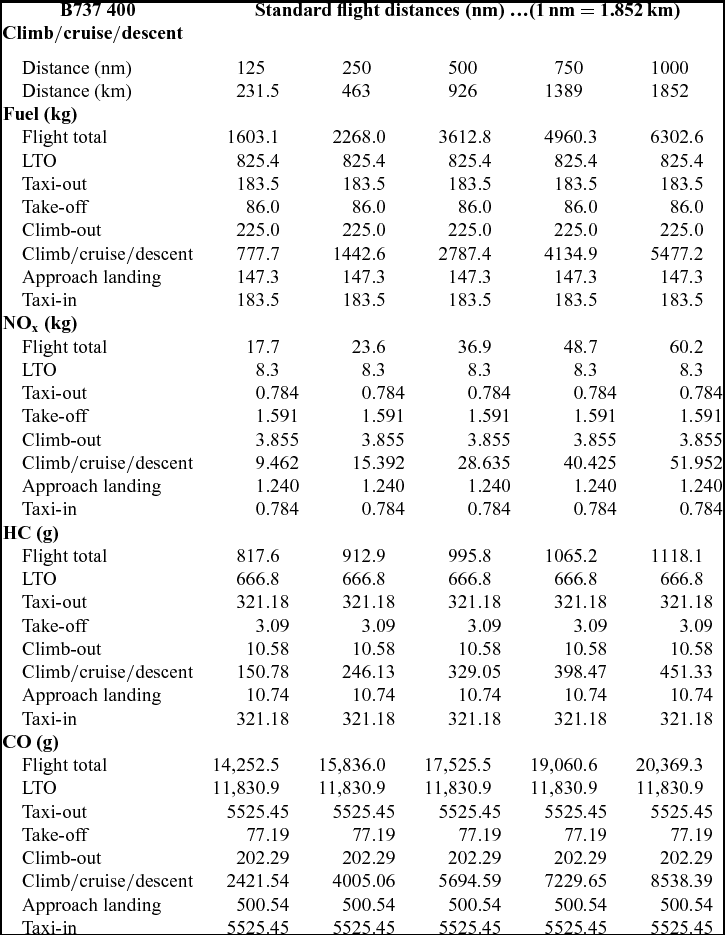
After the LTO mode has been determined, the time travelled is calculated using the speed of the aircraft and the distance between WPTs. This time is saved as an independent accumulation variable for two LTO phases: approach landing and climb-out. The Take-off/TOGA time value is always considered to be 0.7min, since in this acceleration phase, it is complicated to determine the exact speed of the aircraft. The time saved in the accumulation variables is multiplied by the parameter of interest per minute, determined from the tables using the ICAO reference times given in Table 1, thereby, providing the fuel consumption. It is important to note that the EIG tables have different parameters, such as fuel burnt, NOx, HC, CO, etc., and these calculations apply to all of them. One type of EIG table is shown in Table 2 for the Boeing 737-400.
Reduced EIG table for the Boeing 737-400
As an example, the quantity of fuel burnt in an approach landing phase of 6min is calculated as follows: In accordance with Table 1, the reference time for an approach landing phase is 4min. Looking at Table 2, regardless of the flight distance, the fuel burnt during the approach landing phase is 147.3kg for this particular aircraft. By dividing 147.3kg by 4min, it appears that the aircraft burns 36.825kg of fuel per minute during this phase. Thus, the quantity of fuel burnt in 6min during the approach landing phase can be found by multiplying the quantity of fuel burnt times the total time in this phase, or 6min times 36.825kg/min, for a total of 220.95kg.
2.3 Crossover calculations
It is important to note that the crossover concept does not refer to the typical IAS/Mach speed change due to the altitude, in which the pilot has to change the speed reference from IAS to Mach. The crossover in this paper refers to the changes in the 3000ft threshold that separates the LTO mode from the CCD mode. During the missed approach, at least three crossover situations are referred to:
• The zone below 3000ft where descent is performed prior to landing;
• Climb-out over 3000ft after the abortion of the landing procedure at the MAP (or DA) to wait in the holding pattern for a returning vector to land; and
• Descent, again, below 3000ft, in order to land after coming back from the holding pattern.
• It is important to separate the CCD and the LTO modes during all crossover situations, as in those described above.
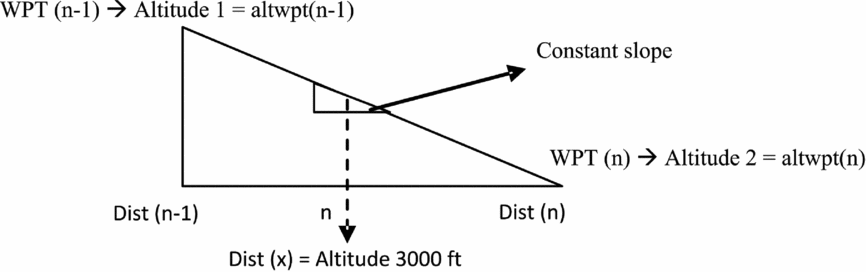
A constant slope is considered in the descending or ascending path followed during the crossover situation. When the aircraft is at the initial distance, Dist (n – 1), it is at the WPT (n – 1) at altitude altwpt (n – 1). At the final distance, Dist (n), the aircraft is at the WPT (n) at the altitude altwpt (n). Figure 4 shows the variation of the altitude with the distance while descending.
Altitude variation with distance.
 $$\begin{eqnarray}
{\rm{Distance}}\;{\rm{to}}\;{\rm{reach}}\;3000\;ft = \frac{{\left( {3000ft - altwpt\left( n \right)} \right)\left( {altwpt\left( {n - 1} \right) - altwpt\left( n \right)} \right)}}{{{\rm{distance}}\;{\rm{between}}\;wpts}}\nonumber\\
\end{eqnarray}$$
The number of nautical miles (nm) needed to travel from the current altitude (altwpt (n – 1)) at the WPT (n – 1) to arrive at the crossover altitude in the LTO or CCD mode is determined using Equation (11). If the aircraft is descending, the distance (nm) is found in the CCD mode; if the aircraft is in the climbing-out stage, the distance (nm) is found in the LTO mode. Equation (11) is valid only when the WPT (n) altitude is lower than the WPT (n – 1) altitude. A similar equation is used when the WPT (n) is higher than the altitude of WPT (n – 1).
2.4 Full flight cost calculation
A hypothetical full flight distance, from the end of the LTO mode during take-off from Airport A to the first waypoint of the landing approach procedure at Airport B, is considered in order to calculate a missed approach's additional cost, with respect to the entire flight's cost. Using the distance of the hypothetical full-flight route, the polynomials in Reference Prats, Quevedo and Puigequations (4)–Reference De Lépinay, Dimitriu and Melrose(10) can be solved for this particular case to find the parameter(s) of interest.
To calculate the LTO modes during take-off, the values of interest contained in the EIG tables and shown above in Table 2 are taken directly from these tables, assuming the standard reference times given by ICAO and shown above in Table 1. The take-off and climb-out phases are accounted for, and it is assumed that the fuel and emissions values in the EIG are the values of this LTO mode.
Once the distance of the full flight route cost has been determined and the LTO cost obtained, these costs are added together to obtain the full flight cost for each parameter of interest.
Note that the approach landing phase in the take-off section is assumed to be equal to zero. This value is zero because when the aircraft is leaving an airport, it is not supposed to descend at all, as that would mean the aircraft is arriving at the airport instead of leaving it.
In the CCD mode, three different flight phases are combined into one phase: climb, cruise and descent. In a normal flight, more fuel is spent during the climb phase than in cruise mode; and in cruise mode, more fuel is spent than in descent. The method presented here does not take into account the differences between these varying levels of consumption and assumes that all three phases considered in the CCD mode comprise one big phase that is only a function of distance. These differences are not considered here because of the lack of that type of detailed data in the literature.
2.5 Final calculations
The next step consists of carrying out the calculation presented above. The costs for a missed landing approach and for a successful landing approach are generated. Next, each is added to the full flight costs and the cost difference between these two situations is calculated. The two flights thus evaluated are: 1) full flight with a missed landing approach followed by a successful landing and 2) full flight with a successful landing.
3.0 RESULTS
The results shown here are obtained for the flight plan cost of a short flight with a successful first-attempt landing and the same short flight with a missed approach procedure followed by a successful landing. The short flight distance from take-off to the first approach plate waypoint is 650nm. The standard atmospheric conditions are considered.
3.1 The landing and missed approach procedure
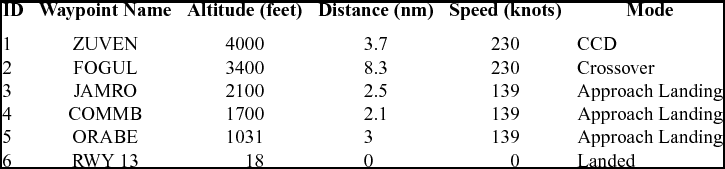
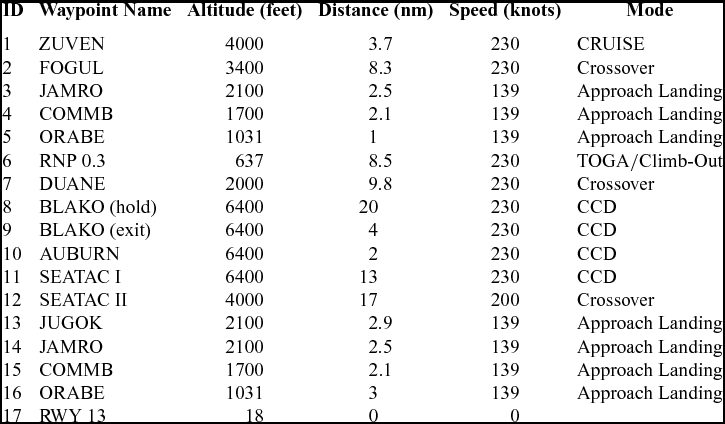
The landing approach simulated, as proposed by our industrial partner, is shown in Fig. 1. Table 3 shows the waypoints to be followed for a successful landing and Table 4 is the flight plan (waypoints) for a landing with a missed approach procedure followed by a successful landing. Altitudes are expressed in Mean Sea Level (MSL). In these tables, the ID refers to the sequence on which the waypoint was visited, the waypoint name is the name provided to that waypoint, altitude is the altitude at which the waypoint should be fly-by, the distance refers to the distance to the next waypoint, speed refers to the speed at which the aircraft should fly from the given waypoint, and mode shows the flight mode of considered for that waypoint. Note that RWY refers to runway.
Flight plan for a conventional landing
Flight plan for a landing with a missed approach
The increased complexity of the flight plan in Table 4 compared to that of Table 3 is obvious; the number of waypoints to be followed by the aircraft to execute the missed approach procedure increased substantially. It is interesting to observe that during the execution of a successful landing sequence (Table 3), the aircraft does not perform any climb. Table 4 is much more complex. The missed approach procedure is expressed following the WPTs ID 5: ‘RNP 0.3’ to ID 17 ‘RWY 13.’ Point ID 8 is the safe holding cruise (four turns were executed); this is the place where the aircraft waits for a return vector (a trajectory to intercept one of the points of the IAP) from ATC. Once the returning vector is provided, the waypoint that shows the exit from the holding zone is WPY ID 9: ‘BLAKO (exit).’ WPYs ID 10: ‘AUBURN’ to ID 12: ‘SEATACII’ represent the returning vector. WPT ID 13: ‘JUGOK’ is the interception of the IAP flight plan. Note that WPTs ID 14: ‘JAMRO’ to ID 17: ‘RWY 13’ in Table 4 coincides with waypoints ID 3: ‘JAMRO’ to ID 6: ‘RWY13’ in Table 3.
3.2 Fuel burned and emissions comparison between a conventional landing and a landing after a missed approach
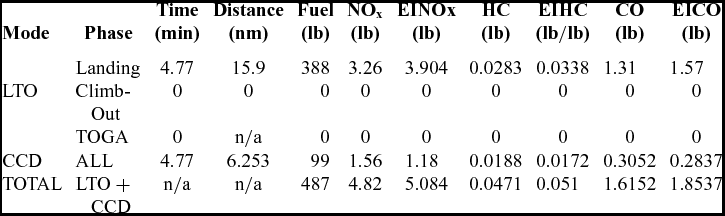
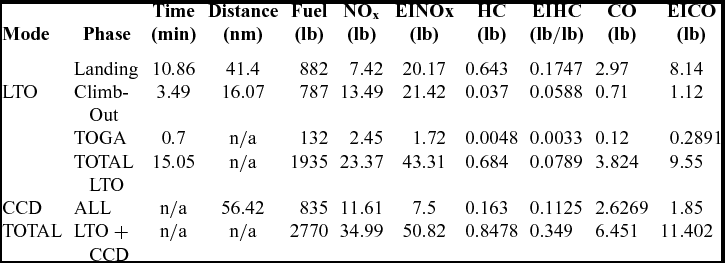
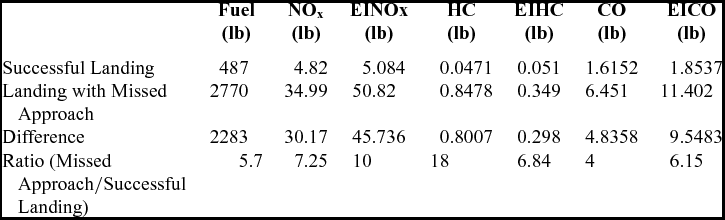
The first sets of results in Tables 5 and 6 present a successful landing procedure following the flight plan in Table 3. The second sets of results show a missed approach procedure followed by a successful landing; these follow the flight plan in Table 4. The comparison between the two different landing sequences is presented in Table 7.
Successful landing outputs (no-missed approach)
Approach + missed approach + successful landing outputs
Comparison between a successful approach, and an approach with a missed approach followed by a successful landing
In Tables 5 and 6, some values are not available and are indicated with ‘n/a.’ These values were impossible to compute due to the lack of information. For example, in the LTO mode for the phase TOGA, in Table 5 (row 4, column 4), the speeds for the TOGA during the flight time of 0.7sec are not known; therefore, it was impossible to calculate the distance in nm. In the CCD mode of Table 6, the flight time was not calculated (row 6, column 4) because the cruise speed is unknown; however, it was possible to calculate fuel consumption because this phase is a function of distance.
During the execution of a successful landing without a missed approach in Table 5, as expected, there were neither climb-outs nor TOGA flight phases because the aircraft should always be descending. However, in Table 6, the crew needs to climb-out to execute the missed approach procedure. Table 7 is a comparison of landings with and without a missed approach procedure.
The missed approach burns 5.7 times more fuel than a successful approach. The extra fuel burned augments the contaminant emissions of CO2, NOx, HC, EINOx, EIHC and EICO. This difference can be explained in terms of the existence of a TOGA and a climb-out phase during the missed approach procedure in Table 6. Both flight phases consume a great quantity of fuel, especially while flying at low altitudes. Flying a cruise phase at low altitude was also required. This small cruise phase was given by ATC in the form of a vector to intercept the landing path to the runway after the missed approach.
Because the landing is rigidly defined by the IAP, the only opportunity to reduce the fuel consumed by the procedure has to come from ATC delivering friendly (and timely) intercepting vectors, and/or by developing speed controllers to efficiently manage speed to demand the least possible thrust.
3.3 Fuel burned and emissions generated by the missed approach in a complete flight
The second sets of results show the impact of the missed approach in a whole flight. The flight distance selected for this study was 650nm from the take-off point to the beginning of the landing approach. This flight distance was chosen because it is close to the flight distances between cities in Europe such as Paris - Madrid and Paris – Rome, and flights such as New York – Atlanta, and Chicago to Dallas in the United States.
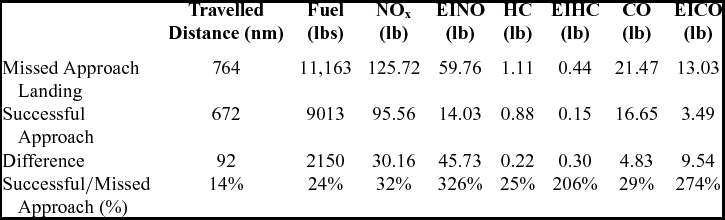
Table 8 shows the difference between the complete flight with a successful landing approach and a complete flight with a missed approach procedure. As expected, the flight with a missed approach travels more distance and burns 24% more fuel. Evidently, increments in the emission amounts are also registered. This is clear, with the increase in the distance and flight time of the complete flight. Similar types of results are obtained for the NOx, HC and CO parameters. The results become especially noteworthy for the high percentage differences in the EINOx, EIHC and EICO emissions, which are sensitive at the LTO.
Difference in consumption/emissions between a full flight with a successful approach and a full flight a with a missed approach procedure
The variations of the EIHC emissions with distance are shown in Fig. 5 for different flight distances. It can be seen that the LTO mode influences a successful landing – following ICAO times in three different phases can be identified in the LTO mode: Approach Landing, Climb-Out and TOGA. All these phases occur during a missed approach procedure. According to the International Civil Aviation Organization (ICAO), the three phases of an LTO mode have fixed reference times, given in Table 1. These reference times are provided in the EIG, in the FAA Advisory Circular 34-1B and in the ICAO 2013 Environmental Report, among others.
EIHC variation with distance.
Table 1, on the total EIHC emissions, adds a constant off-set to the CCD, regardless the flight distance. This off-set is because the LTO mode is a function of time and not a function of distance. If the time spent in the LTO phase in the CCD mode and the LTO mode are compared (as in the results in Tables 5 and 6), it is clear that more time is spent in the missed approach than in the successful approach. This is the main reason for the high percentage values of EINOx, EIHC and EICO in the LTO phase in Table 9.
Figure 5 was created with data obtained directly from the EIG data tables. It shows the outputs obtained for the LTO for the take-off, climb-out and landing approaches. Taxi-in and taxi-out are omitted because these modes do not appear during the aircraft flight and they have a constant value, i.e. they are the same for any successful landing, whether the missed approach procedure is executed. EINOx and EICO have the same behaviour.
4.0 CONCLUSIONS
A method was developed to estimate related polluting emissions using open-source data (developed by an important European Agency) when a missed approach procedure is initiated. This method is especially useful to rapidly measure the related emissions.
It is clear that missing an approach is expensive in terms of time and fuel for an airline, and that the extra emissions released to the environment are high – 4.83lbs of CO (Table 5, row 4, column 8) for one particular flight (to specify just one emission). In the hypothetical case developed above, executing the missed approach costs 5.7 times more fuel (Table 7, row 5, column 2) than carrying out the successful approach, and this cost is only expressed in terms of fuel. If the Cost Index (determines the flight time cost) is taken into account, due to the number of extra hours flown and the extra fuel burnt, the total cost in dollars is even higher.
It has been observed that the missed approach cost is highly dependent on the vector provided by ATC to get out of the holding pattern and to intercept the landing approach after the missed approach procedure; therefore, attention must be focused on the ATC procedures to help ATC provide aircraft the shortest possible return vectors, and to avoid requesting an aircraft to gain more altitude than necessary.
5.0 FUTURE WORK
In the CCD mode, the climb, cruise and descent costs are calculated for multiple parameters, such as fuel, CO, HC, etc., that are only given as one phase, which is only a function of the horizontal distance travelled. In reality, the cruise phase is the only phase that is dependent on the horizontal travelled distance (if flying at constant altitude), while climb and descent costs are not dependent on the flight distance, but on the targeted altitude. Therefore, how these calculations are done will have to be changed to differentiate between the costs of these three phases.
A different solution could consist of taking flight test data and statistically determining a percentage of the amount of fuel spent for each flight phase. In this way, the CCD data from the EIC tables could be separated for the three different CCD phases. These calculations would only be appropriate for the fuel consumption; however, a deeper analysis of the emissions graphs must be done to determine if, by evaluating the fuel spent, the values of the emissions could be found in each phase (climb, cruise and descent).
Another problem that was identified was the degree of the polynomial. If this method is to be implemented in an FMS, then the computation time for solving or/and finding the polynomial coefficients may be too high for this application to be practical.
Weather values have not been taken into account, but wind can have a strong influence on a flight, especially at low altitudes. Implementing the effect of the wind will change the fuel spent by the aircraft, as well as the time required to perform the landing procedure, including the time for a missed approach procedure, and therefore, the values of the above parameters.
ACKNOWLEDGEMENTS
This Research was conducted in The Research Laboratory in Active Controls, Avionics and Aeroservoelasticity (LARCASE) for the global project ‘Optimized Descent and Cruise’, with funds from the Business-led Network of Centers of Excellence, Green Aviation Research & Development Network (GARDN). For more information, please visit http://larcase.etsmtl.ca. The authors would like to thank Mr. Rex Haygate and Steven Ford, from CMC-Electronics – Esterline, and Oscar Carranza from LARCASE. The authors would like to thank CONACYT and the FQRNT.