INTRODUCTION
A comprehensive understanding of the temporal variability of soil fertility parameters is becoming increasingly important in agricultural science and production. Such understanding improves site-specific nutrient recommendations and large-scale environmental monitoring aimed at increasing crop production, while minimizing negative environmental effects (Pierce & Nowak Reference Pierce and Nowak1999). Soil organic carbon (SOC) is a key determinant of improving soil quality, thus any system of sustainable agriculture must aim at maintaining or increasing the SOC content.
Researchers have studied carbon (C) and nitrogen (N) dynamics at both the global and regional scales, concentrating on the change, cumulative rate and sequestration potential related to land use and conservation tillage (Freibauer et al. Reference Freibauer, Rounsevell, Smith and Verhagend2004; Hu et al. Reference Hu, Zeng, Fan, Chen, Zhao and Pepper2008). Unfortunately, there is a lack of consensus about the nature of change to soil quality in agricultural systems over time. As SOC content may be influenced by improved agricultural management, including measures such as reduced tillage, improved fertilizer management and irrigation (Follett Reference Follett2001; Entry et al. Reference Entry, Sojka and Shewmaker2002; Fortuna et al. Reference Fortuna, Harwood, Kizilkaya and Paul2003). For instance, Nel et al. (Reference Nel, Barnard, Steynberg, De Beer and Groeneveld1996) found a 50% decrease in soil organic matter (SOM) after 50 years of cropping in Pretoria, (South Africa) and Lobe et al. (Reference Lobe, Ameldung and Du Preez2001) recorded the same decline in SOM after only 3·5 years of cultivation in the Free State (South Africa). However, different studies carried out in South Africa have shown the possibility of reversing SOM losses through changes in management strategies (Du Preez & Wiltshire Reference Du Preez and Wiltshire1997). Furthermore, the complexity of a dynamic soil environment is another factor often contributing to the problem of extrapolating information from one soil or site to another (Peterson & Hammer Reference Peterson and Hammer1986). Differences in the spatial position of areas where the same management practices are applied also lead to differences in C sequestration due to the variation of soil properties. When all other factors remain the same, soils with high SOC concentration have more agronomic/biomass productivity than those with low SOC concentration (Sandhu et al. Reference Sandhu, Benbi and Prihar1996).
As previously reported, the biological and biochemical properties are related to soil organisms involved in energy flow and nutrient cycles (Plaza et al. Reference Plaza, Hernandez, Garcia-Gil and Polo2004). These can respond to small changes in chemical and physical soil properties, thereby providing sensitive information on changes in soil quality (Pascual et al. Reference Pascual, Garcia, Hernandez, Moreno and Ros2000). Understanding the response of soil microbiota to agricultural management over time may help to evaluate whether the practices maintain and improve soil quality.
At present, Xinjiang has become the largest producer of cotton in China. As the cultivation area (c. 1·89×103 ha of cotton field have been reclaimed during the past 8 years in the study region) and plantation age (in some areas 20 years and above) increases, monoculture cotton cultivation is increasingly being practiced. However, the effects of such a system on soil chemical and microbial properties are not known for long-term cultivation. Therefore, the objective of the present study was to (i) assess the variability of soil C, N and microbiological properties across an age sequence of cotton plantations on fine grey desert soil, (ii) estimate C pool dynamics using different fields with different durations of repeated cotton planting and (iii) evaluate the potential of management practice from residue removal to residue retention.
MATERIALS AND METHODS
Description of study area
The current paper presents a case study of 250 samples (85°52′–86°10′E, 44°52′–45°12′N), located in the south western part of the Junggar Basin in China. The northern extent of the study area is close to the Gurbantunggut Desert and the south is bordered by the alluvial–fluvial plain of the lower reaches of the Manas River. With a typical temperate continental, arid and semi-arid climate, the study area is characterized by abundant sunshine, low rainfall (109 mm), high potential evaporation (2500 mm) and a wide temperature range, which permits high quality and high yield of cotton. There is almost no runoff and underground water tables are very deep (>20 m). Access to irrigation water is a critical element in meeting the agricultural water demand in this region. Drip irrigation may allow more crops to be grown per unit of water; therefore the introduction of drip irrigation after 1996 in the Manas River Valley has provided the means to boost land reclamation and expand cultivation, such that all of these lands are now planted with cotton.
In the study area, continuous cotton (summer cotton–winter fallow–summer cotton) sown after conventional tillage (disc-ploughing) has been practiced since 1960. Cotton seeds (Gossypium hirsutum L.) are usually planted in mid-April and harvesting begins at the end of September and finishes at the end of October. Farmyard manure or compost was the major sources of soil nutrients before the 1980s but since then, the organic fertilizers have gradually been replaced by synthetic fertilizers. The application amounts of mineral N fertilizer have increased from 190 kg N/ha in 1985 to 370 kg N/ha in 2005. Approximately a quarter of the N is incorporated into the soil before planting, and the remainder is applied after first flowering. Due to the development of tillage equipment, all post-harvest residues since 1996 have been incorporated by ploughing (incorporation of cotton stalks to 200 mm, with chisel ploughing to 300 mm) at the end of November. It has been estimated that 6000–7500 kg/ha cotton residues are returned to the fields each year (Zheng et al. Reference Zheng, Lai, Deng and Dai2000).
Selection of the study area
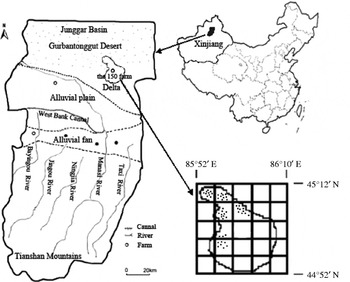
The present study examined 40 farmers’ fields in the delta of the Manas River Valley (Fig. 1). The space for time substitution method was used (Pickett Reference Pickett and Likens1989), and farmlands reclaimed from uncultivated land 0, 5, 10, 15 and 20 years ago were chosen. Ten farms of each age category were selected. In addition, 10 non-cultivated sites in the vicinity of the planted sites were selected to provide base year or control sites (0 year). The area of each plantation was 10–15 ha; the vegetation prior to cultivation consisted mainly of colonies of perennial halophytic weeds and the dominant tree is Tamarix chinensis Lour. (salt cedar) (ISTXJIBCAS 1978). After reclamation, the farmland vegetation was completely domestic, all original native vegetation had disappeared (only remaining outside the farmland areas) and weeds had been removed during crop management. The grey desert soil (Soil Survey Team of Manas County 1992) ranges from loam in areas under cotton cultivation, where long-term fertilization has been practiced, to sandy loam in non-cultivated sites. The same agricultural management practices were used to plant the cotton in each reclaimed field.
Sketch map of the Manas River Valley and study region.

Soil samples were collected in March 2007 and 2008. At each site, soil samples at five depths (0–200, 200–400, 400–600, 600–800 and 800–1000 mm) were collected from five sampling points. The samples at the depth of 0–200 mm were taken with a shovel, and those at >200 mm were taken with a 50 mm diameter soil auger. Half of the each sample was air dried and stored at room temperature for analysis of SOC, total soil N (TSN) and soil available N (SAN), and the other half was stored at 4°C for not more than 1 week before determination of soil microbial biomass carbon (SMBC), soil microbial biomass nitrogen (SMBN), and activities of urease, invertase and cellulose (details below). Soil bulk density was determined using a 50 mm diameter steel core sampling tube taken at the five soil depths at each sampling point, manually driven into the soil.
Soil test
The soil cores were weighed wet, dried at 105°C for 48 h, and weighed again to determine gravimetric soil water content and bulk density. The same cores, kept intact, were saturated with water and then placed on a porous ceramic plate in a pressure chamber and subjected to pressures of 30 kPa. Gravimetric water content of the soil was measured after 24 h of equilibration, representing the maximum water-holding capacity (Soil Science Society of China 2000).
The analytical methods of Bao (Reference Bao2002) were used, including SOC using the dichromate oxidation method, TSN using the Kjeldahl method and SAN using the alkaline hydrolysis diffusion method.
Cellulase activity was determined by estimating the glucose equivalent after mixing the soil sample (10 g) with 15 ml of acetate buffer (2 m, pH 5·5) and 15 ml of 7 g/l carboxy methyl cellulose and incubating for 24 h at 50±1°C (Schinner & von Mersi Reference Schinner and von Mersi1990). The glucose equivalent was estimated following the dinitrosalicylic acid (DNS) method (Miller Reference Miller1959). Invertase activity was determined with 35·06 mm saccharose as substrate, incubating for 3 h with 2 m acetate buffer (pH 5·5), and the released reducing sugars were determined following the method of Schinner & von Mersi (Reference Schinner and von Mersi1990). Urease activity was determined by incubating 100 mg of soil at 37°C with 50 μl of 720 mm urea and 400 μl of 0·1 m borate buffer at pH 10 (Schinner et al. Reference Schinner, Öhlinger, Kandeler and Margesin1996). The NH4+ released was extracted with 3 ml of 2 m KCl and determined colorimetrically using a modified Berthelot reaction.
SMBC and SMBN were estimated by the chloroform fumigation–incubation method (Jenkinson & Powlson Reference Jenkinson and Powlson1976) with the following modifications: soil (25 g fresh weight) was weighed into glass scintillation vials, which were placed in a desiccator with a wet paper towel, a 50 ml beaker containing 40 ml of ethanol-free chloroform and a few glass beads. The desiccator was evacuated and the soil exposed to chloroform vapours for 24 h. After fumigation, inoculum was added and the soil was adjusted to about 550 g/kg water holding capacity. Then, the soil was incubated in darkness at 25°C for 10 days, in the presence of 10 ml 1 m NaOH. The CO2–C trapped in the alkali was determined by titration. After CO2 sampling, NH4+–N was extracted with 100 ml 2 m KCl and quantified by steam distillation (Soil Science Society of China 2000).
Calculating methods of SOC and TSN density
SOC density, a significant index to SOC, refers to the content of SOC in a fixed horizon per unit area. For a single horizon, SOC density was calculated by the following expression (Post et al. Reference Post, Emanuel, Zinke and Stangenberger1982; Rodriguez-Murillo Reference Rodriguez-Murillo2001):

where SOC densityj is SOC density (kg/m2), SOCj is SOC content (g/kg), β j is bulk density (g/cm3) and H j is depth (mm), each in the j horizon.
SOC density in the profile is summarized from the data for the soil horizons on a 1 m2 basis to a 1 m depth (Pouyat et al. Reference Pouyat, Yesilonis and Nowak2006):

where SOC densityt represents SOC density in soil profile and k is the number of pedogenic horizons in profile.
Statistical analysis
All results are reported as means±standard errors. All the data were analysed by two-way ANOVA test with plantation age and depth as fixed factors. Responses of soil chemical and microbiological properties of each depth to age were also evaluated by quadratic regression and one-way ANOVA was carried out to test the fit of the data to the quadratic regression model. All statistical analyses were performed using the SPSS software package (SPSS 2001). Differences at P<0·05 were considered as statistically significant.
RESULTS
Soil bulk density and water-holding capacity
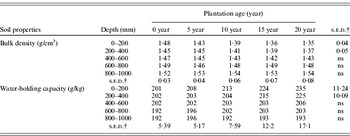
Significant linear changes in soil bulk density and water-holding capacity with age were found in the 0–400 mm layer, but no significant difference was found for soil bulk density and water-holding capacity in the 400–1000 mm layer at different plantation ages (Table 1). In the upper 0–400 mm layer, soil bulk density decreased, and water-holding capacity increased significantly with increasing stand age.
Soil bulk density and water-holding capacity with increased plantation age (non-cultivated soil (0 year) as control) *

ns=not significant.
* Degree of freedom (d.f.) = 45.
† Standard error of difference (s.e.d.) between means for each depth interval and ages.
At the depth of 0–200 mm, the bulk density decreased from 1·48 g/ml in non-cultivated sandy soil to 1·35 g/ml in 20-year plantation site, and water-holding capacity increased from 201 g/kg at the control site to 235 g/kg at the 20-year site.
SOC and TSN
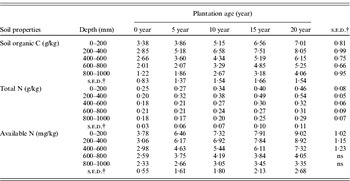
Significant differences were also found for SOC and TSN changes with age in the 0–1000 mm layer and SAN in the 0–600 mm layer, but no significant difference was found for SAN in the 600–1000 mm layer at different plantation ages (Table 2). At all sites, the increase in SOC and TSN was most evident in the 200–400 mm layer. A consistent decrease in SOC and TSN with increasing depth was also found in the 600–1000 mm layer. The SOC and TSN in the 200–400 mm soil layer at 5-, 10-, 15- and 20-year sites increased by factors of 1·8, 2·3, 2·6 and 2·8 and 1·6, 1·9, 2·4 and 2·7, respectively, compared to those in the control site (0 year).
Soil organic C and total N with increased plantation age*
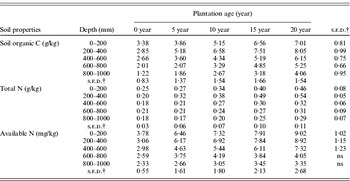
ns=not significant.
* Degree of freedom (d.f.) = 45.
† Standard error of difference (s.e.d.) between means for each depth interval.
Soil enzyme activities
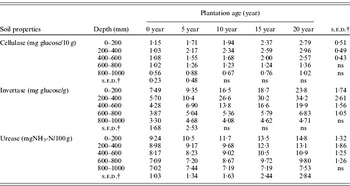
Significant changes with age were also found for cellulase activity in the 0–600 mm layer, and for urease and invertase activities in the 0–800 mm layer. No significant difference was found for cellulase activity in the 600–1000 mm layer or urease and invertase activities in the 800–1000 mm layer at different plantation ages (Table 3). At all sites, compared to those in the surface soil (0–200 mm), the increase in soil cellulase and invertase activities were most evident in the 200–400 mm layer, whereas a consistent decrease with increasing depth was also found in the sub-soil (400–1000 mm). The cellulase and invertase activities in the 200–400 mm soil layer at the 5-, 10-, 15- and 20-year sites increased by factors of 2·1, 2·3, 2·5 and 2·9 and 1·8, 4·7, 5·3 and 6·0, respectively, compared to those in the control site (0 year non-cultivated soil).
Activities of soil cellulase, invertase, urease (values are means±s.e.d.) with increased plantation age*

ns=not significant.
* Degree of freedom (d.f.) = 45.
† Standard error of difference (s.e.d.) between means for each depth interval.
Soil microbial biomass
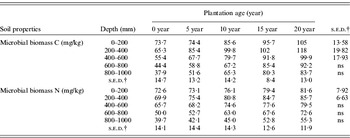
Significant differences were found for SMBC and SMBN in the 0–1000 mm layer (Table 4). SMBC and SMBN tend to increase with increasing plantation age, especially in the 200–400 mm layer. At all sites, compared to those in the surface soil (0–200 mm), the increase in soil microbial biomass was most evident in the 200–400 mm layer, while a consistent decrease with increasing depth was also found in the sub-soil (400–1000 mm). The SMBC and SMBN in the 200–400 mm soil layer at 5-, 10-, 15- and 20-year sites increased by factors of 1·0, 1·2, 1·3 and 1·4 and 1·0, 1·0, 1·1 and 1·1, respectively, compared to those in the control site (0 year).
SMBC and SMBN with increased plantation age*

ns=not significant.
* Degree of freedom (d.f.) = 45.
† Standard error of difference (s.e.d.) between means for each depth interval.
The cumulative rates of SOC increase in the 0–1000 mm soil layer at 5-, 10-, 15- and 20-year sites were 0·89, 0·99, 1·01 and 0·92 mg/kg/yr, respectively, compared to that at the control site (0 year). At each site, the mean depth group values (0–1000 mm) taken from 10 different farms for each time sequence (0, 5, 10, 15 and 20) have been included. Using a polynomial approximate simulation, it was estimated that the cumulative rate of SOC reached its maximum value at 13·1 years after plantation (Table 5). The cumulative rates of SMBC increase in the 0–1000 mm soil layer at 5-, 10-, 15- and 20-year sites were 16·2, 16·2, 16·0 and 15·0 mg/kg/yr, respectively, compared to that at the control site (0 year). It was estimated that the cumulative rate of SMBC reached its maximum value at 11·1 years after plantation. TSN and SMBN followed similar trend towards SOC and SMBC, i.e., tending to reach its maximum values at 16·8 and 14·2 years after plantation, respectively, and thereafter declined (Table 5).
Quadratic regression between plantation age (X) and cumulative amount (Y) of soil C, N in the 0–1000 mm layer

DISCUSSION
Changes in SOC and TSN after cotton plantation
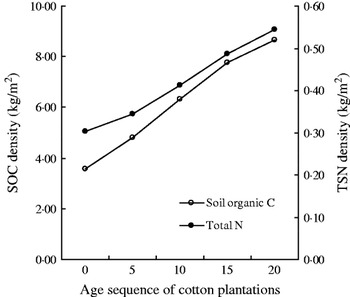
Intensive agriculture accelerated the improvement of soil quality in the field. The SOC content depends on the long-term equilibrium of input and decomposition, which are mainly affected by natural and human factors. However, the influence of natural factors is far less significant than human factors (Sitaula et al. Reference Sitaula, Bajracharya, Singh and Solberg2004; Tonitto et al. Reference Tonitto, David, Drinkwater and Li2007). The amount and quantity of carbon in agricultural soil has changed rapidly as a result of farming, fertilization and irrigation (Alvarez Reference Alvarez2005). Assuming that all plantations in the study area use the same management system, the gradual increase of SOC and TSN density with the age of plantation (Fig. 2) maybe explained mainly by changes over time in the cotton management system throughout the area, from residue removing before 1996 to residue incorporation thereafter. The effect of retaining crop residues in farming systems is generally thought to be advantageous from the point of view of nutrient cycling (Omay et al. Reference Omay, Rice, Maddux and Gordon1997), as it can increase organic matter in the soil in the long term. The present results confirmed that the density of SOC and TSN increased with increasing plantation age. Moreover, the increase in SOC was most evident in the 200–400 mm layer, and thereafter declined with soil depth. This was in accordance with the depth of cotton stalks incorporation by ploughing. Similarly, C loss can occur through tillage, due to short-term bursts of mineralization of organic C substrates, potentially leading to long-term reductions in soil C content (Grandy & Robertson Reference Grandy and Robertson2006). Therefore, the grey desert soil may become more fertile through the incorporation of cotton residue.
Temporal changes in soil organic C and N density following plantations.

Changes in soil microbiological properties after cotton plantation
Soil enzymes (intracellular and extracellular) are the mediators and catalysts of biochemical processes important in soil functioning, such as nutrient mineralization and cycling, and decomposition and formation of stable SOM (López-Piñeiro et al. Reference López-Piñeiro, Albarran, Rato Nunes and Barreto2008). Previous studies with soils from various regions have shown that enzyme activities are sensitive to soil changes in tillage, cropping systems and land use (Puglisi et al. Reference Puglisi, Del Re, Rao and Gianfreda2006). According to the present experimental data, activities of cellulase, invertase and urease showed significant differences among cotton fields of different plantation age. The values of soil enzymes activity showed a direct correlation with the beneficial effects of cotton residue return on biochemical functioning. Many researchers conclude that micro-organisms increase when large amounts of energy are released during straw decomposition increasing enzyme activity due to continuous growth of micro-organisms (Steenwerth & Belina Reference Steenwerth and Belina2008).
The soil microbial biomass is fundamental to maintaining soil functions. It controls the build-up and break-down of organic matter through the decomposition of organic residues. As shown in Table 4, soil microbial biomass concentration improved with increasing plantation age. This was probably a result of increased residue input from the cotton products. When organic matter was supplied to soil in the form of residue, the microbial biomass increased in size. As with SMBC, the accumulation of SMBN also increased in different plantation age with a low rate, possibly due to the immobilization of N in the process of the decomposition of residues (Sardans et al. Reference Sardans, Penuelas and Estiarte2008).
Potential soil carbon turnover rates vary according to location, soil characteristics, meteorological conditions and land use (Franzluebbers Reference Franzluebbers1999). The present study found that the rate of accumulation of SOC reached the maximum value at 13·1 years thereafter declined. According to Sampson & Scholes (Reference Sampson, Scholes, Watson, Noble, Bolin, Ravindranath, Verardo and Dokken2000), soil carbon accumulation rates decline 20 years after management change; ultimately achieving a stable rate for any agro-ecological system. However, the present investigation was conducted in a typical arid region characterized by limited water resources and low rainfall. Drip irrigation was introduced to the cotton field, and the frequent wet–dry cycles would have enhanced the composition and activity of the decomposer communities that ultimately determine rates of plant residue decomposition and nutrient release (Sardans et al. Reference Sardans, Penuelas and Estiarte2008). Furthermore, soil fertility was closely related to soil texture, and which will affect the turnover times and maximum C holding capacity of the soil. Improved soil physical properties result in greater root distribution and penetration and hence greater nutrient and water uptake (Dexter Reference Dexter1988). In the present study, the non-cultivated soils and the cultivated soils were of different textures–loam under cropping and sandy loam in the non-cultivated sites. Immobilization of organic C seems to be favoured in loamy texture compared to the sandy loam soil.
The present study showed that the adoption of chronosequence approach may help to explain a large proportion of total variation of soil C and N under long-term cotton plantations. Keeping the similarity of some farming strategies and adequate sampling sites is the key factors in the space for time substitution method (Saiz et al. Reference Saiz, Green, Butterbach-Bahl, Kiese, Avitabile and Farrell2006). Variability may be quite different in other oasis with varied field managements, and in soils with very heterogeneous structural properties. Therefore, research over broader geographical areas and on different ago-ecosystems is required to further assess the significance of the results presented here.
In conclusion, the present results show that SOC and TSN increased with cotton plantation age, the cumulative rate of SOC and SMBC increased gradually and then decreased. The contents of SOC, SMBC, TSN and SMBN reached the maximum value at 13·1, 11·1, 16·8 and 14·2 years after plantation, respectively. This indicated that changes in the soil microbial community may occur more rapidly than changes in other soil characteristics and, therefore, soil microbial processes are thought to be sensitive indicators of changes in soil quality of oasis agriculture. The results confirm that cotton residue incorporation can play an important role in the restoration of SOM in farmland of oasis, and may therefore be recommended for adoption in cotton fields of semi-arid oasis on a large scale. Future research must focus on quantifying the amount of cotton residues and plantation frequency and age for optimum impact. Such research can also assess the impact of SOC and nitrogen incorporation on carbon sequestration in oasis agriculture, with implications for climate change mitigation.
This research was supported by the National Key Fundamental Research Council Project (2006CB708401), Key Project of the National Eleventh-Five Year Research Program of China (2007BAC17B04), National Fund Project (NCET-09-0903), (2009001) and the Key Laboratory of Xinjiang Production and Construction Group Project (200801). We gratefully acknowledge the helpful comments by the two anonymous referees who simulated significant improvements in the analysis and writing.