Implications
There is renewed interest worldwide in mixed crop–livestock systems as economically and environmentally sustainable farming systems. Nevertheless, mixed crop–livestock systems have been declining in Europe. Therefore, the survival of mixed crop–livestock systems is a challenge for European agriculture. Understanding the paths leading to mixed crop–livestock systems and the underlying driving forces should contribute to maintain such systems.
Introduction
Mixed crop–livestock systems, combining livestock and cash crops at farm level, are considered to be a good way to achieve sustainable intensification of agriculture (Russelle et al., Reference Russelle, Entz and Franzluebbers2007; Wilkins, Reference Wilkins2008; Ryschawy et al., Reference Ryschawy, Choisis, Choisis, Joannon and Gibon2012). Such systems were common in Europe in 1950, as farms were diversified and self-sufficient (Mazoyer and Roudart, Reference Mazoyer and Roudart2006). Since 1950, European agriculture has undergone major changes, which accelerated after 1970, because of the modernisation and intensification (Antrop, Reference Antrop2005). In particular, 1950 marked the beginning of the evolution of traditional mixed crop–livestock farming systems into diverse variations (Poux, Reference Poux2004). The number of European mixed crop–livestock farms has decreased since 1970 (−70% between 1975 and 1995; European Commission (EC), 1999). An understanding of the changes leading to this decline may help Europe maintain such farming systems. Analysis of cattle system dynamics have described changes in the past, and the underlying driving forces (Garcia-Martinez et al., Reference Garcia-Martinez, Olaizola and Bernués2009). Some paths have allowed mixed crop–livestock systems to persist, whereas others have led to specialised farming systems. The objectives of this study were (i) to assess the diversity of ‘paths to last’ in mixed crop–livestock farming and (ii) to elucidate the driving forces and the conditions involved.
Material and methods
Case study site and research context
The study site was the ‘Coteaux de Gascogne’, located in the Pyrenean Piedmont in south-western France (see Supplementary material 1). It is an upland area where agricultural specialisation has been limited (Choisis et al., Reference Choisis, Sourdril, Deconchat, Balent and Gibon2010). Agro-ecological zoning (Food and Agriculture Organization (FAO), 1995) classifies the region as a temperate area with frequent summer droughts. Owing to the type of soils, the steep slopes and the climatic conditions, grasslands remain dominant throughout the Utilised Agricultural Area (UAA).
The case study site is part of the ‘European Long-Term Ecological Research’ network. An interdisciplinary research programme involving local actors is underway to address long-term relations between landscape, agriculture and biodiversity (Choisis et al., Reference Choisis, Sourdril, Deconchat, Balent and Gibon2010).
Half of the existing farms in our study area are mixed crop–livestock farms, with grass-based cattle production and cash crops. Some farms have complementary livestock production (i.e. force-feeding ducks or fattening pigs). The other farms in the area are specialised either in cash crops (14%) or cattle production (39%; Ryschawy et al., Reference Ryschawy, Choisis, Choisis, Joannon and Gibon2012).
Farm population studied and data collection
Data were collected at the beginning of 2007, with 56 of the 61 farms still active. Some of the information required for this study was not available for six farms, and thus 50 farms were included in this analysis. These 50 farms covered 86% of the UAA in the case study site (≈3440 ha on 4000 ha).
We adapted the survey method developed by Mottet et al. (Reference Mottet, Ladet, Coqué and Gibon2006) for integrated and ‘spatially explicit’ assessment of socio-technological change in farms, and collected data related to (i) farm structure, (ii) technical–economic practices and (iii) land-use practices. Historical data for 1950 to 2005 were collected using a retrospective semi-open questionnaire. Secondary data on socio-economic indicators such as markets, agricultural policies and farm dynamics were collected at the municipal and cantonal levels from official statistics (Agreste, 2010), unpublished scientific reports and interviews with local advisers. We also collected the farm orientations for 2012 (mixed crop–livestock, beef farms, dairy farms or crop farms) to compare current farm orientations with those we expected from the typology of farm trajectories of change.
Designing data to depict the temporal patterns of farm change
Selecting the appropriate time step to depict individual patterns of change are major methodological issues (Cialdella et al., Reference Cialdella, Dobremez and Madelrieux2009; Rueff et al., Reference Rueff, Choisis, Balent and Gibon2012). We chose a 10-year time step: 1950 to 1959; 1960 to 1969; 1970 to 1979; 1980 to 1989; 1990 to 1999; and a half time step 2000 to 2005. This allowed description of the major changes over the whole period. A shorter time step would not have been appropriate to study long-term strategies, as more year × variables could be confusing.
The data collected were recorded in a relational and georeferenced database (DYNAFARM-COTO®). We organised the 30 available variables into six categories. The ‘land’ category took into account the evolution of farm occupancy, for example, the evolution of the UAA and its proportion of total land tenancy. The ‘labour force’ category provided information on changes in the labour force, and in particular, the involvement of each generation on the farm. We created ‘livestock subsystem’ and ‘crop subsystem’ categories, providing information on the major changes in both crops and livestock subsystems. The degree of diversification is a key component of mixed crop–livestock systems (Ryschawy et al., Reference Ryschawy, Choisis, Choisis, Joannon and Gibon2012), and this was assessed through changes in the number and type of on-farm ‘production units’ (PU). The ‘investments’ category provided information on all investments in buildings, equipment and land improvement. Other important decisions mentioned by farmers, and the year it was taken, were also recorded.
Data analysis
We used a two-step method to assess the variety of individual trajectories of change: (i) a visual assessment on the basis of the construction of synoptic diagrams and (ii) a computer-based typology of farm trajectories.
Visual assessment
We developed a graphical method, inspired by Moulin et al. (Reference Moulin, Ingrand, Lasseur, Madelrieux, Napoléone, Pluvinage and Thénard2008). Each of the 50 individual farm histories was summarised in a synoptic diagram, using graphic conventions. A horizontal timeline represented the six time steps from 1950 to 2005. Changes in the farming systems were classified according to the six categories of variables described above. Indicators and their respective evolution were placed on the corresponding time step. Arrows pointing up and down indicated the increase or decrease, respectively, for each category, and the corresponding size was indicated. The entry of a new generation of farmers and the year were indicated on the timeline. Triangles depict memorable events that farmers said had affected farm evolution, for example, disturbances affecting the system (Dedieu, Reference Dedieu2009).
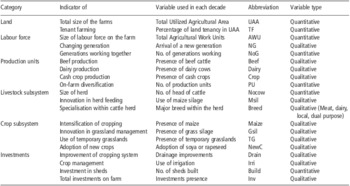
The visual assessment helped us (i) to understand the major changes in each farm and (ii) to select appropriate variables to distinguish the trajectories of each farm. We assessed similarities and differences between the 50 synoptic diagrams to identify the local trends. A set of 20 quantitative and qualitative variables were selected from the 30 available (Table 1); the 10 variables excluded illustrated trends shared by all farms. For example, all farms had permanent grasslands from 1950 to 2005: their presence was therefore not discriminating. As farmers did not remember the exact area of each crop cultivated since 1950, each crop was scored as present or absent.
Variables describing the individual trajectories of change of the farm population

Qualitative variables correspond to either ‘Presence’ or ‘Absence’ for each decade.
Statistical analysis of farm evolution
We adapted a method developed by Dolédec and Chessel (Reference Dolédec and Chessel1987) and first adapted by Gibon et al. (Reference Gibon, Balent, Olaizola and Di Pietro1999a) to study agricultural changes. Like Garcia-Martinez et al. (Reference Garcia-Martinez, Olaizola and Bernués2009), we used this method to distinguish between the effects of (i) the farm structure and functioning (internal factors) and (ii) the farm environment (external factors), in relation to time. Dolédec and Chessel (Reference Dolédec and Chessel1987) proposed using a data table, Z, composed of p continuous variables, s observations and t dates (n = s × t); in our case, p = 20 variables; s = 50 farms; t = 6 dates. In the matrix Z, each data corresponds to the value of a given variable k, at a given date i and for a given farm j. Unlike previous studies, we used Hill and Smith analysis (Hill and Smith, Reference Hill and Smith1976) to decompose the total variance of Z. This allows simultaneous consideration of categorical (qualitative) and continuous (quantitative) data. We obtained six tables through the decomposition of the total variance of table Z in three orthogonal axes (farms, dates and their interaction). One table (T) corresponds to the deviation of each farm from the farm average: table T summarises inter-farm trajectories. Therefore, table T was used to build our typology of trajectories.
Principal components analysis (PCA) was performed on table T to reduce its size and identify the main factors that summarise the changes observed. According to the Kaiser criterion, we selected the four factors with eigenvalues greater than one. The four main factors of PCA explained 63.1% of the total variance between the farm trajectories. These four factors were subjected to hierarchical cluster analysis (with squared Euclidean distance and Ward's aggregation method) to classify farms according to their pattern of evolution. The temporal profiles of the 50 farms were analysed by K-means clustering on the basis of the fixed hierarchical agglomerative clustering (HAC)-clusters’ centroids, to establish the final typology. We applied a random partition method with dynamic swarms, to maximise the between-classes inertia. R 2.12.0 software (R Development Core Team, 2011) was used for all statistical analyses.
To analyse changes in each type, we calculated means and standard deviations of variables for each type of trajectory. We evaluated the current percentages of mixed crop–livestock systems within each type to identify those allowing survival of such systems. Mixed crop–livestock systems were defined according to Seré and Steinfeld (Reference Seré and Steinfeld1996): ‘Livestock systems in which more than 10 percent of the dry matter fed to animals comes from crop by-products or stubble, and more than 10 percent of the total value of production comes from non-livestock farming activities’.
Drivers of change
We discussed the typology of farm trajectories of change with 10 local farmers and their local adviser at a collective meeting. We asked them to give their views on the evolution of the local socio-economic context, and in particular, on the drivers of change that had an influence on the survival of mixed crop–livestock farms. The collective meeting contributed to validate the typology and to check that essential elements had not been missed because of the length of the time step.
Evaluation of result reliability
We discussed our typology with 12 farmers through individual interviews (two farmers per type and subtype). We first presented the whole typology to each farmer without indicating the classification of his/her farm. We asked him/her to indicate the type of trajectory corresponding to his/her farm. The two classifications were compared. The interviews were also informative about the interpretation of the types.
Results
A wide variety of individual farm trajectories of change
Clustering of farm trajectories
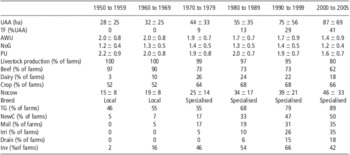
In addition to the general trends (Table 2), there was marked diversity in the individual trajectories. The first four factors of the PCA explained, respectively, 21.1%, 16.5%, 15.1% and 10.4% of the total inertia. Factor 1 (intensification) corresponded to a gradient ranging from traditional systems to substantial intensification and land improvement. Factor 2 (beef orientation) corresponded to a gradient from beef cattle orientation to dairy cattle orientation. Factor 3 (household model) was a gradient from a stem family model to a nuclear family model. Factor 4 (type of land use) was a gradient of land use from grasslands to cash crops. The contribution of the main variables to these four factors of the PCA is given in Supplementary material 2.
Main changes in average farm characteristics after 1950

See Table 1 for abbreviations.
Means ±s.d. are given for quantitative variables; the % of the presence for qualitative variables.
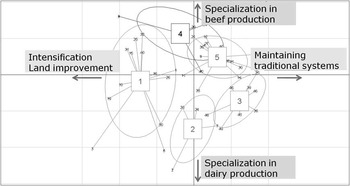
Clustering led to the identification of five clusters of farm trajectories (Figure 1 shows the projection of the five clusters on the first PCA factorial map).
Projection of the five types of trajectories of change on the PCA F1-F2 factorial map. Factor 1, which explained 21.1% of between-farm variance, corresponded to a range from traditional systems to substantial intensification and land improvement. Factor 2, which explained 16.5% of between-farm variance, corresponded to a gradient from an orientation of livestock production in beef cattle to an orientation in dairy cattle. HAC and K-means clustering on the four main factors of PCA distinguished five types of trajectories of change among farms. PCA = Principal Components Analysis; HAC = hierarchical agglomerative clustering.

Elucidation of clusters
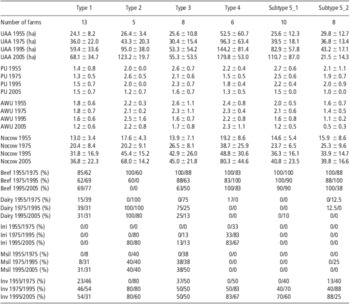
The values of some variables illustrating the changes in each type of trajectory are summarised in Table 3. Trends of change observed in farm characteristics according to the type of trajectory are given in Supplementary material 3.
Trends of change observed in farm characteristics according to the type of trajectory

Means ±s.d. are given for quantitative variables; the % of the presence for qualitative variables.
Type 1 (13 farms) was marked by a relatively stable number of production units (PU) (1.5). Two-thirds of the farms maintained both beef cattle and crop productions; the other third oriented towards dairy production, with crop production to feed the herd. The UAA increased gradually, by 40 ha on average for the whole period. Farms were likely to adopt innovations to feed the herd, for example, maize silage and temporary grassland, with 80%, allowing greater feed production. Irrigation was never introduced. There were innovations in livestock feeding. Land-use combinations and practices favoured substantial autonomy through interactions between livestock and crops. Four of the 13 farms of type 1 (31%) are currently mixed crop–livestock systems.
Type 2 (5 farms) involved an orientation for dairy production before 1975. The farms enlarged their structure to increase dairy production while specialising. The UAA has increased fivefold and the dairy herd fourfold. Enlargement was combined with the use of irrigation and mechanisation, allowing maize silage production to feed the herd. Technological innovations were widely adopted. The farms have been substantially modernised through high investment since 1975. Agricultural Work Unit (AWU) remained high throughout period in four out of five farms. All farms of type 2 are currently specialised.
Type 3 (8 farms) remained small in comparison with other types, and at least two generations were still working together. This workforce availability combined with a small UAA allowed the survival of diversified mixed crop–livestock farming with, at least, cattle and crop production. PU decreased from 2.6 to 1.6 because of the disappearance of some small livestock PU. Some innovations to intensify beef production on a small UAA, such as maize silage, have been adopted. Investment was low: only two of the eight farms were still investing in 2001 to 2005. Crops were produced to feed livestock units, and therefore do not appear as a PU for sale in most cases. Three of the eight farms (38%) are currently mixed crop–livestock systems.
Type 4 (6 farms) showed substantial enlargement in UAA and herd size, despite the farms being the biggest in 1950. Investments were high in each decade in five of the six farms. Irrigation and drainage were implemented in all farms in 1970 to 1980. Technological innovations to feed the cows were not adopted, as land availability was sufficient for extensification through a grassland-based production. Half of the farms have been specialised in cattle production since 1970, and half continued beef production and cash crop production until 2000, as the number of AWU was sufficient for the work on an enlarged farm. After 2000, some farmers had to specialise their farm for cash crop production because of an expected reduction of AWU. Two of the six farms (33%) are currently mixed crop–livestock systems.
Type 5 (18 farms) was marked by a nuclear family model since 1975: only one generation was working and making decisions on the farm. The UAA was increased by tenant farming; the farms gradually adapted size and orientations to the available workforce, through progressive investments. Specialisation and technological innovations were limited: neither irrigation nor drainage was implemented, and maize silage was rare. Mixed crop–livestock systems were maintained, combining beef cattle production and cash crop production until 1990. The working collective organisation differentiated two subtypes.
Subtype 5_1 (10 farms): Although the AWU decreased from 2.0 to 1.2 over the whole trajectory, labour was available throughout the period. This allowed the survival of mixed crop–livestock systems. There was substantial enlargement between 1970 and 1990, through land tenancy. The PU decreased to 1.5. Four of the 10 subtype 5_1 farms (40%) are currently mixed crop–livestock systems.
Subtype 5_2 (8 farms): Family labour was a limiting factor; AWU decreased over the period from 1.6 to 0.5, when the last generation of farmers took an off-farm job. The absence of a successor limited innovation since 1970. Since 1990, the workforce shortage led to specialisation: practices were simplified and PU was limited to the production of cash crops. All farms were in the process of collapsing at the time of the study.
Drivers of change
The major driving forces involved in the survival of mixed crop–livestock farming are associated with the general socio-economic context. According to local farmers and advisers, the changes observed can be partly explained by large effects of the Common Agricultural Policy (CAP) and the globalisation of markets. The year 1970 marked the beginning of the general process of specialisation and modernisation of local agriculture under their influence. Farmers were financially encouraged to increase production and to choose a specific market sector through specialisation. The local commercial context influenced production orientations. The demand for weanlings from the Italian market and the implementation of subsidies from the CAP since 1975 encouraged farmers to specialise in beef cattle production. Small livestock production declined, and specialised meat or dairy cattle breeds replaced the local breed to produce more appropriate weanlings for the Italian market, and to increase milk production, respectively.
Most local farmers tried to employ only family members. The presence of a successor strongly influenced farm trajectories. For instance, subtype 5_2 farmers currently have no likely successor, leading to the collapse of the farm. Farmers reported that the absence of workforce contributed to the abandonment of PU. Both farmers and advisers stated that major labour shortage during two periods (1970s and 1990s) resulted in some farms being taken over by other, now larger, farms. They suggested that the survival of mixed crop–livestock farming on the area was partly linked to the local stem family model, in which keeping crop and livestock productions on the farm was a tradition. Nevertheless, local farms experienced major changes to these social structures and, in recent decades, were confronted with the absence of a successor.
The diversity of farm trajectories observed is partly related to differences between farm structures in 1950. As farmers explained, they observed significant differences between farm soil–climatic conditions. Some farms had parcels with a higher potential for modernisation than others, which had more hillsides than plains in their UAA. The farm structure contributed to the evolution of the orientations of the farms all along their trajectories.
Evaluation of result reliability
During the 12 interviews, 10 farmers confirmed our interpretation of their farm type. The two other farmers did not know where to classify their farm in our typology. After detailed observation of the data describing the evolution of each type, which helped us improve our interpretation, these farmers agreed with our classification of their farm. Of the 10 farmers present at the collective meeting, five had not previously been interviewed. All the farmers agreed with the final typology of farm trajectories we presented.
Discussion
The ‘paths to last’ in mixed crop–livestock farming
We describe various ‘paths to last’ that are diversely favourable to specialisation and to the survival of mixed crop–livestock systems. The farm trajectories were classified into five types, four of which allowed the survival of mixed crop–livestock systems. Type 1 was characterised by the maximisation of autonomy through combining crops and livestock. Type 3 involved the diversification of production on small farms to secure income against market fluctuations. These two types of ‘paths to last’ correspond to economies of scope, as described by Vermersch (Reference Vermersch2007). The combined agricultural productions in mixed crop–livestock systems allowed cost saving. Type 4 exploited farm enlargement for economies of scale, and was associated with the availability of labour to work on an enlarged farm. A lack of workforce led to a simplification of practices and to the choice of a production orientation, either livestock or cash crops. Type 5 was characterised by progressive adaptation of the farm to a familial workforce for mixed crop–livestock production. This ‘path to last’ involved adjustment of the labour on the farm, but could nevertheless lead to collapse or specialisation, either in livestock or crops, when the workforce is lacking (as observed in subtype 5_2). The diversity observed among these enduring trajectories for mixed crop–livestock farming could partly explain the diversity in current mixed crop–livestock systems and practices, as observed previously (Choisis et al., Reference Choisis, Thévenet and Gibon2012; Ryschawy et al., Reference Ryschawy, Choisis, Choisis, Joannon and Gibon2012). Only type 2 did not lead to any mixed crop–livestock systems: these trajectories were involved in the enlargement to increase dairy production through economies of scale. This led to specialisation, whereas mixed crop–livestock systems are based on economies of scope (Vermersch, Reference Vermersch2007).
The drivers of change and farmers decision-making process
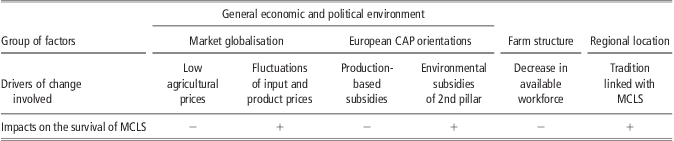
The three groups of factors distinguished by Veysset et al. (Reference Veysset, Bebin and Lherm2005) appear to influence strongly the evolution of mixed crop–livestock farming in our study area (Table 4). First, the general economic and political environment favoured the specialisation process, and in particular, the low prices of agricultural products due to market globalisation and the output-based subsidies of the European CAP (Chatellier and Guyomard, Reference Chatellier and Guyomard2008). Type 2 illustrates this evolution: a single production orientation facilitating the intensification of the system. Nevertheless, fluctuations of input and product prices may favour the survival of mixed crop–livestock systems, giving them an economic advantage (Ryschawy et al., Reference Ryschawy, Choisis, Choisis, Joannon and Gibon2012). In addition, the political incentives of the second pillar of the CAP have helped farmers to keep permanent grassland through extensification payments (Veysset et al., Reference Veysset, Bebin and Lherm2005).
Major drivers of change involved in the survival of MCLS
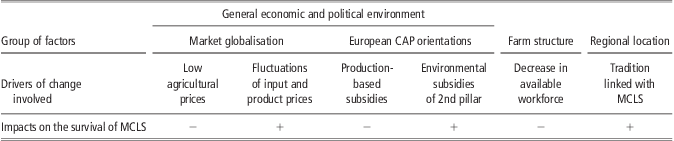
MCLS = mixed crop–livestock systems; CAP = Common Agricultural Policy.
The farm structure was identified as a second group of factors. The farm size and configuration in 1950 seem to have contributed to the evolution. Nevertheless, farmers’ choices are not strongly conditioned by this driver of change. For instance, some type 1 farmers decided to favour mixed crop–livestock systems despite a farm structure that would have allowed specialisation. In contrast, some type 2 farmers had a farm structure in 1950, which was not optimal for intensification, but nevertheless consistently modernised. The availability of workforce became a major driver of change after 1970. Processes of succession are known to be determinants of critical transitions in farm trajectories (Potter and Lobley, Reference Potter and Lobley1996).
The regional location, determining commercial and soil–climatic context, was identified as a third group of drivers of change. The local market especially promoted the production of weanlings. The relative stability of the local production orientations and an autonomous mixed crop–livestock system seem to be tightly linked to a farm functioning on the basis of cultural values prevailing in local rural societies, organised as stem households with a single heir. This system is still alive in the region (Sourdril et al., Reference Sourdril, Du Bus de Warnhaffe, Deconchat, Garine and Balent2006).
Only two types of trajectories appear likely to persist, independent of the changes in the context: maximisation of autonomy (type 1) and diversification (type 3) may maintain mixed crop–livestock systems in Europe in the future. Since 2000, the increasing prices of inputs have validated these two ‘paths to last’ in mixed crop–livestock farming. Most of the drivers of change identified cannot be influenced, for example, the globalisation of the market or the availability of workforce. Political incentives are nevertheless essential levers to help farmers to maintain mixed crop–livestock systems. Subsidies based on diversification of production or autonomy through interactions between crop and livestock could be tested. The survival of systems favourable to environmental sustainability could justify such political orientations at the regional or European level (Ryschawy, Reference Ryschawy2012).
Comparison with other studies
Lemery et al. (Reference Lemery, Ingrand and Dedieu2005) described ‘paths to last’ in Burgundy. Under a pattern of change called ‘act upon’, they identified two paths: ‘Technical efficiency by optimisation and investment in the collective’ and ‘get bigger’ corresponding to our type 2 and type 4, respectively. Under a second pattern called ‘go with’, they identified two paths: ‘keep autonomy’ and ‘diversify with other important activities’ corresponding to our type 1 and type 5_1, respectively. For this second group, diversification involves agricultural productions (maintaining mixed crop–livestock systems) or non-agricultural orientations (off-farm jobs). Our type 3 was not identified in their study because of its local specificity.
Garcia-Martinez et al. (Reference Garcia-Martinez, Olaizola and Bernués2009) also found similar types of trajectories between 1990 and 2004 in Spanish Pyrenean farming systems. A pattern of evolution qualified as ‘structural equilibrium’ corresponds to our types 1 and 3; this showed relative stability of farm structure over the period 1990 to 2004. The pattern of evolution ‘large structural growth’ corresponds to our types 2 and 4, with large increases in land and herd size since 1990. Type 5_1 had no equivalence in their study.
Rueff et al. (Reference Rueff, Choisis, Balent and Gibon2012) analysed farm trajectories in the French Pyrenees, where the stem household organisation persists. They identified a ‘patrimonial’ type of trajectory corresponding to our type 3. Their type ‘retreat’ corresponds to our type 5_2. In our area, the ‘niche’ strategy was not found, as there are fewer opportunities for tourism.
The difficulty of assessing long-term change on farms
The time lag and recall
We chose to study farm trajectories after 1950 for both scientific and methodological reasons. Modernisation of farms in Europe started in 1950. Their trajectories changed at this time (Antrop, Reference Antrop2005). Fifty years is the limit of human memory for retrospective collection of data (Cialdella et al., Reference Cialdella, Dobremez and Madelrieux2009); the data are often limited by the accuracy of the information provided during surveys. For example, farmers remember the presence or absence of maize production in a past decade, but not of the area of maize cultivated.
During retrospective interviews, farmers may give a reconstructed view of the past rather than the perception they had at the time the decision was made (Lamine and Bellon, Reference Lamine and Bellon2008), even if trying to be objective. Experience changes their interpretation of facts (Cialdella et al., Reference Cialdella, Dobremez and Madelrieux2009).
Added value of a combination of methods
In our study, we emphasised the interpretation of the data supplied by the farmers, with unavoidable subjectivity. Nevertheless, computer-processing methods limit this subjectivity (Mulaik, Reference Mulaik1993); the statistical analysis was chosen on the basis of both conceptual and empirical considerations.
Discussions with farmers enabled us to improve our interpretation and to confirm the trends we identified. This study illustrates the value of participatory research with farmers and other local actors (Gibon et al., Reference Gibon, Sibbald, Flamant, Lhoste, Revilla, Rubino and Sorensen1999b). Farmers contributed considerably to improving the study by providing access to their local knowledge. Indeed, working with local actors appears to be particularly beneficial for both researchers and stakeholders. It allows changes in farming systems to be better understood (ComMod, 2005). It also promotes discussion on driving forces in the past, favouring an objective and external representation that could be of importance in the future.
Conclusion
We report findings of topical interest on trajectories that have allowed the survival of mixed crop–livestock farming in upland conditions. Over the long term, some paths were compatible with mixed crop–livestock systems and others led to specialised farming systems. Within the five identified types of trajectories, four were compatible with maintaining mixed crop–livestock systems. The first maximised autonomy through the combination of crops with livestock. The second relied on diversification to benefit from economies of scope and secure the farm against market fluctuations. The other two were based on enlargement and progressive adaptation of the farm to the familial workforce; the survival of mixed crop–livestock in these two types is highly dependent on workforce availability. Only one type of trajectory, on the basis of enlargement and economies of scale, did not lead to any mixed crop–livestock systems.
The socio-economic context favoured specialisation through incentives from the European CAP, market globalisation and the decreasing availability of labour. The two latter drivers of change are not easily modified by policy. However, political incentives favouring on-farm interactions between crop and livestock could contribute to the maintenance of mixed crop–livestock systems. In view of the current evolution of the driving forces, maximising autonomy and diversification appear to be suitable paths to deal with current challenges and maintain mixed crop–livestock systems in Europe.
Acknowledgements
This study was funded by the Agriculture and Sustainable Development programme (ADD), project ‘MOUVE’ and the Midi-Pyrenees Region, under the INRA-Region research programme ‘CHAPAY’. The authors thank the local actors of the French Coteaux de Gascogne for contributing to this study.
Supplementary material
For supplementary material referred to in this article, please visit http://dx.doi.org/10.1017/S1751731112002091