


I. INTRODUCTION
Wireless power provides convenience and safety for applications such as electric vehicles and, biomedical implants, where fixed cable connection is difficult or impossible. Many types of wireless power technologies have been developed based on inductive magnetic field coupling, capacitive electric field coupling, and electromagnetic wave propagation [Reference Covic and Boys1–Reference Liu, Hu and Budhia3]. Ultrasonic power transfer (UPT) is a wireless power technology that utilizes mechanical particle vibrations and electro-mechanical conversion to enable electrical power transfer [Reference Roes, Duarte, Hendrix and Lomonova4–Reference Chakraborty, Wilt, Saulnier, Scarton and Das9]. The system operates at a frequency above the audible spectrum, thus UPT is a preferred term, although other researchers also used the term acoustic energy transfer [Reference Roes, Duarte, Hendrix and Lomonova4, Reference Bao10–Reference Yuantai, Zhang, Jiashi and Qing12].
A typical UPT system consists of a pair of piezoelectric transducer coupled to a medium. In principle, power can be transferred through any non-vacuum medium, including air, fluid, or solid medium [Reference Roes, Hendrix and Duarte5, Reference Chakraborty, Wilt, Saulnier, Scarton and Das9, Reference Moss11, Reference Charthad, Weber, Ting Chia, Saadat and Arbabian13–Reference Lawry, Wilt, Ashdown, Scarton and Saulnier15]. The power transfer is attributed to the characteristic acoustic impedances; and similar impedances of the medium and the transducer would lead to higher-power transfer capability as indicated in chapter 6 of [Reference Kinsler, Frey, Coppens and Sanders16]. Air and fluids normally have low mass density to support the power transmission via mechanical vibration, so the power density that can be achieved is very limited [Reference Roes, Hendrix and Duarte5]. Lee et al. and Ozeri et al. have conducted research on transferring power through flexible media such as animal tissues and skin to power biomedical devices [Reference Ozeri, Shmilovitz, Singer and Wang8, Reference Lee, Youm and Hwang17, Reference Ozeri and Shmilovitz18], but the power that can be practically transferred is also very low. As most metals have similar acoustic impedance to piezoelectric materials, solid medium such as metal plates become the most practical coupling option for developing UPT systems.
Titanium, steel, and aluminum plates have been used as the medium of UPT systems [Reference Bao6, Reference Bao10, Reference Lawry, Wilt, Ashdown, Scarton and Saulnier15, Reference Leung, Willis and Hu19–Reference Sherrit21]. Different methods of attaching the transducers onto solid metal media were explored in [Reference Sherrit22]. These methods include using stress bolt clamps, grease with a physical clamp, and epoxy. Transducers were also directly bolted onto the metal medium in [Reference Bao6, Reference Leung, Willis and Hu19, Reference Sherrit21]. The attachment method of the transducers to the medium alters the characteristics of the system. The system is tightly coupled when the transducers are physically bolted or welded onto the medium such that the system vibrates as one solid structure when excited. Multiple medium layers of different material may be present in a tightly coupled system, as long as each layer is firmly attached.
The fundamental theory behind UPT in relation to the power transfer performance in the electrical domain is inadequate for guiding practical UPT system design. Some existing works focus on methods to improve the power transfer capability but do not provide an accurate prediction of the expected power transfer [Reference Bao6, Reference Ozeri, Shmilovitz, Singer and Wang8, Reference Ozeri and Shmilovitz18]. Modeling a UPT system is necessary to analyze and to predict results. However, most of the current modeling methods do not characterize the system accurately to analyze tightly coupled systems. Mathematical modeling using the wave equation and linear equations of piezoelectricity were used in [Reference Yuantai, Zhang, Jiashi and Qing12], and was extended further by using network equivalent models to include multiple medium layers in [Reference Sherrit, Badescu, Bao, Bar-Cohen and Chang23]. The model was enhanced further by characterizing the loss of the system as lossy transmission lines using LTSpice models in [Reference Moss11, Reference Moss20]. However, these models were not in strong agreement with experimental results of a practical system. An accurate model using ABCD parameters of a two-port network was proposed in [Reference Lawry, Wilt, Scarton and Saulnier24]. The behavior of each medium layer was analogous to an acoustic transmission line with characteristic acoustic impedance and length equal to the thickness of the material. The model was experimentally verified and showed great accuracy. However, the theoretical parameters of each medium layer required tuning to match the theoretical response to the measurements in order to predict the power transfer function accurately. Although the model in [Reference Lawry, Wilt, Scarton and Saulnier24] is accurate, the final system matrix parameters do not present clear meaning in relations to its mechanical characteristics and provide no insight of factors associated with the power transfer capability.
This paper proposes a new UPT equivalent circuit model, which is easily derived from the admittance spectrum of the primary piezoelectric transducer for tightly coupled systems. The proposed model use parallel LCR branches to model the mechanical characteristics of the system, enabling deeper understanding of the fundamentals relating to the power transfer performance. The model reveals particular characteristics of tightly coupled systems that determine the power transfer capability. Simulation and experimental results show the load conditions corresponding to maximum power transfer and maximum efficiency, and a technique to identify output power peaks for variable loads and loading effects is presented.
II. OVERVIEW OF THE PROPOSED UPT MODEL
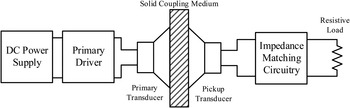
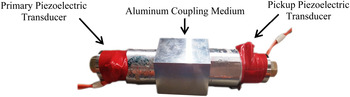
Figure 1 shows the architecture of a typical UPT system consisting of piezoelectric transducers attached to a solid medium. The primary driver excites the primary transducer with a sinusoid waveform at the piezoelectric resonant frequency. An impedance matching circuitry that typically precedes the load of the pickup transducer is omitted in this work. Figure 2 shows an example of a tightly coupled UPT system, where two Langevin-type piezoelectric transducers are bolted onto an aluminum medium. A system is tightly coupled when the bond between the piezoelectric transducer and the medium is strong to consolidate a unified system.
System architecture diagram.

Example of a tightly coupled system.

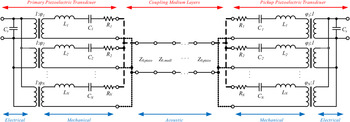
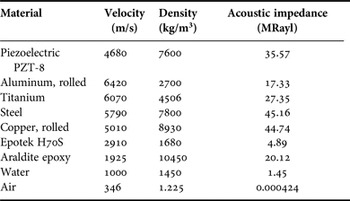
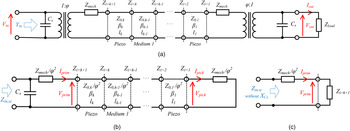
Figure 3 shows the structure of the proposed model for a tightly coupled UPT system. The model includes the piezoelectric transducers and the medium where power is transferred through. The piezoelectric transducers are modeled as electrical and mechanical parameters and the medium as acoustic parameters. The electrical parameters comprise of the static capacitance C s of the piezoelectric, and every mechanical characteristic is reflected electrically through the coupling transformer with an electro-mechanical coefficient φ. The mechanical characteristics of the system are lumped into N branches of series LCR circuits on the piezoelectric, with each branch representing a mode of resonance. An inductor L is analogous to the modal mass m, capacitor C to the compliance 1/s, and resistance R to mechanical damping c [Reference Harrie25]. The acoustic parameter models the flow of ultrasound through the structure from the primary to the pickup piezoelectric transducer. An equivalent transmission line represents each layer of material between the transducers, including the piezoelectric material. Each line has characteristic impedance equal to the material's characteristic acoustic impedance. Table 1 lists the characteristic acoustic impedance of some common materials [Reference David and Cheeke26, Reference Lide27].
The proposed model for tightly coupled systems.

Characteristic acoustic impedance of materials [Reference David and Cheeke26, Reference Lide27].

The proposed model only applies to tightly coupled systems because the transmission line links any mechanical change on the medium to the piezoelectric transducers. The transmission line cannot model a non-tightly coupled system because the bond between the medium and transducer (or between medium layers) is insufficient to comply a direct mechanical connection due to the increasing presence of air between the path of power transfer. The characteristic acoustic impedance of air is extremely low relative to metals and piezoelectric materials and thus, the presence of air impedes the power flow significantly. Lawry et al. used Araldite 2014 epoxy in [Reference Lawry, Wilt, Scarton and Saulnier24], which has similar acoustic impedance to metals and thus their system is still regarded as tightly coupled. The proposed model differs to [Reference Lawry, Wilt, Scarton and Saulnier24] by analysis using equivalent electrical models solely based on the admittance spectrum of the primary piezoelectric transducer. A deeper insight of the UPT system is provided by relating parallel LCR branches to the physical resonant modes of the system. The characteristics of the piezoelectric are modified by the medium when tightly coupled, so the mechanical parameters in the proposed model actually represent the system characteristics. Consequently, the shape, size, and material of the medium will change the frequency response of the piezoelectric. Mechanical characteristics of tightly coupled systems are discussed further in Section IV-D.
III. DETERMINATION OF MODEL PARAMETERS
Generally, it is difficult to predict the mechanical characteristics of the system because physical parameters such as the shape and size of each material cause an obscure change in the mechanical response of the system. Thus, it is difficult to estimate N, L, C, and R without any software simulation tools. Instead, all the mechanical parameters are lumped into a frequency-dependent circuit block Z mech , as shown in Fig. 4(a). To calculate Z mech , the system is analyzed in the electrical domain. Consequently, all the mechanical and acoustic parameters are reduced by a factor of φ2. Z mech on the primary and pickup can be assumed identical given the physical structure of the system is symmetrical and assuming the primary and pickup piezoelectric transducers is identical. To simplify the calculation process, let φ = 1, and assume the propagation of ultrasound is lossless along each medium layer.
The proposed model with: (a) the mechanical parameters simplified into Z mech . (b) Z load short circuited and with the mechanical and acoustic parameters reflected to the electrical domain and reduced by a factor of φ2 . The reflected electrical short circuit on the pickup transducer also appears as a mechanical short circuit. (c) The mechanical load reflected back on the primary, appearing as a load Z k+1. Z in,sc without X Cs is the input impedance with the static capacitance C s removed.

To determine the mechanical impedance Z mech , the short-circuit condition on the pickup side shown in Fig. 4(b) is considered, and the reflected input impedance of the load observed from the primary can be obtained by an iterative process, which is derived from the standard telegrapher's equations in the following format:
 $$Z_{i + 1} = Z_{0,i}\displaystyle{{Z_i + jZ_{0,i}\tan (\beta _il_i)} \over {Z_{0,i} + jZ_i\tan (\beta _il_i)}},$$
where i is the transmission line number counting from the pickup end, β i is the wave number of the ith equivalent transmission line segment, l i is the length of the ith material along the direction of propagation, Z 0,i the characteristic acoustic impedance of the ith material, and Z i is the front-end impedance that loads the ith segment. However, the unknown parameter Z mech is the load Z i=1 in the short-circuit condition, so it is not reasonable to iteratively use (1). Alternatively, the standard telegrapher's equations can also be used to derive the reflected impedance at Z i=k+1 in the form of (2):
 $$Z_{i = k + 1} = \displaystyle{{A_{i = k + 1}Z_{mech} + jB_{i = k + 1}} \over {jC_{i = k + 1}Z_{mech} + D_{i = k + 1}}},$$
where k is the total number of the medium layers, including the piezoelectric material of both primary and pickup transducer, so k = 3 is the minimum value for a single-coupling medium system. The coefficients A k+1 , Bk+1, Ck+1 , and D k+1 are calculated using the iterative formulae (3) until i = k:
 $$A_{i + 1} = Z_{0,i}A_i + Z_{0,i}^2 C_i\tan (\beta _il_i),$
 $$B_{i + 1} = Z_{0,i}B_i + Z_{0,i}^2 D_i\tan (\beta _il_i),$
 $$C_{i + 1} = Z_{0,i}C_i + A_i\tan (\beta _il_i),$
 $$D_{i + 1} = Z_{0,i}D_i - B_i\tan (\beta _il_i),$$
with initial conditions of
 $A_2 = Z_{0,1},\;B_2 = Z_{0,1}^2 \tan (\beta _1l_1),\;C_2 = \tan (\beta _1l_1)$
, and D
2 = Z
0,1.
Figure 4(c) presents the simplified equivalent circuit model in the absence of the static capacitance C s on the primary side. Finally, Z mech is calculated using (4) by equating the circuit impedance of Fig. 4(c) to the measured impedance Z in,sc of the system (with the primary static capacitance removed also).
 $$\eqalign{&Z_{mech} =\cr& \displaystyle{\eqalign{ &- (D_{k + 1} + A_{k + 1} - C_{k + 1}Z_{in,sc}){\rm \;} \pm \cr&\sqrt {{(D_{k + 1} + A_{k + 1} - C_{k + 1}Z_{in,sc})}^2 - 4C_{k + 1}(B_{k + 1} - D_{k + 1}Z_{in,sc})}} \over {2C_{k + 1}}}.}$$
Note the real component of Z mech should be positive, as the mechanical damping of the system cannot be negative. The static capacitance is found by measuring the capacitance across the plates of the piezoelectric transducer.
IV. SYSTEM THEORETICAL ANALYSIS
A) Output power and efficiency
The output power and efficiency is predicted using the following method based on the simplified model of Fig. 4(a). Equation (5) presents the predicted input admittance of the system with an electrical load of Z load , and X Cs the reactance of the static capacitance.
 $$Y_{in} = \displaystyle{1 \over {X_{Cs}}} + \displaystyle{1 \over {\displaystyle{{Z_{mech}} \over {\varphi ^2}} + \displaystyle{{A_k((Z_{mech}/\varphi ^2) + (X_{Cs}Z_{load}/X_{Cs} + Z_{load})) + jB_k} \over {jC_k((Z_{mech}/\varphi ^2) + (X_{Cs}Z_{load}/X_{Cs} + Z_{load})) + D_k}}}}.$$
Equations (6) and (7) are derived by using Kirchhoff's current law and Ohm's law on the equivalent circuit of Fig. 4(c).
 $$V_{prim} = V_{in}\left( {1 - Z_{mech}\left( {Y_{in} - \displaystyle{1 \over {X_{Cs}}}} \right)} \right),$$
 $$I_{prim} = \displaystyle{{V_{in} - V_{prim}} \over {Z_{mech}}}.$$
Due to the tight coupling of the system, and assuming lossless transmission lines, the apparent power S line will be equal along the transmission line, calculated using (8).
 $$S_{line} = V_{prim}I_{prim}.$$
The pickup voltage and current is found using (9) and (10), respectively.
 $$V_{pick} = \sqrt {S_{line}\left( {Z_{mech} + \displaystyle{{Z_{load}X_{Cs}} \over {Z_{load} + X_{Cs}}}} \right)}, $$
 $$I_{pick} = \displaystyle{{V_{pick}} \over {\left( {Z_{mech} + \displaystyle{{Z_{load}X_{Cs}} \over {Z_{load} + X_{Cs}}}} \right)}}. $$
Therefore, the output voltage across the terminals of the pickup piezoelectric transducer, and the output current is calculated using (11) and (12). The phase with respect to the input voltage is not of importance for this work, thus, the magnitude of the pickup current is used to calculate the output voltage and current. Finally, the output power and efficiency is calculated using (13) and (14), respectively, where the power factor angle
 $\theta = \tan ^{ - 1}\left( {Im\left\{V_{out} \right\} \over Re \left\{V_{out} \right\}} \right) - \tan ^{-1} \left({Im\left\{I_{out} \right\} \over Re\left\{I_{out} \right\}} \right)$
. The efficiency is calculated by the ratio between the output power of a real load and the input apparent power.
 $$V_{out} = \left \vert {I_{pick}} \right \vert \displaystyle{{Z_{load}X_{Cs}} \over {Z_{load} + X_{Cs}}},$$
 $$I_{out} = \left \vert {I_{pick}} \right \vert \displaystyle{{X_{Cs}} \over {Z_{load} + X_{Cs}}},$$
 $$P_{out} = \left \vert {V_{out}} \right \vert \left \vert {I_{out}} \right \vert \cos \theta, $$
 $$Efficiency = \displaystyle{{P_{out}} \over {\left \vert {V_{in}} \right \vert \left \vert {I_{in}} \right \vert}}. $$
B) Peak output power
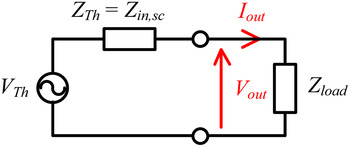
Given the assumptions of identical piezoelectric transducers and a symmetrical system, the equivalent impedance observed from the terminals of the pickup transducer is identical to the short-circuit condition Z in,sc with the primary static capacitance present. Figure 5 presents the Thevenin equivalent circuit diagram observed from the pickup piezoelectric terminals, note that Z in,sc is a frequency-dependent parameter. Maximum power transfer is achieved by impedance matching of the load with the minimum impedance of Z in,sc , which occurs at the frequency with minimum damping, as each resonant branch is uniquely damped according to its mechanical mode of vibration.
Thevenin equivalent circuit diagram of the proposed model observed from the terminals of the pickup transducer.

For a variable load, the peaks of output power can be tracked using maximum power transfer theorem. The peaks of output power are observed at the frequencies where the impedance Z in, sc is equal to the load impedance. A peak in output power is expected for each resonant branch. This method to track peak power is experimentally verified in Section VI.
C) Loading effects
Changing the load impedance affects the mechanical damping c and stiffness s of the system. The equivalent load impedance at the terminals of the pickup transducer tends toward the reactance of the static capacitance C s for an open-circuit load, and zero for a short-circuit load. The expression of the output impedance is the load in parallel with the static capacitance as shown in (15), where R eq is the equivalent output resistance, and C eq the equivalent output capacitance. The mechanical resonance is calculated using (16):
 $$(Z_{load})\parallel \left( { - j\displaystyle{1 \over {\omega C_s}}} \right) = \displaystyle{{Z_{load}} \over {1 + {(\omega C_sZ_{load})}^2}} - j\displaystyle{{\omega C_sZ_{load}^2} \over {1 + {(\omega C_sZ_{load})}^2}}\; \equiv R_{eq} - j\displaystyle{1 \over {\omega C_{eq}}} \equiv c - j\displaystyle{s \over \omega}, $$
 $$f_{res} = \displaystyle{1 \over {2\pi}} \sqrt {\displaystyle{s \over m}}, $$
where s is the stiffness, and m is the mass of the system. The stiffness is inversely proportional to the equivalent capacitance C eq , thus, maximum stiffness is observed for the open-circuit scenario, and minimum stiffness for short circuit. Therefore, the open-circuit condition has the highest resonant frequency for each resonant mode, and short circuit the lowest.
The mechanical response of the system follows the damping due to R eq . The quality factor Q of each resonant mode decreases as the system equivalent resistance R eq is greater. A low Q results in lower peaks that are less sharp on the admittance spectrum Y in . Consequently, the transmitted power decreases because the supplied power is a function of the input admittance (17).
 $$S_{in} = V_{in}^2 Y_{in}.$$
D) Mechanical characteristics and power transfer capability
The proposed model combines the mechanical characteristics of the piezoelectric and the medium, linking the system together with the piezoelectric response. This suggests the piezoelectric and medium becomes one structure. So, there should be a quantity or variable, which measures the tightness of the coupling between the transducer and medium. This corresponds to the bond quality of the physical attachment between the piezoelectric and coupling medium. The quality factor Q of the LCR resonant branches is a good indicator of the coupling quality, where a high Q correlates to good (tight) coupling. Langevin-type piezoelectric transducers demonstrate this concept very well. Langevin-type piezoelectric transducers are constructed by tightly coupling piezoelectric rings to a front and tail metal mass to significantly reduce the resonant frequency of the piezoelectric, while maintaining high Q with very little mechanical damping, as mentioned in chapter 1 of [28]. In contrast, the UPT system is considered tightly coupled if the frequency response demonstrated by the admittance spectrum exhibit tall and sharp peaks (high Q). Alternatively, the frequency response (via the admittance spectrum) of a tightly coupled system should show obvious changes when electrically loaded. The damping of the electrical load contributes to the mechanical damping of the pickup transducer, and is directly reflected onto the primary transducer given the system is tightly coupled. Load damping will not be clearly observed at the primary transducer in a non-tightly coupled system.
The power transfer capability increases as the coupling quality improves, because the quality factor Q of the LCR branches is higher. A high Q implies low damping at resonance, and the system appears as a low impedance to the power supply. Thus, at a constant supply voltage, more current and thus more power will be delivered to a high Q system. The upper limit of the power transfer capability is characterized by the frequency response of the transducer and the medium separately. If a high Q transducer is considered with a damped medium (very different in acoustic impedance to the transducer), then the power transfer capability is limited by the damped medium and vice versa. The geometry of the medium may also limit, or enhance the system; however, this paper has not investigated the frequency response of different geometric structures of the medium.
V. EXPERIMENTAL SETUP
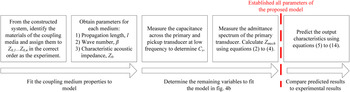
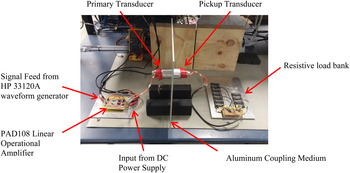
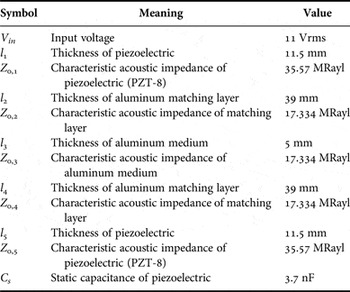
To verify the proposed model, a pair of SMBLTD45F28H Langevin-type piezoelectric transducers from Steiner & Martins, Inc. was bolted onto an aluminum plate measuring 350 × 350 × 5 mm3. The Langevin-type piezoelectric is constructed from a layer of PZT-8 material, bolted together with an aluminum matching layer. The transducer is driven using the PAD108 power operational amplifier from PowerAmp Design, with a sinusoidal signal feed from a HP 33120A waveform generator. The Agilent E4980A Precision LCR meter was used to measure the input admittance of the system from the primary transducer from 20 to 32 kHz at intervals of 20 Hz. Experimental data were collected at an interval of 0.5 kHz between 20.0 and 32.0 kHz, but at 0.1 kHz interval between 25.5 and 28.0 kHz. The Fluke 187 True RMS Multimeter was used to measure all the voltages and currents. Figure 6 presents a flowchart summarizing the modeling process and the required measurements. Figure 7 shows a photograph of the setup. Table 2 presents the system parameters for the model illustrated in Fig. 4(a).
Flowchart summarizing the measurement process required to determine the parameters of the proposed model.

Photograph of the experimental setup.

System parameters for the model.

VI. SIMULATION AND EXPERIMENTAL VERIFICATION
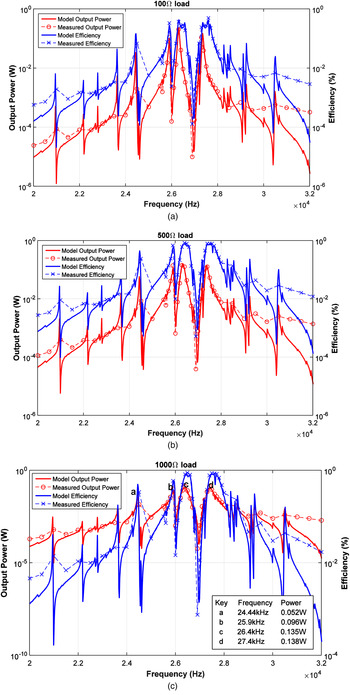
Figures 8(a–c) presents the predicted output power and transmission efficiency compared with measurements for 100, 500, and 1000 Ω loads. The model accurately predicted the output characteristics of the system, as the predicted output power and the corresponding efficiency plotted in Fig. 8 are in strong agreement with the experimental results. The efficiency of the system was evaluated using (14), the output power P out divided by the input apparent power S in . The maximum efficiency recorded is 88.47% with the 1000 Ω load, while transferring 78 mW. The efficiency is expected to be similar when the input voltage is boosted to increase power transfer. The recorded efficiency values are similar to the values in [Reference Bao6, Reference Bao10], achieving efficiencies of 87–88% for 100 W and 1 kW power transfer, albeit for a short duration. The peaks of efficiency are observed at a frequency slightly higher than the peaks in output power. Thus, for a fixed load, the performance of the system can switch between peak output power and peak efficiency by controlling the frequency.
The predicted output power and efficiency plotted with the measured for (a) 100 Ω load, (b) 500 Ω load, and (c) 1000 Ω load with peak power labels.

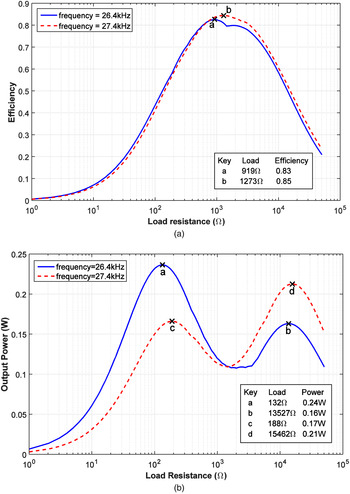
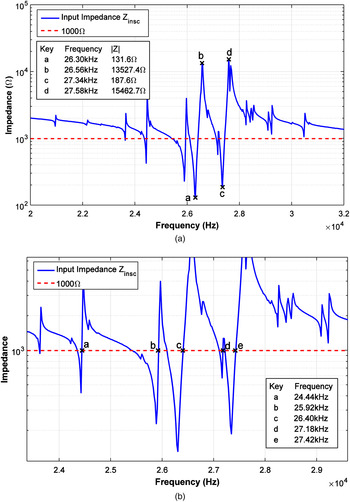
Figures 9(a) and 9(b) plot the predicted efficiency and the predicted output power against the load resistance, respectively for the two dominant resonant points about 26.4 and 27.4 kHz. The maximum efficiency predicted is 82.76% with a 919 Ω load for the 26.4 kHz resonant point, and 84.54% with a 1273 Ω load for the 27.6 kHz resonant point. The maximum power is transferred at 132 Ω load impedance for the 26.4 kHz resonant point, and 15.46 kΩ for the 27.6 kHz resonant point. There are two peaks in output power for each resonant branch, the first is at series resonance (the lower impedance), and the other at parallel resonance (the higher impedance). This is because maximum power is delivered to the load when the reactive part of the source component is minimum, which corresponds to the series or parallel resonant points of the UPT system. This is in agreement with the maximum power transfer theorem for a purely resistive load. The series and parallel resonant points about 26.4 and 27.4 kHz are highlighted in the input impedance Z in,sc spectrum shown in Fig. 10(a), which corresponds to the load impedances exhibiting peak output power labeled in Fig. 9(b). The load corresponding to maximum efficiency can be approximated by the input impedance of Z in,sc at the frequency average of the series and parallel resonant pair.
Variation of (a) efficiency, and (b) output power, plotted against load resistance at the two dominant resonant points around 26.4 kHz (blue) and 27.4 kHz (red).

(a) Impedance of the system observed from the terminal of the pickup transducer. This is equivalent to the impedance Z in,sc . The dotted line shows the load impedance at 1000 Ω. The series (minimum) and parallel (maximum) resonant modes are labeled for the two dominant branches. (b) Close-up of the intersection between load impedance and observed impedance. The annotated rising edge intersections correspond to the frequencies of peak power transfer for the 1000 Ω load condition.

The peaks in output power can be tracked using the method described in Section IV-B. Figure 10 plots the input impedance with the pickup transducer terminals short circuited, Z in,sc , along with a fixed 1000 Ω load. The magnitude of the impedance Z in,sc may be equal to the load resistance at multiple frequencies. These intersections occur as a pair for some resonant branches, one on the falling edge and the other the rising edge. The falling edge is typically closer to the parallel resonance of the system, and the rising edge is closer to the series resonance. A series resonance appears as low impedance, so at a constant supply voltage, more current is delivered than its parallel counterpart having a high impedance. Therefore, the rising edge intersection points correspond to the peaks in the output power plot as power transfer is determined by the voltage and current delivered to the piezoelectric. Figure 10(b) highlights the rising edges when the load is at 1000 Ω. The frequencies of intersection present a strong agreement to the frequencies of output power peaks shown in Fig. 8(c). Thus, the frequencies corresponding to peak output power are identified, and frequency-tracking techniques for variable dynamic loads can be implemented using this method.
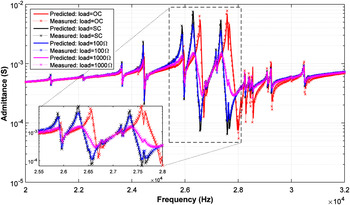
Predictions of the input admittance from the model are compared with the measured admittance of the constructed system. Figure 11 shows the predicted input admittance compared with measurements when observed from the terminals of the primary piezoelectric transducer for various load conditions. The model predicted the input admittance with a minimum accuracy of 92.5% for all the loading conditions tested. The frequency where the peaks are observed shift higher as the load increases from short circuit to open circuit, this supports the analysis in Section IV-C. The peaks of the 1000 Ω load spectrum is significantly smaller and flatter, suggesting the resonant modes have relatively low Q compared with the other loads that are less damped by the load. This also supports the discussion in Section IV-C, that load damping decreases the Q of the peaks.
The predicted (solid line) and measured (dotted line with crosses) input admittance for open circuited, short circuited, 100, and 1000 Ω load impedances.

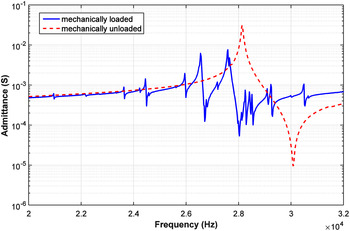
As mentioned in Section IV-D, the quality factor Q of the resonant branches should be high for a tightly coupled system, resulting in sharp resonant peaks in the admittance spectrum. The constructed UPT system exhibits sharp peaks on the admittance spectrum, and the electrical load also clearly changes the primary admittance spectrum as shown in Fig. 11, verifying the constructed system is tightly coupled. Figure 12 presents two admittance spectra of the Langevin-type piezoelectric: when the transducer is mechanically loaded by the aluminum coupling medium system, and when the transducer is mechanically unloaded (piezoelectric coupled to air only). The frequency response of the unloaded condition clearly shows one dominant resonant mode with a tall sharp peak, resembling a high Q. The mechanically loaded condition shows multiple sharp peaks, but at lower magnitudes compared to the unloaded condition because the aluminum plate mechanically loads and damp the piezoelectric. The resonant frequency of the loaded condition also shifted lower because the mass of the piezoelectric effectively increases when coupled to the aluminum plate as suggested in (16). The medium loaded and changed the frequency response of the piezoelectric transducer by shifting its resonant frequency and introducing extra modes of vibration. This shows the physical structure of the system effectively characterizes the piezoelectric frequency response.
Admittance spectrum of the piezoelectric mechanically loaded by the experimental setup (blue), and the piezoelectric unloaded or coupled to air (red).

VII. CONCLUSION
This paper proposes an accurate model for tightly coupled UPT systems based on the admittance spectrum of the primary transducer, and parallel LCR branches are used to characterize the mechanical response of the system. It is found that the tightness of the physical bond between the transducer and medium affects the quality factor Q of the piezoelectric frequency response, which corresponds to the mechanical response of the system. The model reveals that the power transfer performance correlates to the quality factor of the mechanical response, which is represented by the LCR branches. A method to identify the operating frequencies corresponding to the peaks in the output power has been developed by tracing the load along the input impedance spectrum with the pickup transducer short circuited. The model has also been used to accurately predict the output power and efficiency under different loading conditions. For future research and development, the model provides a useful basis for frequency and load control techniques for achieving maximum power transfer and efficiency for tightly coupled systems.
 Ho Fai Leung received the B.E. (Hons.) degree, in 2013, from the University of Auckland, Auckland, New Zealand, where he is currently working toward the Ph.D. degree. His current research interests include modeling and design of ultrasonic power transfer systems.
 Aiguo Patrick Hu (M'01–SM'07) received the B.E. and M.E. degrees from X'ian JiaoTong University, Xi'an, China, in 1985 and 1988, respectively, and the Ph.D. degree from the University of Auckland, Auckland, New Zealand, in 2001. He served as a Lecturer and the Director with the China Italy Cooperative Technical Training Center, Xi'an. He was with the National University of Singapore, Singapore, as an Exchange Research Fellow. He has published more than 130 referred journal and conference papers, authored the first monograph on wireless inductive power transfer technology, and contributed four book chapters on inductive power transfer modeling/control and electrical machines, and holds 15 patents in wireless/contactless power transfer and microcomputer control technology. His current research interests include wireless/contactless power transfer and application of power electronics in renewable energy systems.