INTRODUCTION
Huntington’s disease (HD) is a fatal neurological disorder characterized by involuntary movements, impairment of voluntary movement, elevated psychiatric abnormalities, and cognitive decline. Caused by a mutation of expanded trinucleotide cytosine, adenine, guanine (CAG) repeats in the autosomal dominant Huntingtin gene (HTT), this debilitating disease affects 12.3 to 17.2 people per 100,000 in the Western world (Evans et al., Reference Evans, Douglas, Rawlins, Wexler, Tabrizi and Smeeth2013; Fisher & Hayden, Reference Fisher and Hayden2014). Clinical diagnosis requires the presence of an otherwise unexplained movement disorder in a participant at risk for HD. Since the 2001 Huntington Study Group publication showing that marked cognitive impairment predicted the prospective diagnoses of 70 of 260 at-risk individuals, the field witnessed an explosion of publications showing cognitive, psychiatric, and motor dysfunction in persons at-risk for HD (Paulsen, Long, Johnson, et al., Reference Paulsen, Zhao, Stout, Brinkman, Guttman, Ross and Shoulson2001, Reference Paulsen, Magnotta, Mikos, Paulson, Penziner, Andreasen and Nopoulos2006, 2008a, Reference Paulsen, Long, Johnson, Aylward, Ross and Williams2014). Recently, an issue of the Movement Disorder Society journal described “stages” of HD before diagnosis (Reilmann, Leavitt, & Ross, Reference Reilmann, Leavitt and Ross2014).
Premanifest HD means the individual has undergone testing and has CAG mutation but has no symptoms or signs. Prodromal HD (prHD) means the individual has undergone testing, has CAG mutation, and has symptoms or signs but does not meet motor criteria for diagnosis. While it is still unknown what brain dysfunction contributes to the length of time an individual stays in premanifest or prodromal phases of this disease before obtaining a clinical diagnosis, there are distinct changes that occur during this time. The purpose of this study is to determine which subcortical gray matter volumes relate to measures of the HD phenotype, including measures of cognitive, motor, psychiatric, and functional manifestations.
The PREDICT-HD study is a longitudinal study of over 1100 premanifest and prHD participants, or those individuals who had predictive testing and have the HD gene mutation but no diagnosis (Paulsen, Long, Ross, et al., Reference Paulsen, Magnotta, Mikos, Paulson, Penziner, Andreasen and Nopoulos2006, 2008a, Reference Paulsen, Long, Johnson, Aylward, Ross and Williams2014). Designed to provide a more definite time window of disease manifestation, the PREDICT-HD study tracks premanifest and prHD participants and evaluates biological and clinical changes (Paulsen et al., 2008b). A variety of studies using the PREDICT-HD dataset identified cognitive, motor, psychiatric, and functional changes within this population before motor diagnosis. This study builds on the previous work of the PREDICT-HD group by analyzing a comprehensive set of cognitive, motor, psychiatric, and functional measures and characterizing their associations with brain volumes associated with HD pathology.
There is still not a consensus about which measures best relate to the underlying neuropathology of the premanifest stages of HD. The goal of this study is to determine which domains are most highly associated with subcortical basal ganglia (BG) volumes. These relationships may help elucidate changes in phenotype and symptom severity in the premanifest and prodromal populations.
CLINICAL PROFILE OF PRODROMAL HD
The prHD individuals often exhibit deficits in executive function tasks, including those involving cognitive control, working memory (Harrington et al., Reference Harrington, Smith, Zhang, Carlozzi and Paulsen2012; Snowden, Craufurd, Thompson, & Neary, Reference Snowden, Craufurd, Thompson and Neary2002; Stout et al., Reference Stout, Paulsen, Queller, Solomon, Whitlock, Campbell and Aylward2011; Williams et al., Reference Williams, Kim, Downing, Farias, Harrington, Long and Paulsen2015). Across studies involving prHD, participants perform significantly worse than controls on a wide variety of tasks. In one publication from the large PREDICT-HD study involving over 900 prHD individuals (Stout et al., Reference Stout, Paulsen, Queller, Solomon, Whitlock, Campbell and Aylward2011), findings show that controls outperformed prHD individuals in 16 of 19 cognitive tasks. A longitudinal analysis of PREDICT-HD data detected a decline in performance in many cognitive domains. There is widespread evidence that prHD individuals exhibit cognitive deficits and that these deficits increase over time. However, exactly which specific measurements of the HD phenotype best track disease progression in relation to brain changes has not yet been established.
Harrington et al. (Reference Harrington, Smith, Zhang, Carlozzi and Paulsen2012) conducted a factor analysis on a targeted subset of the neuropsychological measures from the PREDICT-HD study and found that a factor structure involving speed and inhibition, verbal working memory, motor planning and speed, attention and information integration, sensory and perceptual processing, and verbal learning, and memory best form distinct factors within these data. Findings suggested that cognitive domains related to motor planning and sensory-perceptual processing most strongly predicted time to diagnosis, after taking into account age, the number of CAG repeats, and motor symptom severity. These results have not been analyzed in combination with brain volumes in a prHD population.
Although we anticipate that we will find similar cognitive factors within this analysis of the larger phenotypic dataset, for this study, we build upon previous findings by including the subcortical brain volumes and analyzing a larger set of clinical measures that encompasses a wider range of disease manifestation. We chose to use a clustering analysis on a superset of clinical variables (including all three primary components of HD: cognitive, motor, and psychiatric severity) as well as functional capacity. The benefit of the cluster analysis is that it enables us to use all clinical domains in our study. The Harrington analysis only used cognitive factors to predict time to diagnosis, but we wanted to examine how all HD clinical domains related to subcortical brain volumes.
Psychiatric symptoms are typically elevated in premanifest individuals relative to controls. Publications emphasize depression, obsessive-compulsive symptoms, and apathy in most of the research investigating the psychiatric phenotype of HD. Depression is a common symptom in prHD and has been documented at a prevalence rate as high as 59%, and depressive symptoms can increase with time to onset (Epping et al., Reference Epping, Mills, Beglinger, Fiedorowicz, Craufurd, Smith and Paulsen2013; Julien et al., Reference Julien, Thompson, Wild, Yardumian, Snowden, Turner and Craufurd2007; Naarding, Joost, Janzing, Eling, van der Werf, & Kremer, 2009; Vaccarino et al., Reference Vaccarino, Sills, Anderson, Bachoud-Levi, Borowsky, Craufurd and Evans2011). Individuals in the premanifest and prodromal phases of HD are 15–88 times more likely to experience apathy than gene-negative individuals, and some report prevalence rates as high as 62% (Duff et al., Reference Duff, Paulsen, Beglinger, Langbehn and Stout2007; Martinez-Horta et al., Reference Martinez-Horta, Perez-Perez, van Duijn, Fernandez-Bobadilla, Carceller, Pagonabarraga and Kulisevsky2016). Apathy is commonly present in the absence of other depressive symptoms in other movement disorders (Duff et al., Reference Duff, Paulsen, Beglinger, Langbehn and Stout2007; Levy et al., Reference Levy, Cummings, Fairbanks, Masterman, Miller, Craig and Litvan1998; Litvan, Paulsen, Mega, & Cummings, Reference Litvan, Paulsen, Mega and Cummings1998; Naarding et al., Reference Naarding, Janzing, Eling, van der Werf and Kremer2009). Irritability, aggression, and obsessive-compulsive behaviors are also elevated in HD (Beglinger et al., 2008; Epping et al., Reference Epping, Kim, Craufurd, Brashers-Krug, Anderson, McCusker and Paulsen2015; Julien et al., Reference Julien, Thompson, Wild, Yardumian, Snowden, Turner and Craufurd2007; Kloppel et al., Reference Kloppel, Chu, Tan, Draganski, Johnson and Paulsen2009). Many individuals involved in these studies know they will eventually develop HD, and this many account for some of the elevated psychiatric symptoms, as this can put an enormous amount of psychological stress on affected individuals. However, because some psychiatric symptoms increase as time to diagnosis decreases, it may be that brain correlates related to disease progression underlie psychiatric symptoms (Marin, Reference Marin1991; Pla, Orvoen, Saudou, David, & Humbert, Reference Pla, Orvoen, Saudou, David and Humbert2014).
IMAGING PROFILE OF prHD
Multiple morphological and structural changes are detectable in individuals with expanded CAG repeats well before clinical diagnosis. Atrophy in the striatum is the most consistently reported imaging sign of early HD and is the most common finding across prHD studies, including PREDICT-HD and TRACK-HD (Aylward, Liu, et al., Reference Aylward, Liu, Nopoulos, Ross, Pierson, Mills and Paulsen2011; Halliday et al., Reference Halliday, McRitchie, Macdonald, Double, Trent and McCusker1998; van den Bogaard et al., Reference van den Bogaard, Dumas, Acharya, Johnson, Langbehn and Scahill2011; Wolf et al., Reference Wolf, Thomann, Thomann, Vasic, Wolf, Landwehrmeyer and Orth2013). Structural abnormalities in regions of the accumbens and pallidum often show correlations with clinical variables, but findings are not consistent across studies. Nearly all studies identified neuropsychological and psychiatric variables that relate to brain volumes, but exactly which measures relate to brain volumes is not consistent. This study uses variable reduction to consider these relationships using a large sample in an effort to replicate and possibly clarify mixed findings.
Multiple studies identified the caudate and putamen as areas highly sensitive to CAG expansion, and related to cognitive function (Aylward, Nopoulos, et al., Reference Aylward, Liu, Nopoulos, Ross, Pierson, Mills and Paulsen2011; Jech et al., Reference Jech, Klempir, Vymazal, Zidovska, Klempirova, Ruzicka and Roth2007; Paulsen et al., Reference Paulsen, Nopoulos, Aylward, Ross, Johnson, Magnotta and Nance2010; Tabrizi et al., Reference Tabrizi, Scahill, Durr, Roos, Leavitt, Jones and Stout2011). Within the prHD population, BG volumes are often related to a variety of clinical measures including tests of disinhibition, speed, attention, working memory, planning and problem-solving, organization, learning, and motor symptoms (Aylward et al., Reference Aylward, Harrington, Mills, Nopoulos, Ross and Long2013; Harrington et al., Reference Harrington, Liu, Smith, Mills, Long, Aylward and Paulsen2014). In a large study with PREDICT-HD data, both putamen and caudate volumes were associated with performances on the Symbol Digit Modalities Test (SDMT), an emotion recognition test, and a task requiring internal timing (Harrington et al., Reference Harrington, Liu, Smith, Mills, Long, Aylward and Paulsen2014). Using cluster analyses, we anticipate similar relationships using aggregated measures of cognition, as well as psychiatric symptoms, motor abnormalities, and functional capacity with BG volumes.
We anticipate a negative relationship between motor scores and imaging measures of the BG (i.e., caudate, putamen, and globus pallidus volumes). Better performances on some tests of cognition should be related to greater putamen, caudate, and globus pallidus volumes as reported in similar studies. Additionally, we anticipate that the more severe psychiatric symptoms will be associated with nucleus accumbens volume.
METHODS
Participants
For this study, we used all prodromal HD individuals in the PREDICT-HD study (Paulsen et al., Reference Paulsen, Long, Johnson, Aylward, Ross and Williams2014) who had imaging measures collected at the same time as clinical measures. Individuals without the HTT expansion were not included. This study was approved at each site where data was collected, and all data was shared in accordance with the University of Iowa and Georgia State University Institutional Review Boards. The number of CAG repeats in the mutant HTT gene was determined from a blood sample for each participant. Any individual with a CAG repeat length greater than 35 is considered premanifest (Walker, 2007), and only these individuals were considered for this analysis.
Because age has a differential effect on predicted time to diagnosis across different levels of CAG repeat lengths, we chose to use a derived variable, the CAG by Age Product (CAP score), where CAP=age × (CAG – 33.66) (Zhang et al., Reference Zhang, Long, Mills, Warner, Lu and Paulsen2011). For this cross-sectional analysis, we analyzed the first time point from each participant that included both a T1-weighted structural magnetic resonance image (MRI) of sufficient quality for subcortical segmentation, and the full battery of cognitive, motor, psychiatric, and functional measures at the same time the scans were collected. CAP was calculated based on age at the time of data collection.
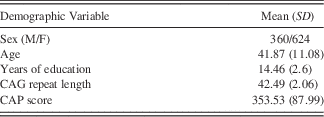
Participants include 984 prodromal HD individuals (Mean age=41.87 years; SD=11.08). Our sample contained 684 females and 324 males. Although this gender imbalance is not representative of the HD population, it is consistent with other premanifest studies, such as TRACK, COHORT, and PHAROS. Nevertheless, we controlled for gender in all of our models to ensure that the effects identified were not driven by an unequal gender distribution. Demographic information for the HD phenotype cluster analysis is displayed in Table 1. We used data from the same pool of participants for both the cluster and the regression analyses.
Participant characteristics for the cluster and regression analyses

Note. N=984, M/F=male/female, SD=standard deviation.
Clinical Variables
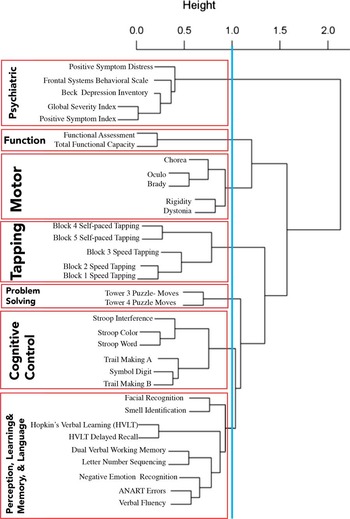
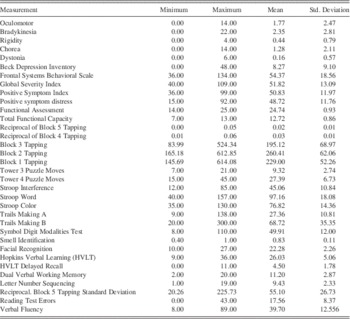
The PREDICT-HD data set includes 34 measures of clinical phenotype, including performance-based neuropsychological assessments, clinician-reported motor ratings, self- and companion-reported psychiatric ratings, and self- and companion-reported functional capacity, listed in Figure 1 and Appendix 1. A short description of the measures is included in the supplementary material. Not all individuals had complete data. Each assessment’s values were Z-scored across all available premanifest HD participants before statistical analyses.
Results from the hierarchical cluster analysis. Interpretation of the clusters is conducted using the cutoff point as well as the distance shown between each classification dissection. For instance, the first three subdivisions are more robust than the next four using distance parameters. The blue line depicts our cut-point, and the red line indicates our cluster score groups. Bold lettering on the left depicts the name of the cluster, and in smaller text are the names of individual measures used to calculate each cluster score.

Cluster Analysis
We performed a hierarchical cluster analysis using the hclust package in R on the Z-scored clinical measures. The median number of pairwise complete observations was 803, with a range of 702 to 984. To perform a hierarchical cluster analysis, a dissimilarity matrix is constructed based on the distance between two variables defined as [1-abs (Spearman’s rank correlation)]. Ward’s minimum variance method (Ward, 1963) was applied which merges clusters based on the optimal value at each step. We chose an inconsistency value of 1, as shown in Figure 1, that divided the measures into specific clusters encompassing specific phenotypic domains, which we labeled as: Perception, Learning/Memory, and Language; Cognitive Control; Problem-solving; Tapping; Motor ratings; Function; and Psychiatric symptoms.
Average cluster scores for each participant were computed based on their scores for each measure in the cluster. That is, each of their Z-scored values from each measure in the cluster was summed and averaged. To maintain consistency in our interpretation, a higher numerical score for a cluster indicated higher functioning, greater levels of clinical distress, better cognitive performances, or more severe motor symptoms. Only individuals who had all the measures from each cluster received a score for that cluster.
As shown in Figure 1, using 1.0 as the cutoff, the data clustered into seven clinical phenotype domains for HD, which we labeled (1) Psychiatric, (2) Function, (3) Motor, (4) Tapping, (5) Problem-solving, (6) Cognitive Control, and (7) Perception, Learning/Memory, and Language. The findings show that the data first divided into two large clusters at 2.0 separating Psychiatric from all other measures. The second division occurred at 1.5 separating Motor ratings and Function from all other measures. The third division separated the Tapping measures from all other cognitive performance-based measures and the fourth division partitioned the Problem-solving from the remaining cognitive outcomes. The final separation that is above the 1.0 cut-off is the separation of the Stroop Color Word test, SDMT, and the Trail Making Test (Cognitive Control) from the remaining eight cognitive measures. The next two clusters that may have occurred and are relatively close to the cutoff score would separate components of the motor exam (chorea/oculo/brady vs. rigid/dystonia) and would separate sensory/perceptual outcomes from the remaining cognitive scores.
Scanning Parameters
High resolution anatomical MR images were collected at 32 collection sites using General Electric, Phillips, and Siemens scanners with field strengths of 1.5T or 3T (Tesla), using standard acquisition parameters. T1 images at each site were obtained using three-dimensional (3D) T1-weighted inversion recovery turboflash (MP-RAGE) sequences. Parameters for the 3T scans were similar to the following: GRAPPA factor, 900 ms TI (inversion time), 2530 ms TR, 3.09 ms TE, 256×256 mm Field of View (FoV), 10° flip angle, 2240 coronal slices with 1 mm slice thickness, 256×128 matrix with 1/4 phase FoV, 220 Hz/pixel receiver bandwidth.
The protocol for 1.5T scanners commonly involved a sagittal localizing series followed by acquisition of an axial 3D volumetric spoiled GRASS (Gradient Recalled Acquisition in Steady State) sequence, using the following scan parameters: ~1 × 1 × 1.5 mm voxel size, 18 ms TR (relaxation time), 3 ms TE (excitation time), 24 cm FoV (field of view), 20° flip angle, 124 slices with 1.5 mm slice thickness, 0 mm gap, 256×192 matrix with 3/4 phase FoV, NEX (number of excitations) of two. Images were aligned with the AC-PC (anterior cingulate-posterior cingulate) plane (Ghayoor, Vaidya, & Johnson, Reference Ghayoor, Vaidya and Johnson2013) and resampled with 1 mm isotropic voxels to correct for inhomogeneity (Kim, Magnotta, Lliu, & Johnson, 2014).
Brain Volumes
Individuals considered for this analysis had both T1-weighted images that were compatible for the BRAINSTools algorithm, and had undergone the full battery of motor, cognitive, psychiatric, and functional measures. From the structural T1 images, we extracted 16 brain volume measures using the BRAINSTools algorithm (Kim et al., Reference Kim, Magnotta, Liu and Johnson2014; Young Kim & Johnson, Reference Young Kim and Johnson2013). This analysis focuses on the subcortical volumetric measurements of the thalamus and components of the BG that include caudate, putamen, nucleus accumbens, and globus pallidus. To control for total intracranial volume (ICV), we calculated each brain volume as a percentage of ICV.
Statistical Analyses
To be able to compare which brain volumes were the most strongly related to each cluster score, we analyzed our five subcortical measures in one model for each cluster score. Linear mixed models (Verbeke & Molenberghs, Reference Verbeke and Molenberghs2000) were used to model the data. Various scanner strengths and types of scanners can image the brain differently, which is why it is crucial to model the site effects (Fennema-Notestine et al., Reference Fennema-Notestine, Gamst, Quinn, Pacheco, Jernigan, Thal and Gollub2007; Jovicich et al., Reference Jovicich, Czanner, Han, Salat, van der Kouwe, Quinn and Fischl2009; Moorhead et al., Reference Moorhead, Gountouna, Job, McIntosh, Romaniuk, Lymer and Lawrie2009). We modeled scanner site as a random effect, and all other variables were modeled as covariates. The outcome variables for the regression models were the cluster scores; the covariates were CAP score (which includes age), gender, years of education, and the independent variables of interest were five individual brain volume measurements (caudate, putamen, globus pallidus, nucleus accumbens, and thalamus).
Individuals who did not have all measures for a specific cluster score were not used in that specific cluster model, but may contribute to a different cluster score for which they had all measures. For example, if an individual did not have a score for the Stroop Color Word Test, he or she would not be included in the regression model for the Cognitive Control cluster, but if this individual had all blocks from the tapping tasks completed, their data would be used in the Tapping cluster regression model. This approach generated varying numbers of individuals within each model, and each model has its own number of participants, listed following the model results.
Because of the heterogeneity of the Perception, Learning/Memory, and Language cluster, we conducted a post hoc analysis in which we used individual cluster scores for the highest three subclusters: Learning/Memory [2 measures from the Hopkins Verbal Learning Test (HVLT)], Sensory-Perceptual identification (facial and smell recognition), and the remaining measures which included dual verbal working memory, letter number sequencing, negative emotion recognition, American National Adult Reading Test, and verbal fluency (i.e., Language cluster).
RESULTS
We reported full model statistics only for cluster scores that significantly related to brain volumes including estimates of the fixed effects, t scores and p values associated with independent variables of interest. All reported p-values have been corrected using false discovery rate correction in the “R stats” package (R, 2015) Full model statistics of all other cluster score results can be found in the supplementary material. As anticipated, years of education, gender, and CAP score were related to many of our cluster scores. Coefficient statistics for those variables are reported in the supplementary material along with a table of the results from each model. Reporting only significant findings, here we report on associations between brain imaging volumes with the Motor and Cognitive Control clusters and the post hoc findings of brain imaging volumes with the Learning/Memory and Language subclusters.
Motor Symptoms
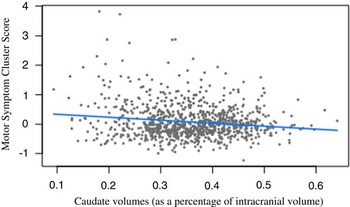
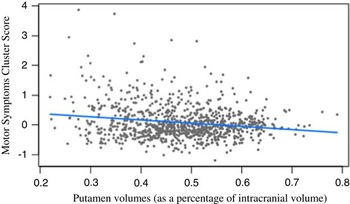
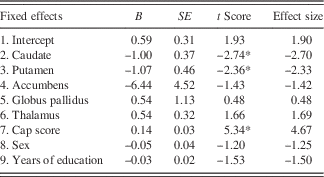
Caudate volumes (B=−1; t(936)=−2.74; p<.05) and putamen volumes (B=−1.07; t(936)=−2.36; p<.05) were both negatively related to motor symptoms (Table 2). As ratings of motor symptom severity increases, caudate and putamen volumes decrease (Figures 2 and 3).
Motor symptom cluster scores and caudate volumes (B=−1; t(936)=−2.74; p=.02). The blue line indicates regression line of best fit, and gray dots are data points.

Motor symptom cluster scores and putamen volumes (B=−1.07; t(936)=−2.36; p=.04). The blue line indicates regression line of best fit, and gray dots are data points.

Motor symptom cluster score mixed effects model

Note. N=568. CAP scores were positively related to motor symptom scores (B=.14, t(936)=5.34, p<.01), i.e., individuals with greater CAP scores showed more severe symptoms. SE=standard error.
* p<.05.
Cognitive Control
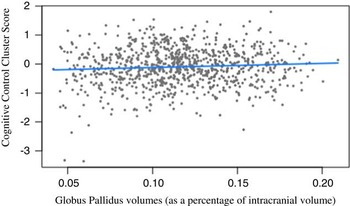
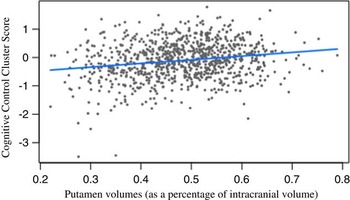
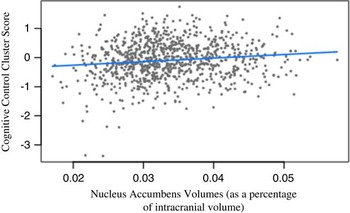
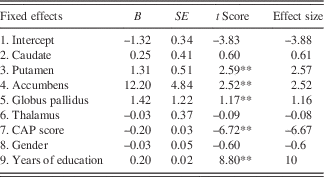
Three subcortical volumes were significantly related to Cognitive Control cluster scores: putamen (B=1.31; t(904)=2.59; p<.05), accumbens (B=1.22; t(904)=2.52; p<.05), and globus pallidus (B=1.42; t(904)=1.17; p<.05). As brain volumes decrease, Cognitive Control performances declined (Table 3; Figures 4–6).
Cognitive Control cluster scores and Globus Pallidus volumes. (B=1.42; t(904)=1.17; p=.03). The blue line indicates regression line of best fit, and gray dots are data points.

Cognitive Control cluster scores and putamen volumes. (B=1.31; t(904)=2.59; p=.02). The blue line indicates regression line of best fit, and gray dots are data points.

Cognitive Control cluster scores and nucleus accumbens volumes. (B=1.22; t(904)=2.52; p=.02). The blue line indicates regression line of best fit, and gray dots are data points.

Cognitive Control cluster score mixed effects model

Note. N=905. Both CAP score (B=−0.20, t(904)=−6.72, p<.01) and years of education (B=.2, t(904)=8.80, p<.01) were significantly related to Cognitive Control cluster scores. SE=standard error.
* p<.05.
** p ≤.01.
Learning/Memory Subcluster Analyses
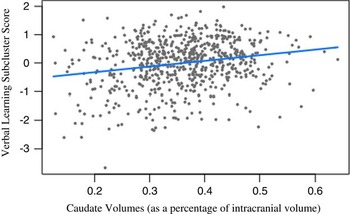
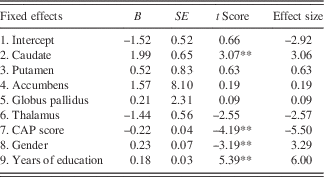
The Learning/Memory subcluster was related to caudate volumes. As caudate volumes decrease, performance on the HVLT worsens (B=1.99; t(664)=3.07; p<.01) (Table 4–10; Figure 7)
Verbal learning subcluster scores and caudate volumes. (B=1.99; t(664)=3.07; p=.005). The blue line indicates regression line of best fit, and gray dots are data points.

Verbal Learning subcluster mixed effects model

Note. N=666. Years of education were significantly related to verbal learning subcluster scores (B=0.18, t(665)=5.39, p<.01). CAP score was significantly related to verbal learning subcluster scores (B=−0.22, t(665)=−4.19, p<.01). Gender was significantly related to verbal learning subcluster scores, with women outperforming men (B=0.23, t(665)=−3.19, p<.01). SE=standard error.
* p<.05.
** p ≤.01.
DISCUSSION
Findings from this study illustrate a statistically driven model of the progression of the HD clinical phenotype that is validated with strong associations of decreased volumes of the BG. Findings support previous work supporting that MRI volumes of caudate and putamen are the most robust and commonly cited regions of atrophy in prHD (Paulsen et al., Reference Paulsen, Magnotta, Mikos, Paulson, Penziner, Andreasen and Nopoulos2006, Reference Paulsen, Nopoulos, Aylward, Ross, Johnson, Magnotta and Nance2010; van den Bogaard et al., Reference van den Bogaard, Dumas, Acharya, Johnson, Langbehn and Scahill2011). Furthermore, our findings show that additional BG atrophy is associated with measures of cognitive control, motor symptom severity, and verbal learning.
As hypothesized, striatum volumes significantly relate to motor symptom severity. The estimate of the putamen volume regression coefficient against motor symptom scores was not drastically different from that of the caudate, indicating that both volumes are relatively equally related to motor symptom scores. Even though this population does not show motor symptoms at a level that qualifies for full motor diagnosis, motor abnormalities are evident and significantly related to caudate and putamen volume loss.
It was surprising that we did not find significant relationships between motor speed performance based on measures of finger tapping and BG volumes. This could be a result of the combination of specific tapping tasks used to create the Tapping cluster score, although the tasks include those used by several other studies and papers. There is a difference between our approach to the tapping task and others’ findings. Our goal was to use the most measures to determine whether cluster analyses could provide variable reduction for more stable measures for clinical trial assessment, other papers have used one or two tapping measures that showed the greatest effect sizes. The tapping tasks included here involve dominant finger tapping, non-dominant finger tapping and dual thumbs tapping. We also used all measures from the timed tapping task which requires subjects to keep pace with a metronome. Given the variety of tasks in this measure, the association with the rather large brain measures captured here may lacked sensitivity to document specific circuits for these motor tasks.
Alternatively, while prodromal HD individuals do experience impaired performance on both speeded and paced tapping tasks, it has been suggested that motor speed may be more related to metabolic functions within the striatum rather than directly related to volume loss (Herben-Dekker et al., 2014; Joost, Raymund, Leenders, & Spikman, Reference Joost, Raymund, Leenders and Spikman2014). We recommend future research in movement disorders consider carefully the dissection of clinical outcome measures for motor components as has been successfully done in other papers (O’Rourke et al., Reference O’Rourke, Beglinger, Smith, Mills, Moser and Rowe2011).
Some of our previous research also suggests that paced tapping may be impaired earlier than speeded tapping in prHD which could also account for our findings, as these scores were both included in the tapping cluster scores (Paulsen, Reference Paulsen2010). These findings are highly consistent with others and efforts to better assess subtle aspects of motor abnormalities in premanifest HD and prHD is of high importance for early HD detection and the future of preventive clinical trials in this disease. Our findings might be interpreted as arguments against using composite scores for HD clinical trials.
The Cognitive Control cluster scores were comprised of a variety of common tasks that primarily measure aspects of basic and higher-level attention and inhibitory control. Putamen, accumbens, and globus pallidus volumes were significantly related to Cognitive Control cluster scores. These findings reflect others suggesting that these highly sensitive tasks may be critical for early detecton and tracking of HD in the premanifest stages. In the literature, these regions are also associated with cerebellar-frontal cortex loops that are responsible for exercising cognitive control (Dalley, Everitt, & Robbins, Reference Dalley, Everitt and Robbins2011; Leisman, Braun-Benjamin, & Melillo, Reference Leisman, Braun-Benjamin and Melillo2014).
Within the indirect and direct pathways of the BG, that modulate input from the frontal cortex to control motor movements, the striatum is the first region of the BG that receives input from various frontal regions (Alexander & Crutcher, Reference Alexander and Crutcher1990). From a cognitive perspective, the indirect pathway is important in suppressing unwanted behavior and the direct pathway selects the appropriate behavioral responses (Leisman et al., Reference Leisman, Braun-Benjamin and Melillo2014). It follows that damage to the striatum in the form of atrophy would impact the cognitive selection processes that are crucial to cognitive control (Elliott, Reference Elliott2003).
Previous research suggests that the globus pallidus and the nucleus accumbens mediate the participation of the frontal executive areas during tasks of cognitive control, and that atrophy in this region may elicit poor performance on such tasks (Elliott, Reference Elliott2003). Additionally, the nucleus accumbens has a larger effect size than the other subcortical volumes, and this could be a result of the nucleus accumbens’ involvement in apathy, a clinical symptom prevalent in this population (Marin, Reference Marin1991; Naarding et al., Reference Naarding, Janzing, Eling, van der Werf and Kremer2009). Within HD and other subcortical diseases, increased apathy is related to decreased performance in tasks of cognitive control (Meyer et al., Reference Meyer, Zimmermann, Gschwandtner, Hatz, Bousleiman, Schwarz and Fuhr2014; Vaccarino et al., Reference Vaccarino, Sills, Anderson, Bachoud-Levi, Borowsky, Craufurd and Evans2011). Increased apathy or depressed mood as a result of caudate degeneration could also impact cognitive control, although our Psychiatric cluster showed no significant findings with our MRI measures.
The caudate is an important site for the suppression of unwanted behavior, a crucial aspect of cognitive control (Elliott, Reference Elliott2003). Although we did anticipate that both caudate and putamen volumes would be related to cognitive control, our findings identified a significant relationship between putamen volumes and cognitive control cluster scores (Elliott, Reference Elliott2003; Harrington et al., Reference Harrington, Liu, Smith, Mills, Long, Aylward and Paulsen2014; Unschuld et al., Reference Unschuld, Joel, Liu, Shanahan, Margolis, Biglan and Ross2012). Although it could be the case that atrophy in the caudate does not explicitly affect performance on the measures used in our study, or that compensation by other brain regions mitigates a drop in performance (Malejko et al., Reference Malejko, Weydt, Sussmuth, Gron, Landwehrmeyer and Abler2014), we do not consider this an appropriate interpretation. Many other studies have identified caudate involvement in cognitive control tasks, including our own. We (and others) found that caudate measures are often less reliable than the putamen measure; it has been suggested that, since the caudate is located by ventricles, accurate volumes are more difficult to acquire (Whalley & Wardlaw, Reference Whalley and Wardlaw2001). Additional recent research using connectivity measures are showing promise as a brain marker for impaired cognitive control (Harrington et al., Reference Harrington, Rubinov, Durgerian, Mourany, Reece, Koenig and Rao2015; Koenig et al., Reference Koenig, Lowe, Harrington, Lin, Durgerian, Mourany and Rao2014).
We did not find significant relationships between brain volumes and the Perception, Learning/Memory, and Language cluster when analyzed as a whole. This may be a result of the fact that this cluster is comprised of more heterogeneous cognitive demands. It may also be a result of the fact that individuals in the prodromal and premanifest stages of HD have relatively intact premorbid intellect and do not yet exhibit impaired performance on many of the language-based tasks. This also may explain why some of the more executive control tasks in this cluster, such as verbal fluency or working memory, may not group together with other cognitive control tasks. Verbal performance is mostly spared in this population and has been used in the past as a method to separate so-called “subcortical” from traditionally “cortical” dementias. Since primary language and memory storage are not impacted by HD, it follows that these cognitive tasks failed to differentiate using cluster analyses. It has been shown that imaging findings in the premanifest stage suggest brain compensation from intact brain areas during performances traditionally dependent on the BG. It may be that the more intact perceptual, memory, and language skills are providing assistance for language-based cognitive control tasks. It is encouraging to note that cluster analyses provided strong face validity for the clinical phenotype of HD and did not simply reflect clustering of normal brain functions.
Many of the measures in the language and memory subclusters as well as the cognitive control cluster were also included in the Harrington et al. (Reference Harrington, Smith, Zhang, Carlozzi and Paulsen2012) factor analysis. Although these measures were related to each other at the level of our hierarchical cut-point, the large number of variables may be too much of a conglomeration of constructs to be meaningful. To investigate this further, we broke down this cluster score into its subdivisions similar to those used in the Harrington et al. (Reference Harrington, Smith, Zhang, Carlozzi and Paulsen2012) factor analysis, as the cognitive variables in the factor analysis grouped together at the same level of similarity as in the factor analysis. Only the verbal learning subcluster was linked to any of the brain volumes of interest, which is consistent with previous literature (Harrington et al., Reference Harrington, Liu, Smith, Mills, Long, Aylward and Paulsen2014). As caudate volumes decrease, performance on verbal learning tasks decreases. For future studies involving brain volumes, we will consider using this subcluster score.
Planning or problem-solving, as required by the towers task, may have less robust associations with the brain volumes of interest, and may be better analyzed in concert with functional or white matter measures. In previous research with this population, accuracy on the towers task decreased as striatum volumes decreased (Papp et al., Reference Papp, Snyder, Mills, Duff, Westervelt, Long and Paulsen2013). However, this finding was identified only in individuals that were close to disease diagnosis. The lack of significant findings in this study is most likely because we included all prodromal individuals in our dataset and did not stratify our analysis by estimated time to onset. Please note that all models showed a significant association with the covariate CAP score, which reflects disease burden. Future research should avoid clumping all premanifest together into one group and should more carefully separate stages of premanifest HD.
The lack of significant findings in the psychiatric symptom data could indicate that the psychological profile of prHD may have functional or metabolic neural correlates, or may be externally driven. Although researchers have identified clinical symptoms that relate to aberrant activation of specific brain regions within prHD, this activation may not be directly affected by striatum atrophy (Klöppel et al., Reference Klöppel, Stonnington, Petrovic, Mobbs, Tüscher, Craufurd and Frackowiak2010). The psychiatric cluster score includes a wide variety of symptoms ranging from depression to obsessive tendencies, to indices of psychiatric symptom severity and distress. Perhaps these symptoms may cancel each other out such that an individual who is very apathetic may not report high distress from these symptoms. The lack of significant findings in this analysis within the psychiatric cluster warrants an investigation into specific symptoms and their underlying neural correlates. It is possible that some aspects of the psychiatric profile of this population may not be a direct result of disease atrophy, and could be treated through psychiatric pharmacotherapy to provide homeostasis to circuitry dysfunction.
Our large sample size is a strength of this study. It lends to the validity and the applicability of our cluster scores for uses in future research with this population. A limitation of this study is that the only relationships we can investigate with these measures would be related to structural atrophy. No inferences can be made regarding brain function. However, after finding that our cluster scores show similar relationships between brain volumes to those previously published, we support the usage of cluster scores in future research with this population. Our cluster analyses subsumes previous factor analysis results published with a similar dataset and extends our earlier factor analysis with other symptoms in the HD clinical phenotype important in the clinical care and future research investigations in this disease.
This study identified clinical domains that are related to changes in gray matter volume in a prodromal HD population. Using the largest sample size to date to analyze broad clinical domains, it appears there are three primary clusters that relate to specific subcortical changes in the prodromal population: neuropsychological measures of cognitive control, clinician ratings of motor control, and standardized list learning assessments of verbal learning. Understanding the clinical changes associated with atrophy or other structural change has potential for developing a standardized set of measure for clinical trials. While previous studies have advanced our understanding of cognition in HD, few have performed such an analysis on such an extensive dataset covering multiple cognitive, motor, psychiatric, and functional domains in an attempt to reduce the amount of variables used for analysis, while at the same time retaining unique information from each measure of the HD clinical phenoptype.
ACKNOWLEDGMENTS
This project was supported by 5U01NS082074 (V.D. Calhoun and J.A. Turner, co-PIs) from the National Institutes of Health, National Institute of Neurological Disorders and Stroke. The PREDICT-HD study was supported by NIH/NINDS grant 5R01NS040068 awarded to Jane S. Paulsen; CHDI Foundation, Inc., A3917 and 6266 awarded to Jane S. Paulsen; Cognitive and Functional Brain Changes in Preclinical Huntington Disease (HD) 5R01NS054893 awarded to Jane S. Paulsen. We thank the PREDICT-HD sites, the study participants, the National Research Roster for Huntington’s Disease Patients and Families, the Huntington’s Disease Society of America and the Huntington’s Study Group. The authors certify that they have NO affiliations with or involvement in any organization or entity with any financial interest (such as honoraria; educational grants; participation in speakers’ bureaus; membership, employment, consultancies, stock ownership, or other equity interest; and expert testimony or patent-licensing arrangements), or non-financial interest (such as personal or professional relationships, affiliations, knowledge, or beliefs) in the subject matter or materials discussed in this manuscript. Authors Paulsen and Turner are senior authors.
SUPPLEMENTARY MATERIAL
To view supplementary material for this article, please visit https://doi.org/10.1017/S1355617716001132
Descriptive Statistics for all measures used in calculation of cluster scores. N=984.