I. INTRODUCTION
Micro-X-ray fluorescence (MXRF) was first demonstrated in the 1980s (Nichols et al., Reference Nichols, Boehme, Ryon, Wherry, Cross and Aden1987) and has been in use for ~25 years. In one of the first reported MXRF studies of actinide samples, Schoonover and Havrilla (Reference Schoonover and Havrilla1999) demonstrated the key benefits of MXRF (and micro-infrared) in determining elemental heterogeneity. In another actinide example, niobium heterogeneity was mapped and quantified in large depleted uranium plates using MXRF (Worley and Havrilla, Reference Worley and Havrilla2001). However, scanning electron microscopy (SEM) combined with energy dispersive X-ray analysis (EDX) has been used more often for examining nuclear materials, but often it is used for very high spatial resolution work (e.g., Ranebo et al., Reference Ranebo, Eriksson, Tamborini, Nigolova, Bildstein and Betti2007). While SEM EDX provides morphological and X-ray elemental mapping information at ultra high spatial resolution (Reed, Reference Reed1993; Scott et al., Reference Scott, Love and Reed1995), the technique has some significant limitations. It is best suited for smaller sub-millimeter area analysis. To avoid sample charging from the electron beam, samples must be coated with a conducting material such as carbon. Samples must be vacuum compatible, and elemental detection limits are relatively poor for medium and high atomic number elements (Reed, Reference Reed1993; Scott et al., Reference Scott, Love and Reed1995).
For elemental heterogeneity imaging over large cm2 areas where ultra high spatial resolution is not needed, MXRF can be a very useful tool. The typical MXRF beam diameter using a polycapillary optic is ≤50 μm, which provides more than sufficient spatial resolution for such large area imaging. In the current report, MXRF was used in several nuclear materials elemental imaging applications. These included particle analysis of a plutonium and neptunium oxide mixture, heterogeneity mapping of swipes taken from a plutonium work area, and elemental impurity heterogeneity mapping of plutonium metal. These applications demonstrated the power and advantages of MXRF for large area elemental mapping.
II. EXPERIMENTAL
A. Instrumentation
An EDAX Orbis PC instrument was used for this work containing a polycapillary optic to produce a 30 μm diameter X-ray beam. The system also uses a turret to switch to a 1 or 2 mm aperture for much larger area analyses. The instrument uses a 50 W rhodium anode and a 30 mm2 silicon drift detector. Source filters were also used to improve the signal-to-background ratio in many of the analyses. All analyses were performed in air rather than under vacuum because of the radioactive nature of the samples.
B. Neptunium/plutonium oxide
A few mg of the sample were attached to double-sided tape, sealed between the tape and a 7.5 μm Kapton film, and then the specimen was sealed inside a plastic specimen cup. The specimen was analyzed through the Kapton film. The data were collected using the capillary optic with the source operating at 40 kV and 950 μA using a 25 μm aluminum filter. An area of ~15 mm × 9 mm of the sample was mapped using 512 × 400 analysis points (some overlap between analysis spots) with a dwell time of 100 ms live time per point and a total image time of ~6 h.
C. Surface swipes
Cotton Texwipes were used to wipe the surfaces of a plutonium workstation and then sealed in plastic bags and analyzed through the bag wall. Half of the swipes (~4″ long × 2″ wide) were provided for MXRF to examine the residue collected on the cloth. Owing to the large sample size, a 2 mm aperture was used for imaging. The source was operated at 48 kV and 950 μA using a 25 μm nickel filter. An area of ~9.7 cm × 6 cm was mapped using 128 × 100 analysis points (full overlap between analysis spots) with a dwell time of 5.8 s live time per point and a total image time of ~22 h. A high-resolution map of a smaller area (~8 mm × 5 mm) of one of the swipes was imaged using the capillary optic with 256 × 200 analysis points, a dwell time of 4.8 s live time, and a total image time of ~72 h. The same source power settings and nickel filter were used.
D. Electro-refined (ER) plutonium metal
A ~350 mg piece was cut from a parent ER plutonium metal using wire cutters. The metal surface was polished with a stainless steel wire brush to remove surface oxide prior to analysis. The specimen was sealed between Teflon film and 6 μm Mylar using a plastic specimen cup and analyzed through the Mylar. The polycapillary optic was used to image the specimen. The source was operated at 45 kV and 950 μA. No source filter was used. An area of 4.2 mm × 3.3 mm of the sample was mapped using 256 × 200 analysis points (significant overlap between analysis spots) with a dwell time of 900 ms live time per point and a total image time of ~13.5 h.
III. RESULTS
A. Neptunium/plutonium oxide
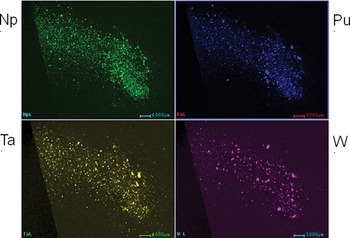
A mixture of neptunium oxide and plutonium oxide required dissolution for assay measurements (using concentrated hydrochloric acid and trace amounts of nitric and hydrofluoric acids in a heated, pressurized vessel). However, it contained an unidentified insoluble fraction. A portion of the parent material and the insoluble residue were submitted for XRF elemental identification and mounted as described in the Experimental section. Figure 1 shows the Np, Pu, Ta, and W Lα images collected from the specimen prepared from the parent material. As expected, the plutonium and neptunium constituents were detected; however, tantalum and tungsten particles were also found dispersed within the matrix. Such species have been found in other plutonium samples when insoluble material was present. These elemental constituents are commonly found in plutonium containment crucibles. Thus, detection of tantalum and tungsten contaminants was not surprising. The insoluble fraction was prepared for analysis after collection on filter paper and rinsing with deionized water. The analysis indicated that it was composed primarily of tungsten with trace amounts of plutonium present. No tantalum was detected. It is unclear why tantalum dissolved but tungsten did not, as both are typically difficult to dissolve in mineral acids.
Elemental images from neptunium/plutonium mixed oxide mounted on tape.

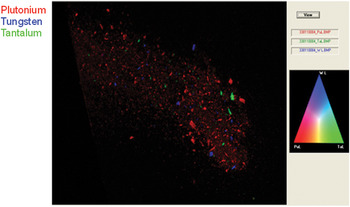
Overlaying the elemental images demonstrates the utility of MXRF to non-destructively locate particles of interest for potential extraction and analysis by other methods. A three-color overlay of the plutonium, tantalum, and tungsten elemental maps is shown in Figure 2. Distinct elemental phases were found; i.e., the tantalum and tungsten particles were neither associated with each other nor with the plutonium particles. If particles did contain more than one component, color mixtures of red, green, and blue would have been observed as per the RGB color scale shown.
Overlay of plutonium (red), tungsten (blue), and tantalum (green) from the neptunium and plutonium mixed oxide specimen.

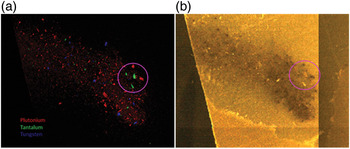
A correlation was found between some visible features and the tantalum and plutonium particles as circled in Figures 3(a) and 3(b). This demonstrates the potential to then extract particles of interest should there be a need to perform further analyses by other techniques. Such a non-destructive method is of great value in many other nuclear materials applications.
Plutonium, tantalum, and tungsten overlay (a) and specimen visible image (b).

B. Surface swipes
Surface swipes are useful for collecting residue from plutonium and other nuclear material work areas for health and safety monitoring. The Texwipes used here were 4″ × 4″ and prohibitively large to non-destructively image for heterogeneity/spatial distribution by most other techniques (e.g,. SEM EDX). Furthermore, these swipes contained loose plutonium residue, which would contaminate an SEM vacuum chamber. Also, the cloth substrate was non-conducting, which would result in surface charging and particle migration during SEM analysis. MXRF, however, is not limited by any of these issues. The instrument chamber used here can accommodate very large samples, and up to 10 cm × 10 cm areas can be imaged.
A plutonium work area swipe was non-destructively imaged by MXRF for elements present and location of any macroscopic regions of interest. The high spatial resolution provided by the capillary optic was unnecessary (not practical within an acceptable analysis time) for mapping these large cm2 scales. Thus, the 2-mm aperture was used to image the swipe specimen submitted for analysis. Only half of a swipe (4″ × 2″) was available at the time of analysis, but the entire swipe could have easily been imaged if available.
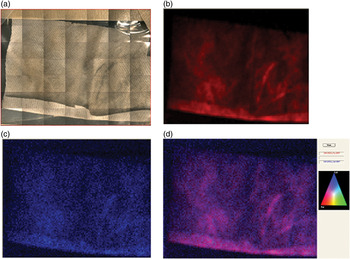
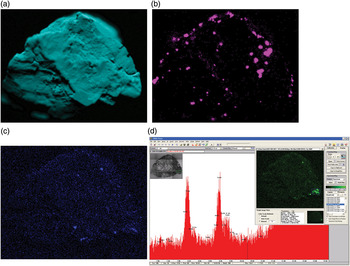
The plutonium distribution in the Pu Lα map [Figure 4(b)] was strongly correlated with the dark residue seen in a visible image of the specimen [Figure 4(a)]. Low levels of gallium were present in the Ga Kα map in many regions of the swipe [Figure 4(c)]. Delta phase plutonium containing gallium was handled in the work area where the swipe was collected. An overlay of the gallium Kα and plutonium Lα maps [Figure 4(d)] shows pink features (Pu and Ga association) corresponding to the dark residue in the visible image, indicating that the residue was composed of delta plutonium. Other notable elemental residue constituents found in some locations on the swipe included zinc, iron, and chromium (the latter two possibly because of steel residue; nickel was difficult to detect because an Ni source filter was used). Residue from interesting features seen in the MXRF images was also extracted with a micro vacuum technique and mounted for particle size and elemental characterization on a micron and sub-micron scale using SEM. However, the SEM analysis results are beyond the scope of the MXRF discussion presented here.
Surface swipe visible image (a), plutonium Lα image (b), gallium Kα image (c), and plutonium and gallium overlay image (d).

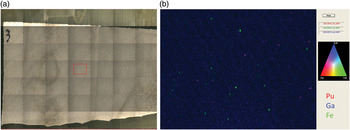
While examining a second swipe specimen using the instrument 70× magnification microscope, some small dark particles were observed. Spectra collected from these particles indicated that they were high in plutonium content (approximately 50% Pu based on using a fundamental parameters quantification approach) and also contained significant levels of gallium. Using the polycapillary optic, a high resolution map was collected from a small area (~8 mm × 5 mm) of the swipe near the center [red boxed region in Figure 5(a)]. An overlay of the Pu Lα, Ga Kα, and Fe Kα images [Figure 5(b)] indicated that delta Pu particles were present (pink particles), as they were composed of both plutonium and gallium. The green particles were composed mostly of iron with some chromium present (probably steel particles). Thus, as with the neptunium/plutonium oxide study, the substantial advantages of non-destructive, large area MXRF elemental imaging were demonstrated.
Surface swipe visible image (a) and high resolution image acquired with the polycapillary optic (b) showing the Pu Lα, Ga Kα, and Fe Kα images color overlay.

C. ER plutonium metal
Plutonium metal is commonly electro-refined to remove substantial impurities prior to use in various applications. To determine whether the ER process was sufficient in removing impurities, samples are submitted for various trace analytical chemistry analyses. These analyses require time consuming sample preparation procedures. Each process receives a piece of metal cut from a parent sample, and trace chemistry results are not always consistent between multiple analyses. Thus, time consuming sample preparation must be repeated with more materials to confirm that the analytical results are correct and that the sample is indeed heterogeneous for the elements in question.
In the current work, a piece of ER plutonium metal from such an apparently heterogeneous metal sample was imaged by MXRF to attempt to directly image the heterogeneity. Two ~250 mg sample cuts were wire-brushed and dissolved for Inductively Coupled Plasma Mass Spectrometry (ICP-MS) analysis, and the tungsten results were very inconsistent between the two cuts (ppm levels in one versus 0.2 wt % from the other). However, no other elemental concentrations differed as significantly between the two cuts as Tungsten.
Figure 6(a) is the plutonium Lα map of the specimen depicting irregular surface features of the chunk of material. An unexpected but significant finding was seen in the iron Kα map [Figure 6(b)] and nickel Kα map (not shown) where prominent spots were found across the sample. There were some Tungsten hot spots detected in several regions of the sample [Figure 6(c)]; although, they were not nearly as prominent as the iron and nickel spots. There were also some locally concentrated spots of tantalum seen in the Ta Lα map [Figure 6(d)]. Tungsten and tantalum contaminants can originate from materials used in the Pu casting and ER processes. The tantalum Lα peaks are clearly present in a spectrum extracted from the tantalum region seen in the lower right corner of the sample.
ER plutonium metal specimen plutonium Lα image (a), iron Kα image (b), tungsten Lα image (c), and tantalum Lα image (d inset) with Ta Lα peaks (d) extracted from the tantalum map hot spot in lower right corner of the specimen.

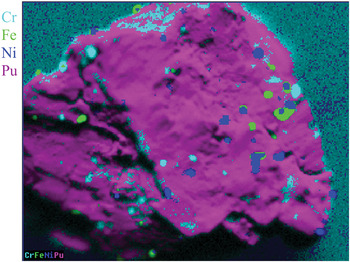
The origin of the iron spots remains unresolved. Since the X-ray signal originated from the upper microns of the sample surface, the iron content within the bulk material could not be examined without transferring the sample back to a glove box, destructively fracturing the metal, remounting, and analyzing the interior (a time consuming process that was not performed). Wire brushing is necessary to remove significant plutonium oxide coating that forms on the surface within hours after polishing. Thus, some of the iron may have originated from residue left from the steel wire brush used. However, a color overlay of the chromium Kα, iron Kα, nickel Kα, and plutonium Lα maps (Figure 7) indicated that chromium, nickel, and iron were not fully correlated. Hence, some of these constituents may have been because of inherent sample impurity heterogeneity. (Note: An attempt to use software to overlay chromium, iron, and nickel, and examine RGB color mixing to visually indicate spatially dependent overlaps of these elements revealed the same partial overlaps seen in Figure 7. However, the colors appeared less prominent using this RGB color mixing feature versus displaying the element with the highest intensity per pixel as shown in Figure 7. Also, the software RGB overlay method can only display a maximum of three elements; thus, these three elements could not be displayed on top of the plutonium matrix as they were in Figure 7.)
Color overlay of Pu ER metal Cr Kα (cyan), Fe Kα (green), Ni Kα (blue), and Pu Lα (purple/pink) maps.

The ER plutonium metal MXRF images demonstrated the unique capability of this technique for non-destructively identifying elemental heterogeneity. Although the ICP chromium, iron, and nickel results did not significantly differ between sample cuts, tungsten did. Therefore, the 250 mg sample cut size appeared to be sufficiently large to compensate for small-scale chromium, iron, and nickel heterogeneity observed by MXRF but perhaps was not large enough to account for tungsten heterogeneity. Subtle small-scale tungsten heterogeneity (100–200-μm diameter features) was detected by MXRF [Figure 6(c)], but this would not account for the large difference in tungsten detected by ICP between two cuts. Without imaging the entire parent material prior to extracting cuts for destructive ICP analysis, it was impossible to confirm if there were large regions (e.g., several mm wide) of high tungsten concentration. One of the cuts ICP received may have contained a much higher concentration of tungsten compared with the other or with the cut received for MXRF analysis. Only one ~350 mg sample cut remained and was available for this MXRF study. Hence, these seminal and intriguing results warrant the usefulness of future studies to examine large multiple gram-sized samples by MXRF prior to destructive ICP analysis to examine tungsten and other elemental heterogeneities over a larger scale.
IV. CONCLUSION
MXRF has been shown to be of great value for elemental imaging of various plutonium samples and nuclear materials. The method is uniquely qualified to non-destructively image large sample areas of non-conducting materials without requiring vacuum. Plutonium-contaminated samples can be analyzed through a containment film or plastic bags without contaminating the instrument, and the detection limits for medium and high atomic number elements are considerably better than with SEM EDX.
Three MXRF nuclear materials applications were examined. Insoluble particles were identified in a neptunium and plutonium oxide mixture. Interesting areas based on elemental content were located on surface swipes taken from a plutonium work area, and some of these regions were extracted for further morphological and elemental characterization by other methods. Finally, elemental heterogeneity was directly imaged in an ER plutonium metal. These data are invaluable for other analytical chemistry methods and demonstrate the potential of MXRF for non-destructively analyzing such material and eliminating excessive, time consuming sample preparation repeating analyses by other analytical methods to confirm sample heterogeneity.
ACKNOWLEDGMENTS
The authors thank Elmer Lujan, Kathy Garduño, and Lisa Colletti for providing neptunium and plutonium mixed oxide and Fran Martin for cutting the ER plutonium metal sample. Los Alamos National Laboratory, an affirmative action/equal opportunity employer, is operated by Los Alamos National Security, LLC, for the National Nuclear Security Administration of the U.S. Department of Energy under contract DE-AC52-06NA25396. The institutional number for this publication is LA-UR-12-24511.