Introduction
Major depressive disorder (MDD) is heterogeneous. Accordingly, focusing on intermediate phenotypes (endophenotypes) can be useful to identify more homogenous subgroups of patients sharing common pathophysiology and allow better integration with animal work. Among the most established depressive endophenotypes are anhedonia, stress sensitivity and executive function deficits (Hasler et al., Reference Hasler, Drevets, Manji and Charney2004; Goldstein and Klein, Reference Goldstein and Klein2014; Pizzagalli, Reference Pizzagalli2014). Notably, the increasing availability of large medical databases that can be mined opens new avenues for investigating depressive phenotypes with respect to key pathophysiological variables (Howard et al., Reference Howard, Adams, Shirali, Clarke, Marioni, Davies, Coleman, Alloza, Shen and Barbu2018).
Growing evidence suggests that chronic, low grade inflammation may induce changes that increase risk for MDD (Miller et al., Reference Miller, Haroon, Raison and Felger2013). In particular, animal studies indicate that pro-inflammatory cytokines [e.g. interleukin-6 (IL-6)] and acute phase reactants [e.g. C-reactive protein (CRP)] have downstream effects, resulting in ‘sickness behaviors’ such as social withdrawal, reduced food consumption and deficits in hippocampal-dependent memory (Dantzer et al., Reference Dantzer, O'Connor, Freund, Johnson and Kelley2008; Iwata et al., Reference Iwata, Ota, Li, Sakaue, Li, Dutheil, Banasr, Duric, Yamanashi, Kaneko, Rasmussen, Glasebrook, Koester, Song, Jones, Zorn, Smagin and Duman2016; Menard et al., Reference Menard, Pfau, Hodes, Kana, Wang, Bouchard, Takahashi, Flanigan, Aleyasin, LeClair, Janssen, Labonté, Parise, Lorsch, Golden, Heshmati, Tamminga, Turecki, Campbell, Fayad, Tang, Merad and Russo2017; Wang et al., Reference Wang, Hodes, Zhang, Zhang, Zhao, Golden, Bi, Menard, Kana, Leboeuf, Xie, Bregman, Pfau, Flanigan, Esteban-Fernández, Yemul, Sharma, Ho, Dixon, Merad, Han, Russo and Pasinetti2018). Furthermore, elevated concentrations of pro-inflammatory cytokines have been reported in MDD (Dowlati et al., Reference Dowlati, Herrmann, Swardfager, Liu, Sham, Reim and Lanctôt2010), predicted disease severity (Valkanova et al., Reference Valkanova, Ebmeier and Allan2013) and de novo MDD onset (Pasco et al., Reference Pasco, Nicholson, Williams, Jacka, Henry, Kotowicz, Schneider, Leonard and Berk2010) in longitudinal studies, and modulated responses to treatment (Lindqvist et al., Reference Lindqvist, Dhabhar, James, Hough, Jain, Bersani, Reus, Verhoeven, Epel, Mahan, Rosser, Wolkowitz and Mellon2017). Conversely, and highlighting bidirectional influences, depression has been shown to predict subsequent increases in inflammation (Stewart et al., Reference Stewart, Rand, Muldoon and Kamarck2009), which could partly explain the recurrent nature of MDD.
Numerous studies have shown that peripheral inflammation negatively impacts neuronal structure and function, causing neurodegeneration and impeding neuroplasticity (Calabrese et al., Reference Calabrese, Rossetti, Racagni, Gass, Riva and Molteni2014) through complex interactions with stress, endocrine and neurotransmitter function (Anisman and Merali, Reference Anisman and Merali2003). Studies employing the rodent chronic social defeat stress paradigm have identified increases in central and peripheral biomarkers of inflammation (Gao et al., Reference Gao, Wang, Peng and Deng2019; Niraula et al., Reference Niraula, Witcher, Sheridan and Godbout2019), whereas ex vivo imaging studies have found increases in volume in nucleus accumbens (NAc) and cingulate cortex, and decreases in ventral tegmental area and amygdala associated with stress response (Anacker et al., Reference Anacker, Scholz, O'Donnell, Allemang-Grand, Diorio, Bagot, Nestler, Hen, Lerch and Meaney2016). While the mechanisms that mediate volume changes accompanying exposure to stressors remain largely unknown, negative relationships between inflammatory markers and brain volume have emerged in humans, particularly in the hippocampus (Marsland et al., Reference Marsland, Gianaros, Abramowitch, Manuck and Hariri2008; Frodl et al., Reference Frodl, Carballedo, Hughes, Saleh, Fagan, Skokauskas, McLoughlin, Meaney, O'Keane and Connor2012; van Velzen et al., Reference van Velzen, Schmaal, Milaneschi, van Tol, van der Wee, Veltman and Penninx2017) – one of the main sites for neurogenesis. This is interesting given the effects of stress and MDD on hippocampus volume (Belleau et al., Reference Belleau, Treadway and Pizzagalli2019) and meta-regression findings highlighting a correlation between number of MDD episodes and decreasing hippocampal volume (Videbech and Ravnkilde, Reference Videbech and Ravnkilde2004; see also Treadway et al., Reference Treadway, Waskom, Dillon, Holmes, Park, Chakravarty, Dutra, Polli, Iosifescu, Fava, Gabrieli and Pizzagalli2015). Bringing this together, studies are beginning to show associations between endogenous inflammation and brain volume in the hippocampus, caudate, amygdala and anterior cingulate cortex (ACC) – regions critically implicated in the pathophysiology of MDD (Savitz et al., Reference Savitz, Frank, Victor, Bebak, Marino, Bellgowan, McKinney, Bodurka, Kent Teague and Drevets2013; van Velzen et al., Reference van Velzen, Schmaal, Milaneschi, van Tol, van der Wee, Veltman and Penninx2017).
In humans, substantial evidence for a causal link between the administration of exogenous inflammatory stimuli and the emergence of depressive symptoms can be gleaned from (1) studies involving administration of inflammatory challenges, such as Interferon (IFN)-α treatment for hepatitis C (Bonaccorso et al., Reference Bonaccorso, Marino, Biondi, Grimaldi, Ippoliti and Maes2002) or malignant melanoma (Musselman et al., Reference Musselman, Lawson, Gumnick, Manatunga, Penna, Goodkin, Greiner, Nemeroff and Miller2001) and vaccinations (Kuhlman et al., Reference Kuhlman, Robles, Dooley, Boyle, Haydon and Bower2018), and (2) experimental administration of endotoxin in healthy individuals (Eisenberger et al., Reference Eisenberger, Berkman, Inagaki, Rameson, Mashal and Irwin2010). Relevant to the current study, a role of striatal dopamine emerged in an IFN-α multi-modal imaging study highlighting decreased dopamine turnover in striatal regions in response to reward, which correlated with depressive symptoms (Capuron et al., Reference Capuron, Pagnoni, Drake, Woolwine, Spivey, Crowe, Votaw, Goodman and Miller2012).
In addition to structural alterations, inflammation was also shown to impact neural function in MDD. In particular, Dooley et al. (Reference Dooley, Kuhlman, Robles, Eisenberger, Craske and Bower2018) highlighted four endophenotypes of MDD that were affected by experimentally induced inflammation (1) exaggerated reactivity to negative information, (2) increased physiological stress reactivity, (3) increased amygdala responses to social threat, and (4) abnormal reward processing, in particular reduced ventral striatal activation during both anticipation (Eisenberger et al., Reference Eisenberger, Berkman, Inagaki, Rameson, Mashal and Irwin2010) and consumption (Capuron et al., Reference Capuron, Pagnoni, Drake, Woolwine, Spivey, Crowe, Votaw, Goodman and Miller2012; Treadway et al., Reference Treadway, Admon, Arulpragasam, Mehta, Douglas, Vitaliano, Olson, Cooper and Pizzagalli2017) of rewards. In a recent functional magnetic resonance imaging (fMRI) study from the sample presented here, we found that stress-induced IL-6 elevations predicted disrupted reward prediction errors in the ventral striatum (Treadway et al., Reference Treadway, Admon, Arulpragasam, Mehta, Douglas, Vitaliano, Olson, Cooper and Pizzagalli2017). This endophenotypic approach to examining inflammation emphasizes the importance of understanding its effects on neural structures supporting motivation, affect and cognition, which can be studied in healthy populations to uncover potential mechanisms explaining how inflammation might confer risk for MDD.
The goal of the current study was two-fold. In Study 1, we evaluated whether individual differences in low-grade inflammation [as assessed by baseline IL-6 (as well as CRP)] were associated with volumetric differences in brain regions consistently linked to (1) the effects of inflammation on brain function or structure and (2) phenotypes related to the pathophysiology of MDD, particularly stress regulation and reward/motivation. In Study 2, we leveraged advances in digital medical records and machine learning to derive the presence of MDD in a large clinical dataset, and thereby, test for putative differences in inflammation between patients with v. without probable lifetime MDD and whether inflammation was a predictor of probable MDD classification while accounting for other variables. Based on the literature reviewed above, we hypothesized that increased inflammation in healthy females would be associated with decreased brain volume in the hippocampus, amygdala, ACC, and striatum. Furthermore, we predicted that elevated levels of inflammation from longitudinal medical records would be linked to probable lifetime MDD classification. This work starts with mechanistic data on the effect of inflammation in brain regions previously implicated in depressive phenotypes and reinforces this with medical record data supporting the effect of chronic inflammation on probable lifetime MDD incidence.
Method
Study 1: structural MRI study
Participants
A total of 88 right-handed psychiatrically healthy female participants took part in a larger study that included separate sessions involving a behavioral acute stress manipulation (Admon et al., Reference Admon, Treadway, Valeri, Mehta, Douglas and Pizzagalli2017) and an fMRI study (Treadway et al., Reference Treadway, Admon, Arulpragasam, Mehta, Douglas, Vitaliano, Olson, Cooper and Pizzagalli2017). Only females were recruited to avoid potential sex differences in stress response (Kudielka and Kirschbaum, Reference Kudielka and Kirschbaum2005), an important aspect of the overall study (Admon et al., Reference Admon, Treadway, Valeri, Mehta, Douglas and Pizzagalli2017). Participants were excluded for any current or past psychiatric disorder or for five or more lifetime exposures to any recreational drugs (see online Supplementary Methods), as well as any use of any drug or herbal supplement with well-characterized psychotropic effects in the past 3 weeks.
Procedure
Participants were tested in two separate sessions between 11:00 A.M. and 4:00 P.M. to reduce potential circadian effects on endogenous cortisol (Blascovich et al., Reference Blascovich, Vanman, Mendes and Dickerson2011). At the first session, participants completed an acute laboratory stressor (the Maastricht Acute Stress Test, MAST; Smeets et al., Reference Smeets, Cornelisse, Quaedflieg, Meyer, Jelicic and Merckelbach2012; data reported in Admon et al., Reference Admon, Treadway, Valeri, Mehta, Douglas and Pizzagalli2017). After this first session, participants were asked to return within ~1 month (mean days = 25, s.d. = 21) to complete session 2, which included an fMRI scan (reported in Treadway et al., Reference Treadway, Admon, Arulpragasam, Mehta, Douglas, Vitaliano, Olson, Cooper and Pizzagalli2017), as well as a high-resolution anatomical scan.
Plasma collection and IL-6 analysis
To evaluate IL-6 levels in session 1, plasma samples were drawn intravenously three separate timepoints in relation to the acute stressor: at −10 min (before stressor), +45 min following stressor and +90 min following stressor (for full details, about the plasma sampling procedure, see Treadway et al., Reference Treadway, Admon, Arulpragasam, Mehta, Douglas, Vitaliano, Olson, Cooper and Pizzagalli2017). Only the pre-stress samples were analyzed in order to probe relationships between baseline low-grade inflammation and brain volume (and maximize sample size since all participants with plasma samples provided the first sample).
All assays were performed at the Clinical and Epidemiologic Laboratory (CERLab) within the Department of Laboratory Medicine at Boston Children's Hospital. IL-6 was assessed using an ultra-sensitive enzyme-linked immunosorbent assay (ELISA; R&D Systems, Minneapolis, MN) employing the quantitative sandwich enzyme immunoassay technique. The assays were run in duplicate, and it was essential that all assays had an inter-assay covariance of less than 10%. No IL-6 measurements were excluded due to samples falling outside this predetermined range. The assay had a sensitivity of 0.094 pg/ml, and the average inter-assay coefficient of variation was 7.8%. Based on prior findings (e.g. Treadway et al., Reference Treadway, Admon, Arulpragasam, Mehta, Douglas, Vitaliano, Olson, Cooper and Pizzagalli2017; Dooley et al., Reference Dooley, Kuhlman, Robles, Eisenberger, Craske and Bower2018), IL-6 was our primary inflammatory variable; however, CRP was also assayed to directly link to Study 2.
MRI acquisition and preprocessing
MRI data were acquired at the McLean Imaging Center using a 3T Siemens Tim Trio scanner with a 32-channel head coil. The MRI protocol included high-resolution T1-weighted MPRAGE images (TR = 2200 ms; TE = 1.54 ms; FOV = 230 mm; matrix = 192 × 192; resolution = 1.22 mm3; 144 slices). MRI analysis was carried out using the Computational Anatomy Toolbox (CAT12) (http://www.neuro.unijena.de/cat/) voxel-based morphometry (VBM) module, developed for SPM12 (Wellcome Department of Cognitive Neurology). VBM data were pre-processed as follows: (1) spatial registration to a standard brain template, (2) tissue segmentation into gray and white matter and CSF, (3) bias correction of intensity nonuniformities, and (4) smoothing (8 mm3). For structural MRI, gray matter volumes were extracted from a priori defined regions of interest (ROIs) previously linked to MDD pathophysiology and inflammatory responses: amygdala, hippocampus, and ACC. In addition, exploratory analyses were conducted on volumes of striatal nuclei: caudate nucleus, putamen and NAc. All ROI masks were defined anatomically using the neuromorphometrics atlas (Bakker et al., Reference Bakker, Tiesinga and Kötter2015) as implemented in CAT.
Statistical analysis
For all ROIs, bilateral volume was considered since we had no laterality hypotheses. Baseline IL-6 scores were positively skewed, and thus, a log (ln) transformation was used. Potential relations between ROI gray matter volumes and ln-transformed IL-6 levels were examined using Pearson's correlation in R (R Development Core Team, 2013), separately per region. Spearman's correlation was also examined to assess monotonic relationship between the variables (on untransformed data). Correction for multiple comparisons (six ROIs) was applied using the Bonferroni method (p = 0.05/6 = 0.0083).
Study 2: biobank study
Participants
Samples and health information were obtained from the Partners HealthCare Biobank, a biorepository of consented patients' samples at Partners HealthCare (parent organization of Massachusetts General Hospital and Brigham and Women's Hospital, Boston, USA). The Partners Biobank provides banked samples and laboratory test results collected from patients in Massachusetts who consented to broad-based research. In addition, these test results are linked to clinical data from the Electronic Medical Record (EMR) and survey data on lifestyle, environment, and family history. At time of writing (December 2018), 93 908 patients had provided consent to join the Partners Biobank. De-identified patient data were downloaded using the Biobank Portal, a secure web-based tool that links consented subjects from the Partners Biobank with their healthcare data from the EMR and with research data. Data were extracted from the Partners Biobank on 6 December 2018. Patients were included in the analysis if they had at least one CRP serum test result (see online Supplementary Table S2). Participants were considered to be inflamed if their serum CRP level was above 3 mg/l, in accordance with the accepted norm (Pearson et al., Reference Pearson, Mensah, Alexander, Anderson, Cannon, Criqui, Fadl, Fortmann, Hong and Myers2003; Bell et al., Reference Bell, Kivimäki, Bullmore, Steptoe, Consortium and Carvalho2017), and as used in other studies of MDD (Uher et al., Reference Uher, Tansey, Dew, Maier, Mors, Hauser, Dernovsek, Henigsberg, Souery and Farmer2014; Köhler-Forsberg et al., Reference Köhler-Forsberg, Buttenschøn, Tansey, Maier, Hauser, Dernovsek, Henigsberg, Souery, Farmer, Rietschel, McGuffin, Aitchison, Uher and Mors2017).
The phenotype of interest in Study 2 categorizes biobank participants into two groups: (1) those with probable lifetime MDD and (2) those without probable lifetime MDD. Curated disease population validated phenotypes defined by bioinformatics algorithms were used to define existence of lifetime MDD at 0.90 positive predictive value. The calculation of these phenotypes is described in Gainer et al. (Reference Gainer, Cagan, Castro, Duey, Ghosh, Goodson, Goryachev, Metta, Wang and Wattanasin2016). Briefly, these phenotypes use an analysis file of concepts including potential positive and negative predictors of the disease. These predictors consist of a combination of both coded terms (e.g. prescription of an antidepressant drug) and terms extracted from the narrative data using natural language processing and validation with chart reviews (e.g. the phrase ‘major depression’). An adaptive LASSO penalized logistic regression method identified weighted predictive variables for the algorithm (see online Supplementary Table S3). Most importance was placed on how the variables together in the algorithm could predict the phenotypes, rather than the accuracy of any one variable. Finally, a logistic regression model assigned each biobank participant a probability of having a phenotype based on their values for each term. In development, these predictive values were evaluated in a subsample of a gold-standard patient training set using full chart review by a clinical expert (see online Supplementary Table S4). In addition, computed phenotypes were similarly used to define probable lifetime existence of chronic inflammatory conditions so that patients with these conditions could be excluded from the analysis. Information on body mass index (BMI) and smoking history, which have been each linked to increased inflammation (Bazzano et al., Reference Bazzano, He, Muntner, Vupputuri and Whelton2003; Nicklas et al., Reference Nicklas, Ambrosius, Messier, Miller, Penninx, Loeser, Palla, Bleecker and Pahor2004), were also downloaded for inclusion as covariates in regression analyses.
Statistical analysis
The biobank data were analyzed first using non-parametric statistics [Mann–Whitney U test in R (R Development Core Team, 2013)] when the dependent variables (CRP lab count, mean CRP levels) were skewed. Data were also analyzed using logistic regression in R (R Development Core Team, 2013) when the dependent variable was binary (lifetime MDD). Tests were aimed to examine the relationship between probable lifetime MDD and elevated CRP.
Results
Study 1: structural variability and mean IL-6 levels
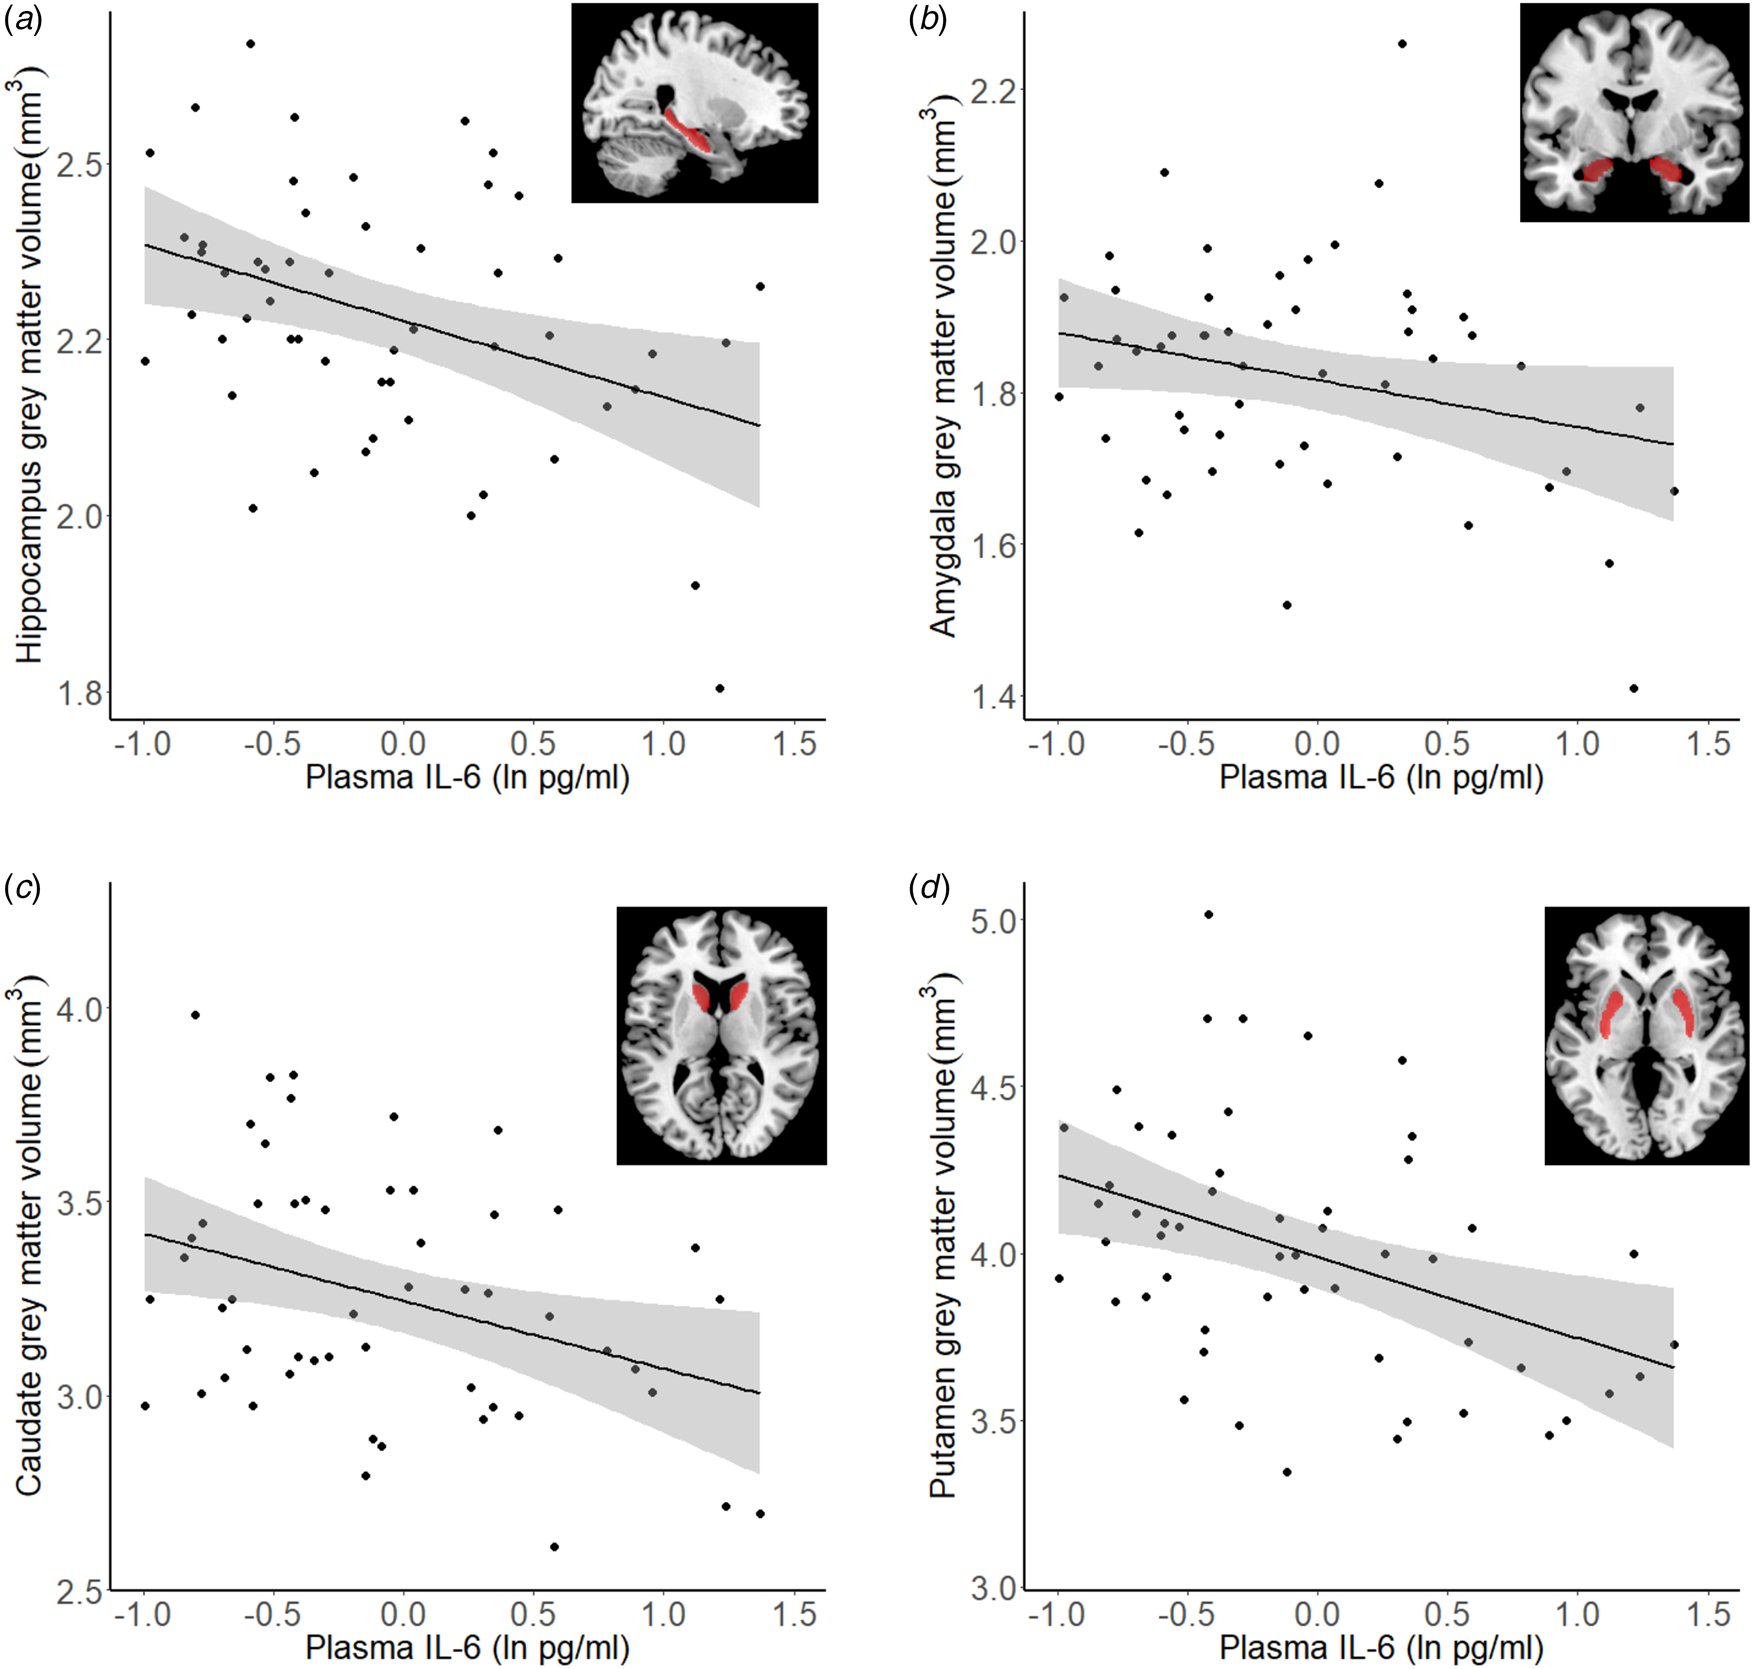
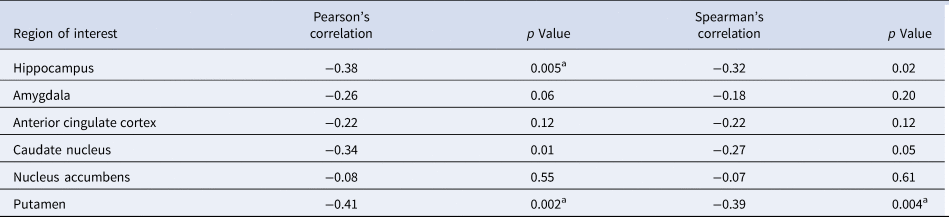
A total of 53 participants had both IL-6 and structural MRI data. As summarized in Table 1, Pearson's correlations between ln-transformed baseline IL-6 levels and gray matter volume revealed significant negative correlations in the bilateral hippocampus (Pearson's r = −0.38, p = 0.005), caudate (r = −0.34, p = 0.01) and putamen (r = −0.41, p = 0.002). These findings remained significant when using non-parametric Spearman's rank correlations. Thus, increased IL-6 was robustly associated with reduced gray matter in these regions. For the amygdala, the correlation was trending (r = −0.25, p = 0.07), whereas no findings emerged for the NAc and the ACC (all ps > 0.1). The hippocampus and putamen findings survived Bonferroni correction. To more directly link to Study 2 analyses were also run with CRP and results were broadly similar to the findings with IL-6 (Fig. 1) (see online Supplementary Table S6).
Correlation of VBM calculated gray matter volume with ln-transformed baseline IL-6. Correlations shown for (a) hippocampus (left ROI shown for illustration, bilateral used for analysis), (b) amygdala, (c) caudate nucleus, (d) putamen. All ROIs are bilateral.

Correlation of VBM calculated gray matter volume with log transformed baseline IL-6

Note: All ROIs bilateral.
a Meets Bonferroni correction for multiple comparisons (threshold for α < 0.05 and six tests = 0.008). N = 53.
Study 2: biobank CRP and curated disease populations
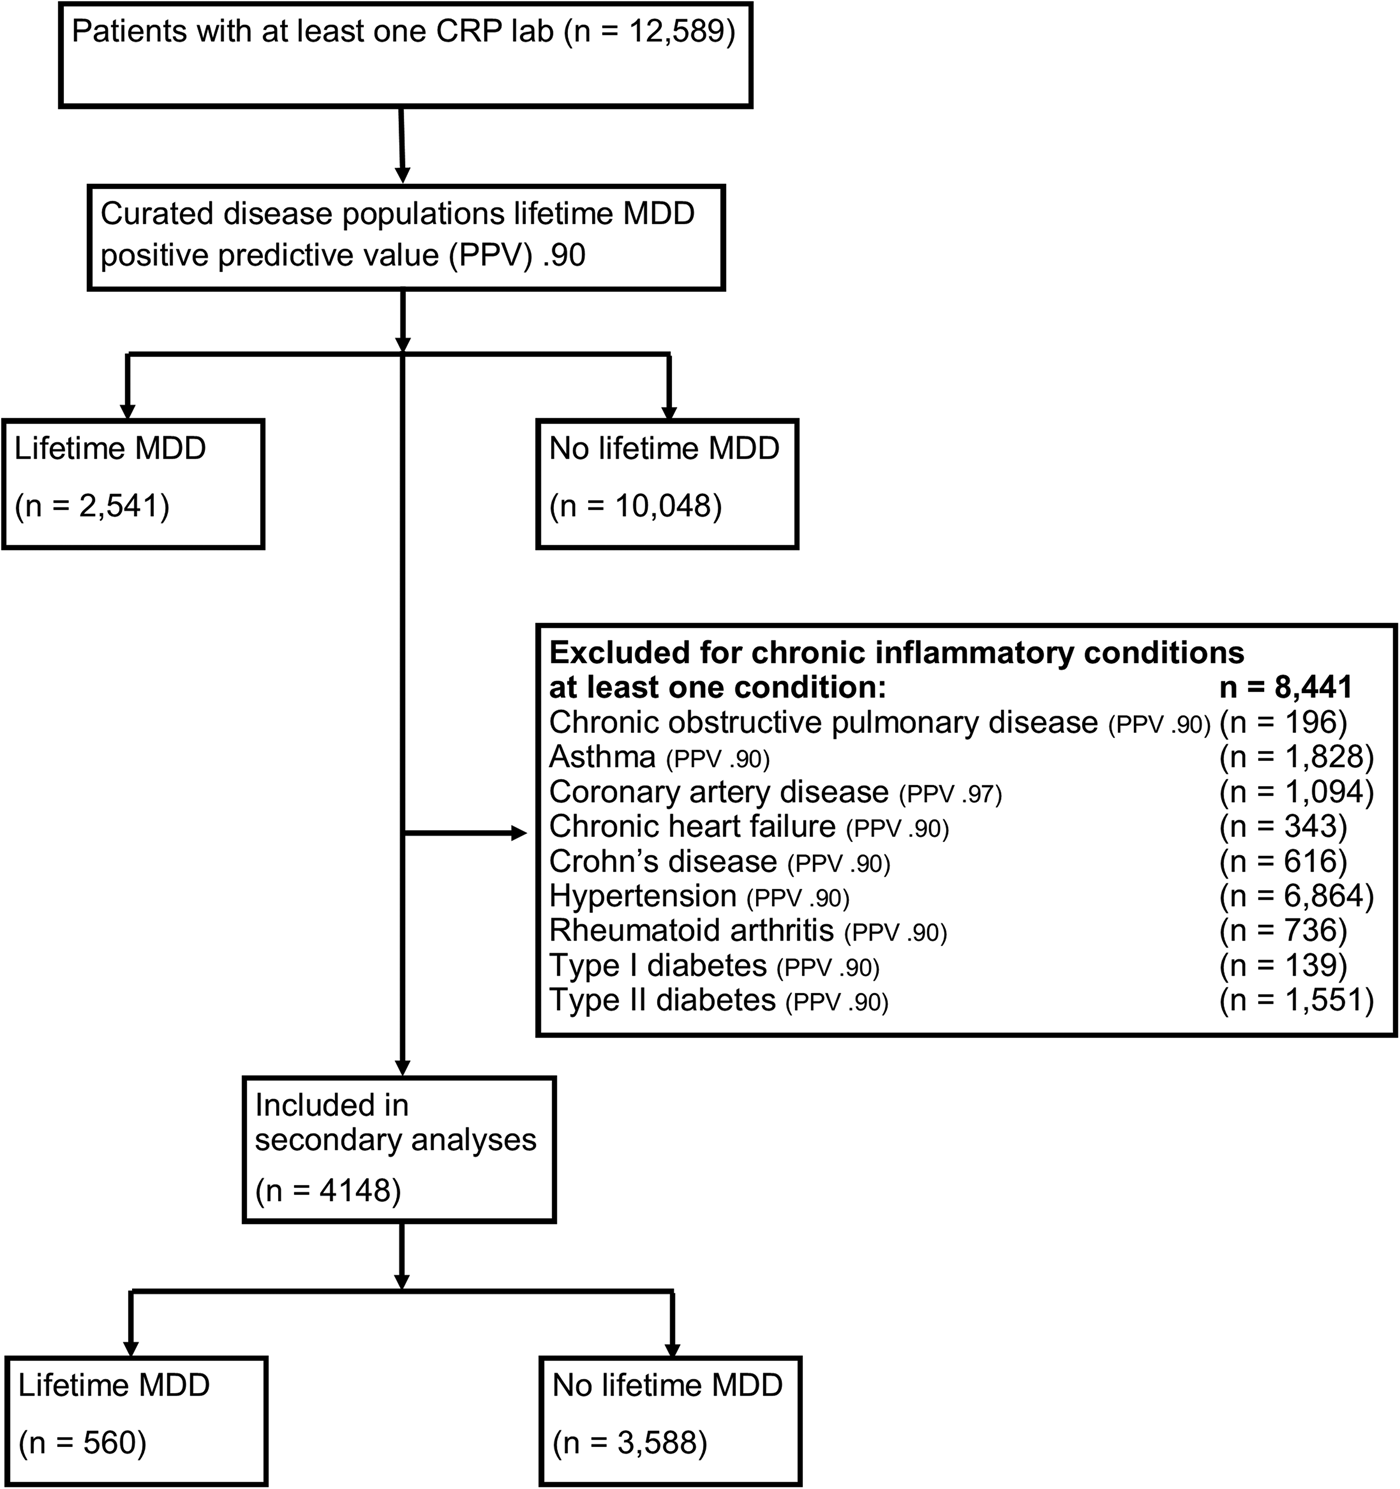
A total of 12 589 (13.1%) of biobank participants had at least one CRP lab result. A total of 2541 (20.2%) met the criteria for probable current or past MDD (lifetime MDD). In this sample with at least one CRP lab result, at least one chronic inflammatory condition was probable in 8441 (67.1%) participants, consisting of 77.9% who met the criteria for lifetime MDD and in 60.1% of those who did not meet the criteria for probable lifetime MDD (χ2(1) = 277.88, p < 0.0001) (Fig. 2). See online Supplementary Table S5 for frequencies of the nine identified inflammatory conditions.
Flowchart of participants for biobank analysis.

A χ2 test was performed to examine the relationship between probable lifetime MDD and probable lifetime occurrence of the chronic inflammatory medical conditions, yielding a significant effect, χ2(8) = 114.51, p < 0.001 (n = 8441). An examination of the residuals and the top three contributions to the overall χ2 score suggested that patients with lifetime MDD were more likely to have lifetime asthma (28.3% of total χ2 score) and T2 diabetes (17.3% of total χ2 score) and less likely to have Crohn's disease (12.5% of total χ2 score), compared to patients without lifetime MDD.
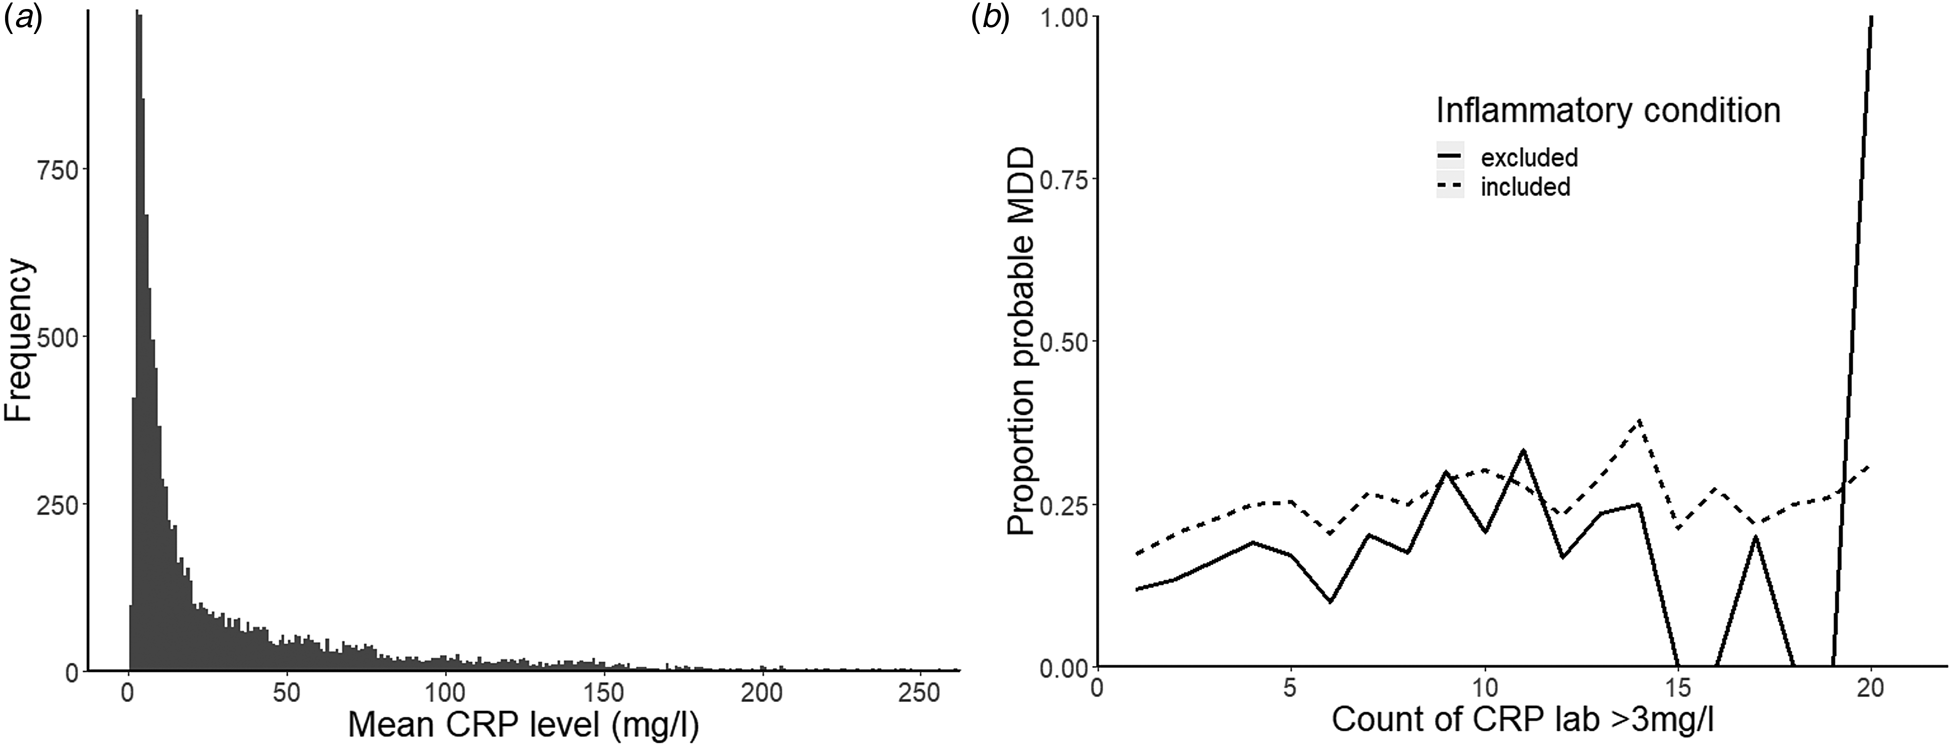
To test the relationship between moderate inflammation and MDD, we first completed analyses for the full sample [n = 12 589, with 20.2% (n = 2541) with lifetime MDD] and then repeated the analysis excluding participants with any of the above chronic inflammatory medical conditions, bringing our sample to n = 4148 [13.5% (n = 560) with lifetime MDD]. Next, to examine the differences in lifetime inflammation in the MDD v. no MDD group across all available lab results for a given patient, we considered both mean CRP levels and also the count of all CRP labs that met the cut-off for inflammation (>3 mg/l) for each patient. The data showed a strong positive skew (Fig. 3a, b) and therefore non-parametric statistics were used to compare the groups (lifetime MDD v. no MDD).
Distribution of CRP measures: (a) mean CRP level; (b) proportion of probable lifetime MDD in the full dataset (n = 12 589; dotted lines) and in the dataset excluding chronic inflammatory medical conditions (n = 4148; sold lines).

For the full dataset a Mann–Whitney–Wilcoxon test indicated that the distributions of the count of elevated CRP labs (>3 mg/l) was different for participants with probable lifetime MDD (n = 2541) v. without (n = 10 048) lifetime MDD, W = 11 345 000, p < 0.001 (Fig. 3c, d). There were no significant differences in the distributions of mean CRP level across the two groups (p = 0.26). For the reduced dataset (i.e. excluding patients with probable lifetime chronic inflammatory medical conditions), a Mann–Whitney–Wilcoxon test indicated that the distributions of the count of elevated CRP labs (>3 mg/l) was also different for participants with (n = 560) v. without (n = 3588) lifetime MDD, W = 899 650, p < 0.001. Again, there were no significant differences in the distributions of mean CRP level across the two groups (p = 0.20).
Regression analyses
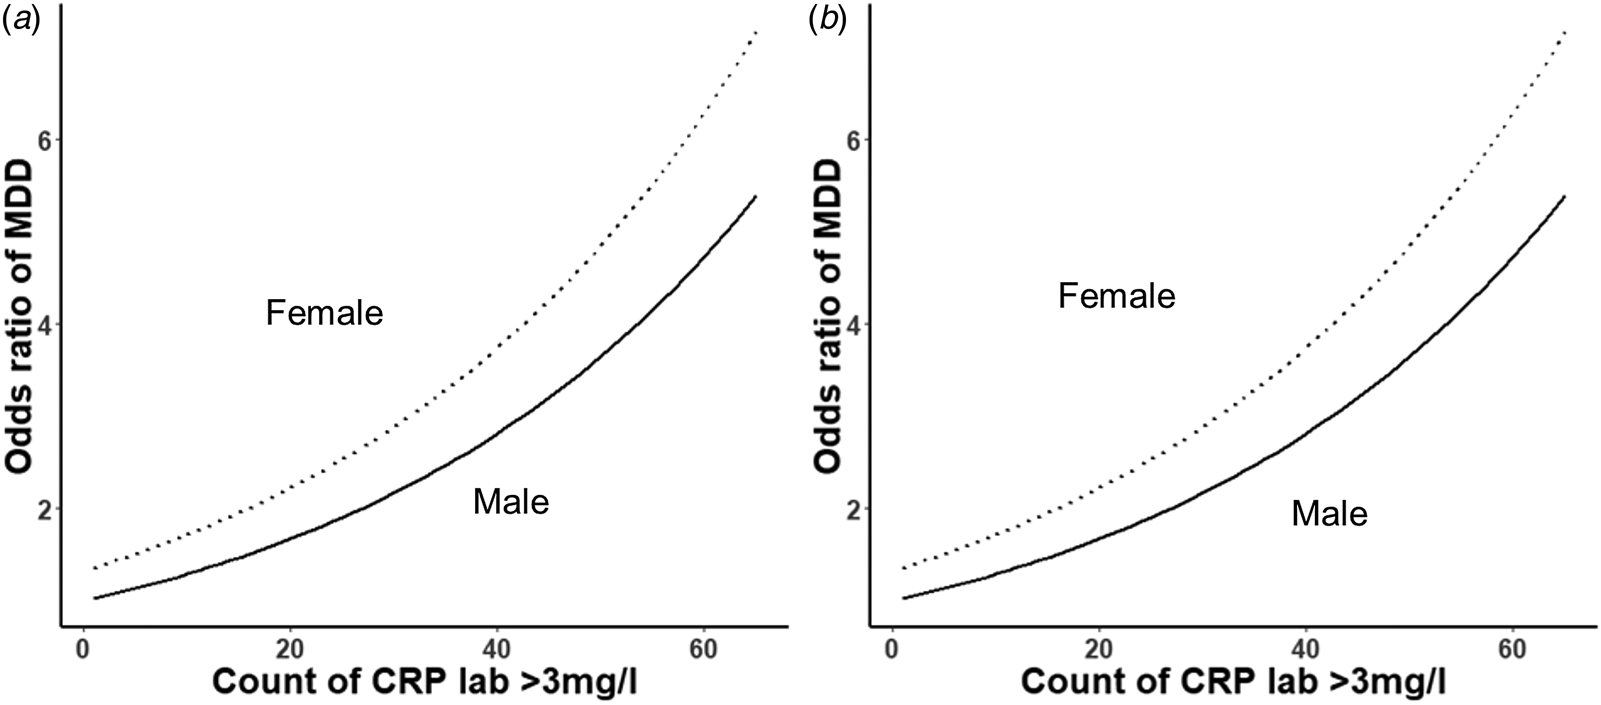
Smoking history was available for 9129 (72.5%) of participants in the full sample. Lifetime smoking was defined as the inverse of the classification ‘Tobacco use – never’ and includes those participants with tobacco use classified as ‘yes’, ‘passive’, ‘quit’. BMI information was available for the full sample and two categories were classified: those with a BMI ever reaching overweight (>25) or those with a BMI ever reaching underweight (<18.5). Minimum sample size for logistic regression with five predictors and 20.2% proportion of MDD participants was calculated as 247. The full sample was partitioned into training (60%, n = 5478) and testing (40%, n = 3651) datasets to allow for subsequent model validation. Logistic regression on the training dataset with a likelihood ratio test revealed that a model including the count of CRP labs >3 mg/l predicted probable MDD classification significantly better than a baseline model including only sex, lifetime smoking and low/high BMI (χ2(6) = 12.86, p < 0.001). In this model, for each additional instance of inflammation (CRP lab of >3 mg/l) the predicted odds of being classified with MDD change by a factor of 1.02 (Fig. 4). The addition of mean CRP level as a predictor also significantly improved the model (χ2(7) = 4.33, p = 0.04). Examining the absolute value of the t-statistic for each predictor in the full model (sex + lifetime smoking + low/high BMI + count of elevated CRP labs + mean CRP level), sex was the most important predictor of probable MDD classification (t = 8.55), followed by high BMI (t = 8.21), tobacco use (t = 6.19), low BMI (t = 5.17), count of elevated CRP labs (t = 3.71) and finally mean CRP level (t = 2.04). A Wald χ2 determined that inflammation was a significant individual predictor of probable MDD classification (F (1,5471) = 13.81, p < 0.001) and mean CRP level was also a significant individual predictor of probable MDD classification (F (1,5471) = 4.14, p = 0.04). Model estimates from the training set were then used to predict values on the testing set. A comparison of the predicted target variable v. the observed values for each observation showed a classification rate of 78.5%.
Probability of MDD classification as a function of count of elevated CRP labs. (a) Full dataset (training, n = 1687). (b) Dataset excluding chronic inflammatory medical conditions (training, n = 5478).

The logistic regression was then repeated for the reduced dataset (n = 4148). This was again reduced by smoking history being available for 2809 (67.7%) of participants in the reduced sample. BMI information was available for the full sample. Minimum sample size for logistic regression with the same number of predictors but only 13.5% proportion of MDD participants was calculated as 370. The sample was also partitioned into training (60%, n = 1687) and testing (40%, n = 1122) datasets. Logistic regression on the training dataset with a likelihood ratio test revealed that a model including the count of CRP labs >3 mg/l showed a trend to predict probable MDD classification better than a baseline model including only sex, lifetime smoking and low/high BMI (χ2(6) = 3.55, p = 0.06). In this model, for each additional instance of inflammation (CRP lab of >3 mg/l) the predicted odds of being classified with MDD change by a factor of 1.03 (Fig. 4). The addition of mean CRP level as a predictor did not significantly improve the model in this reduced sample (χ2(7) = 1.49, p = 0.22). Examining the absolute value of the t-statistic for each predictor in the full model (sex + lifetime smoking + low/high BMI + count of elevated CRP labs), sex was the most important predictor of probable MDD classification (t = 4.53), followed by high BMI (t = 3.76), tobacco use (t = 3.69), low BMI (3.54) and finally count of elevated CRP labs (t = 2.01). A Wald χ2 determined that, in this reduced sample, inflammation was still a significant individual predictor of probable MDD classification (F (1,1681) = 4.03, p = 0.04). Sex did not significantly moderate the effect of inflammation on probable MDD classification (all ps > 0.38). Model estimates from the training set were then used to predict values on the testing set. A comparison of the predicted target variable v. the observed values for each observation showed a classification rate of 84.5% in this reduced sample. Thus, although power and significance were diminished in this reduced sample, inflammation was still a noteworthy predictor of probable MDD classification.
Discussion
An integration of approaches – including structural imaging and mining of medical records – was used to examine potential mechanisms linked to the role of inflammation in the onset and maintenance of MDD and possible inflammatory laboratory indicators of increased risk for MDD. Here, we observed that increased inflammation was associated with reduced gray matter volume in regions previously linked to endophenotypes underlying the pathophysiology of MDD (Treadway and Pizzagalli, Reference Treadway and Pizzagalli2014), in particular stress regulation (e.g. hippocampus), anhedonia (striatum) and threat reactivity (amygdala). Furthermore, we leveraged a large clinical database to show the predictive relationship between increased lifetime occurrences of elevated inflammation and lifetime incidence of probable MDD, which was established using complex phenotypes emerging from longitudinal medical records using machine-learning approaches. Genome-wide association study data have been used to explore genetic relations between phenotypes for psychiatric and inflammatory conditions, with an emergent genome-wide correlation between hypothyroidism and MDD (Tylee et al., Reference Tylee, Sun, Hess, Tahir, Sharma, Malik, Worrall, Levine, Martinson, Nejentsev, Speed, Fischer, Mick, Walker, Crawford, Grant, Polychronakos, Bradfield, Sleiman, Hakonarson, Ellinghaus, Elder, Tsoi, Trembath, Barker, Franke, Dehghan, Faraone and Glatt2018). However, no study has, to our knowledge, utilized a large database of clinical records and machine-learning computed phenotypes to probe this relationship in an unselected community sample. In Study 1, significant negative correlations emerged between inflammation (measured from serum IL-6) and brain volume in regions linked to MDD endophenotypes and disease course. The hippocampus, in particular, is implicated in the downstream effects of chronic inflammation (Calabrese et al., Reference Calabrese, Rossetti, Racagni, Gass, Riva and Molteni2014), as one of the few regions implicated in neurogenesis (Balu and Lucki, Reference Balu and Lucki2009; Kempermann et al., Reference Kempermann, Gage, Aigner, Song, Curtis, Thuret, Kuhn, Jessberger, Frankland, Cameron, Gould, Hen, Abrous, Toni, Schinder, Zhao, Lucassen and Frisén2018), which may be impeded directly by inflammatory cytokines (Koo and Duman, Reference Koo and Duman2008). These findings may provide new insights into how inflammation may trigger depressive symptoms through detrimental effects on neurogenesis or neuroplasticity in regions implicated in stress regulation (e.g. hippocampus), anhedonia (e.g. caudate) and threat reactivity (e.g. amygdala), either directly or through promotion of glucocorticoid secretion after stress (Goshen et al., Reference Goshen, Kreisel, Ben-Menachem-Zidon, Licht, Weidenfeld, Ben-Hur and Yirmiya2008). This adds to growing literature implicating chronic inflammation in the onset of neural abnormalities implicated in stress response and MDD, strengthening previous preclinical findings (Dantzer et al., Reference Dantzer, O'Connor, Freund, Johnson and Kelley2008).
For Study 2, a large clinical dataset was available, with curated disease populations using a validated machine-learning generated phenotype for probable MDD (Partners Biobank, Massachusetts) and linked lifetime medical records. This enabled analysis of lifetime data on laboratory measurements of inflammatory markers to be associated with classification in terms of this MDD phenotype. We found that the number of instances of elevated inflammation followed a different distribution between the group classified with v. without probable lifetime MDD so that the MDD group showed a higher probability of elevated inflammation than the non-MDD group. In addition, regression analyses revealed that the number of instances of elevated inflammation and mean levels of an inflammatory marker were highly significant predictors of MDD, even when controlling for typical predictors such as sex, smoking and BMI. Although prior research implicates chronic inflammation in the onset of MDD, we also examined inflammation in the absence of any chronic inflammatory condition. As expected, the relationship was not as strong in this reduced sample (though, still significant for count of elevated CRP but not mean CRP). However, even when excluding those with chronic inflammatory medical conditions, number of instances of elevated inflammation still significantly predicted probable MDD classification. This provides evidence for low-level moderate inflammation as a potential risk factor for MDD, and is consistent with prior findings indicating that the hazard ratio for de novo cases of MDD increased by 44% for each standard deviation increase in CRP (Pasco et al., Reference Pasco, Nicholson, Williams, Jacka, Henry, Kotowicz, Schneider, Leonard and Berk2010). Note, however, that the cross-sectional nature of our data prevents any conclusions with respect to causality. It is possible that the machine-learning algorithms may have classified those showing risk factors for inflammatory disease but without a full diagnosis. However, it is a strength of the study that even after removal of these participants, the relationship between inflammation and probable MDD persisted.
Limitations of the study include the cross-sectional design of the MRI study, which does not allow us to test the directionality of the relationship between inflammation and gray matter volume. Despite preclinical evidence of detrimental effects of inflammation on neurogenesis (Koo and Duman, Reference Koo and Duman2008; Zunszain et al., Reference Zunszain, Anacker, Cattaneo, Choudhury, Musaelyan, Myint, Thuret, Price and Pariante2012; Dinel et al., Reference Dinel, Joffre, Trifilieff, Aubert, Foury, Le Ruyet and Layé2014; Borsini et al., Reference Borsini, Cattaneo, Malpighi, Thuret, Harrison, Consortium, Zunszain and Pariante2017), we acknowledge that the causal relationship between reduced gray matter volume and increased inflammation may work in the opposite direction (i.e. reduced volume could be causal for inflammation). Similarly, the nature of the biobank means that lifetime timeframes will not be equivalent across participants. Additionally, the CRP lab test group contains individual lab tests that originated at different institutions, which likely introduced variability and sub-optimal cross-site standardization. However, in such a large dataset, such effects likely wash out. Despite previous links between (1) inflammation and (2) structural MRI findings in the ACC (van Velzen et al., Reference van Velzen, Schmaal, Milaneschi, van Tol, van der Wee, Veltman and Penninx2017) and fMRI findings in the NAc (Treadway et al., Reference Treadway, Admon, Arulpragasam, Mehta, Douglas, Vitaliano, Olson, Cooper and Pizzagalli2017), there were no effects of mean inflammation on ACC or NAc volume. This may be because the prior fMRI findings were associated with stress-induced changes in IL-6 rather than baseline or chronic levels. In addition, the effects of inflammation on reward-related activation and neurodegeneration/neurogenesis may not follow a common pathway (e.g. through effects on dopamine compared to effects on oxidative stress). To tease apart the directionality of effects, future work should examine the effects of inflammation on gray matter volume before and after a prolonged inflammatory challenge (e.g. IFN-α treatment). We also acknowledge that our baseline measurements of IL-6 and CRP in Study 1 do not directly show chronic inflammation; moreover, since these measurements were taken in a single session, we cannot comment whether they reflect an acute or chronic inflammatory state. Finally, only females were recruited for Study 1, limiting generalizability. Despite these limitations, convergence between findings from both studies strengthens the association between inflammation and MDD risk. This information could be used to create models predicting the onset of MDD from medical data. More fundamentally, the current integration of findings contributes to a better mechanistic understanding of the hypothesized bidirectional relationship between inflammation and MDD, and ultimately provide clues for new targets for treatment and prevention.
Supplementary material
The supplementary material for this article can be found at https://doi.org/10.1017/S0033291719002940.
Acknowledgements
The authors thank Kerry Ressler for his help with Biobank access, Stefanie Nickels for her advice on statistical analyses and Partners HealthCare Biobank for providing samples and health information data.
Financial support
This project was supported by R01 MH068376 and R37 MH068376 from the National Institute of Mental Health (D.A.P.). The content is solely the responsibility of the authors and does not necessarily represent the official views of the National Institutes of Health. The funding organization had no role in the design and conduct of the study; collection, management, analysis, and interpretation of the data; preparation, review, or approval of the manuscript; and decision to submit the manuscript for publication.
Conflict of interest
Over the past 3 years, D.A.P. has received consulting fees from Akili Interactive Labs, BlackThorn Therapeutics, Boehringer Ingelheim, and Takeda and an honorarium from Alkernes, for activities unrelated to the current paper. No funding from these entities was used to support the current work, and all views expressed are solely those of the authors. All other authors report no biomedical financial interests.
Ethical standards
The authors assert that all procedures contributing to this work comply with the ethical standards of the relevant national and institutional committees on human experimentation and with the Helsinki Declaration of 1975, as revised in 2008.