

A recent global synthesis quantifying prehistoric social inequality using variation in the distribution of house-floor sizes as a proxy for wealth (Kohler et al. Reference Kohler, Smith, Bogaard, Feinman, Peterson, Betzenhauser and Pailes2017) reveals that changes in subsistence from foraging to farming were the main drivers of inequality. Although groundbreaking and insightful, this explanation does not account for variation within the same region, environment, or subsistence adaptation.
To help advance this area of inquiry, we couple methodological developments in archaeology with emerging theory to examine environmental factors that may influence wealth inequality among farming populations in the southwestern United States. Specifically, we evaluate theoretical predictions from behavioral ecology that suggest differentiation in wealth and status is more likely to occur when and where (1) resource patches are unevenly distributed and spatially circumscribed (Kennett et al. Reference Kennett, Winterhalder, Bartruff and Erlandson2009; Wilson and Codding Reference Kurt M and Codding2020), and (2) resources within those patches are dense, predictable, and clumped, allowing them to be defended and monopolized by a subset of the population (Boone Reference Boone, Smith and Winterhalder1992; Dyson-Hudson and Smith Reference Dyson‐Hudson and Smith1978; Smith and Codding Reference Smith and Codding2021; Wilson et al. Reference Wilson, Cole and Codding2023). Areas suitable for agriculture in the Basin-Plateau region of the broader southwestern United States are unevenly distributed and spatially circumscribed (Vernon et al. Reference Vernon, Yaworsky, Spangler, Brewer and Codding2022; Yaworsky et al. Reference Yaworsky, Vernon, Spangler, Brewer and Codding2020), suggesting the potential foundations for unequal resource distributions. However, whether maize is considered dense, predictable, and clumped in time and space depends on how productive those suitable patches are. The density and predictability of a maize patch is determined largely by precipitation, which varies significantly through time in the region (Benson et al. Reference Benson, Ramsey, Stahle and Petersen2013; Bocinsky and Kohler Reference Bocinsky and Kohler2014; see Figure 1). For this reason, we predict that internal differentiation in wealth should be more likely during periods of higher precipitation, when resources become more easily defendable and monopolizable, aligning with the inequality probability frontier logic (Milanovic Reference Milanovic2013). However, this should only hold up to some threshold given that resources may not be worth defending if they are superabundant (Dyson-Hudson and Smith Reference Dyson‐Hudson and Smith1978). Consequently, we suggest that there may be either a decelerating or even nonlinear relationship between inequality and precipitation.
Map of the study area showing archaeological sites (red dots; coordinates randomly jittered to protect site locations) relative to elevation (background) and the boundaries of the Bears Ears National Monument. (Color online)

To evaluate this prediction, we follow archaeological methods from Kohler et alia (Reference Kohler, Smith, Bogaard, Feinman, Peterson, Betzenhauser and Pailes2017) and Kohler and Higgins (Reference Kohler and Higgins2016) to estimate inequality in the distribution of house sizes across Basketmaker to Pueblo III (500 BC–AD 1290) periods in the Bears Ears National Monument (BENM), Utah, USA. We pair this proxy of wealth inequality with spatially explicit tree-ring reconstructions of precipitation following Bocinsky and Kohler (Reference Bocinsky and Kohler2014) and Bocinsky (Reference Bocinsky2013), which allows us to estimate local agricultural productivity. We examine the resulting relationship using nonlinear statistical models run on resampled replicates in order to incorporate uncertainty. The results allow us to evaluate the theoretical expectations that the foundations of inequality may be structured partially by the spatiotemporal distribution of resources.
Materials and Methods
Archaeological Background
Summarized in Table 1 (see also Doelle Reference Doelle2017), the farming period extends from 500 BC to AD 1290 and includes several archaeological cultures represented by Basketmaker II (BMII) to Pueblo III (PIII) periods. Basketmaker II–III (BMII–III) is characterized by a reliance on maize and squash horticulture and the subsequent appearance of beans and of ceramics. Pueblo I (PI) is indicated by the onset of full-scale villages. Evidence of migration to higher elevations during this period may relate to drought affecting lower elevations (Burrillo Reference Burrillo2017). Pueblo II saw the emergence of the “great house” system. By mid-late PII, occupations were situated on mesa tops with the ideal soil for farming. During Pueblo III (PIII), settlements were moved to canyons or cliff walls with greater defensibility (Matson et al. Reference Matson, Lipe and Curewitz2015).
To evaluate if variation in wealth inequality across these time periods is correlated with precipitation, we compile two types of data in this analysis: (1) residential feature floor size as a proxy for wealth and (2) reconstructed precipitation as a proxy for agricultural productivity.
Populations Represented in the Bears Ears National Monument.

Site Data
The lead author undertook a systematic review of sites in the BENM using the Utah State Historic Preservation Office (SHPO). Only records with site features, cultural affiliations, and chronology were used, resulting in 138 site forms. Associated time periods were determined by primary investigators based on radiocarbon dating, ceramic chronology, or dendrochronology. PII/PIII sites represent occupations that include PII and PIII. Features were identified as residential through architectural type or the presence of heavy processing materials such as metates, associated middens, defensive structures (towers), and ceramics (Doelle Reference Doelle2017).
Room surface-area data were retrieved in three ways: (1) extracted from site forms with tabular dimensions of residential features, (2) feature measurements were reconstructed from detailed site maps, and (3) measured in person by a crew, including the lead author as part of a larger project (see e.g., Pavlik et al. Reference Pavlik, Louderback, Vernon, Yaworsky, Wilson, Clifford and Codding2021). For room data extracted from site forms, the exact length and width of the residential room measurements as recorded by reporting authors were used. For room area data obtained via site maps, area was calculated by using the scale provided on the map and measuring the interior wall dimensions (length and width). Thirteen sites were visited and measured by the lead author for this project. While revisiting these sites, previous site maps were used to identify and locate residential features. Measurements were taken from the standing walls by measuring the length and width of the interior of the room. All measurements were converted to meters if they were not in meters already. Only sites with noted wall widths were used to avoid including walls in the calculation of surface area (Kohler et al. Reference Kohler, Smith, Bogaard, Feinman, Peterson, Betzenhauser and Pailes2017). Measurements from 11 sites were reconstructed from residential features with the use of the scale provided by the map.
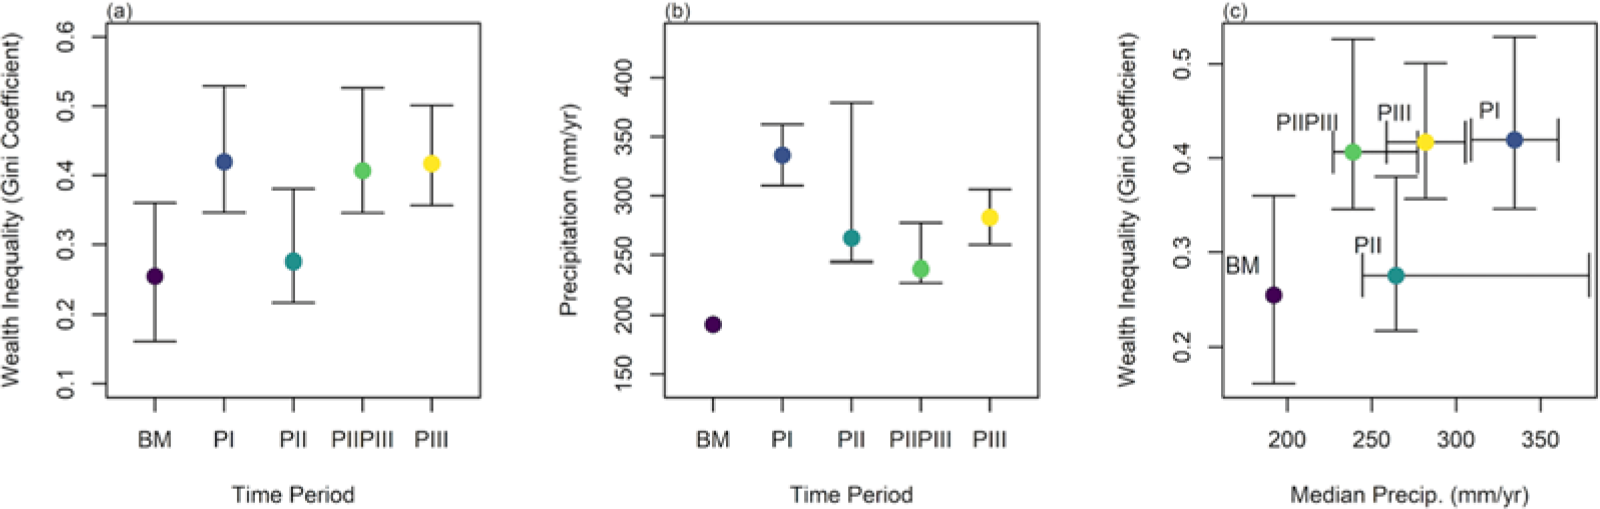
Once the dimensional measurements were collected (length, width), surface area for each residential structure was calculated (m2).Footnote 1 Residential floor size is used to calculate the Gini coefficient—a number between 0 and 1—which demonstrates the distribution of wealth inequality within a group (Gini Reference Gini1912), where 0 represents total equality and 1 represents absolute inequality (see also Ames Reference Ames and Chippindale2009). Gini coefficients are produced for each period (see Figure 2).
Distribution of (a) Gini coefficient (with 80% bootstrapped CI) and (b) precipitation (75% and 25% quartiles) through time, and (c) relative to one another.

Precipitation Data
In order to reconstruct precipitation for each site during the span of occupation, we followed the procedure outlined in Bocinsky and Kohler (Reference Bocinsky and Kohler2014) utilizing the paleocar package in R (Bocinsky and Kohler Reference Bocinsky and Kohler2014; Bocinsky et al. Reference Bocinsky, Jonathan, Keith W. and Timothy A.2016). This procedure calibrates 30-year normal precipitation values from the PRISM dataset utilizing all suitable tree-ring widths accessible in the international tree-ring dataset (ITRD). The results produce a raster per year, with an annual precipitation estimate in mm/year for each 30-second pixel. These values are sampled for each archaeological site by taking the average pixel value for the duration of the associated time period. Given that the tree-ring record only extends 2,000 years, mean Basketmaker (BM) values only include AD 0–750.
Statistical Analysis
Data (Supplementary Data 1) were imported into the R statistical environment (R Core Team Reference Kohler and Higgins2023). We calculated the Gini coefficients following methods from Kohler and Higgins (Reference Kohler and Higgins2016) using the package DescTools, with confidence interval (CI) at 80% through bootstrapping (R = 4,000; Signorell Reference Signorell2024). Precipitation values were sampled using the extract function in the raster package (Hijmans Reference Hijmans2022).
We then evaluated the effect of precipitation on the Gini coefficient using a nonlinear generalized additive model (GAM) with a binomial distribution and quasi-likelihood estimation implemented using the mgcv package (Wood Reference Wood2017). We specified the maximum number of knots possible (k = 5) given the number of observations per run (n = 5), which allowed us to determine if inequality increases linearly, decelerates, or peaks at an intermediate value of precipitation. The model evaluates how the Gini coefficient varies as a function of precipitation for 100 bootstrapped replicates (n = 56; median observed sites per time period) by specifying each replicate as a factor-level interaction. To assess the model, we compared it to a null model using an analysis of variance (ANOVA), examined the distribution of model residuals, and calculated the proportion of runs with a significant result at alpha values of 0.01, 0.05, and 0.10. We plotted the model results showing the mean predicted fit across all replicate runs, and the 95% confidence interval around the model fit calculated from the mean standard error across all replicate runs.
Results
Model results show that wealth inequality increases significantly across time periods as a function of annual precipitation (Figure 3). The overall model explains 49.6% of the deviance in the Gini coefficient, and it is a significant improvement on a null model (F = 2.74, p < 0.0001). As shown in Figure 3, the mean model fit (black line) suggests a linearly increasing trend, though the 95% confidence intervals indicate that the relationship may accelerate, decelerate, or even decline at the highest precipitation levels (Figure 3). Model residuals are normally distributed and centered on zero (see Supplementary Code 1), indicating a reasonable model fit. Replicate model runs show that 4% are significant at the 0.01 level, 29% are significant at the 0.05 level, and 48% are significant at the 0.1 level. Model results are even stronger when omitting mixed PII/PIII sites (F = 7.80, p < 0.0001), with 62% of model runs significant at the 0.01 level, 89% at the 0.05 level, and 96% at the 0.1 level, suggesting that the relationship is unlikely to be a false positive.
Model results showing all 100 data points for each replicate run and the mean model fit of all runs (black line) with 95% CI (shaded region).

Discussion
Our results suggest that environmental conditions influenced the level of inequality people experienced across time periods in the BENM area. In particular, the Pueblo I and Basketmaker occupational periods highlight the extreme ends of this pattern. Despite being adjacent temporal periods, the Basketmaker period shows low inequality coinciding with the lowest precipitation, whereas Pueblo I shows high inequality coinciding with highest precipitation levels. As the Pueblo I period was a time of regional drought, it appears farmers moved to higher elevation to access more rainfall, and in the process, developed greater inequality. This suggests that in the BENM inequality increases as occupied landscapes become more productive, profoundly altering the lives of those inhabiting the area through time. Although current data limit our ability to determine if this relationship is linear, accelerating, decelerating, or nonlinear, the results present a clear correlation between increasing precipitation and inequality.
Increasing agricultural production may very well foster an increase in wealth but also in wealth disparity as the potential for unequal resource distribution escalates. This is in line with theory from behavioral ecology, which suggests that unequal resource control may emerge when resources existing in patches that are heterogenous and circumscribed (Kennett et al. Reference Kennett, Winterhalder, Bartruff and Erlandson2009; Wilson and Codding Reference Kurt M and Codding2020) become dense, predictable, and clumped, allowing for some individuals to defend and monopolize them (Smith and Codding Reference Smith and Codding2021). These dynamics may emerge through first-mover principles that lead to patron–client dynamics (Kennett et al. Reference Kennett, Winterhalder, Bartruff and Erlandson2009; Smith and Codding Reference Smith and Codding2021; Wilson and Codding Reference Kurt M and Codding2020; Wilson et al. Reference Wilson, Cole and Codding2023). Specifically, as people inhabit the most suitable environments first—and as populations grow—those who arrive later may be better off settling in less suitable habitats due to the negative effects of population on occupied habitat suitability (Codding and Bird Reference Codding and Bird2015; Fretwell and Lucas Reference Fretwell and Lucas1969; Kennett et al. Reference Kennett, Winterhalder, Bartruff and Erlandson2009; Weitzel and Codding Reference Weitzel and Codding2022), which establishes conditions for differential resource access and control once precipitation-driven agricultural production increases. These results build on the findings from Kohler et alia (Reference Kohler, Smith, Bogaard, Feinman, Peterson, Betzenhauser and Pailes2017) by providing an example of how emergent wealth inequality can vary based on environmental variation even within a single region over time and among populations with similar subsistence adaptations.
The variation in inequality is only partially explained by precipitation. Future work using alternative indices of inequality with larger samples across a greater range of environmental variation may be able to more fully elucidate the relationship between environmental productivity and inequality, revealing how social relationships vary with ecological change in a spatial location among people practicing very similar subsistence strategies.
Acknowledgments
The lead author gratefully acknowledges graduate committee members Lisbeth Louderback and Jack Broughton for their mentorship and guidance during her master’s research. We also extend our thanks to Weston McCool for his valuable feedback during this project’s formative stages, and to the anonymous reviewers whose thoughtful critiques strengthened the manuscript.
Funding Statement
This work was supported by the National Science Foundation under Grant BCS-1827414 (awarded to Lisbeth Louderback and Bruce Pavlik) and Grant SBE SPRF-2203767 (awarded to Kurt Wilson); the Bureau of Land Management under Cooperative Agreement L17AC00059 (awarded to Lisbeth Louderback, Bruce Pavlik, and Brian Codding); and institutional support from the University of Utah Archaeological Center (conference funding), the University of Utah Undergraduate Research Opportunity Program (research and professional development), and the University of Utah Global Change & Sustainability Center (2020–2021 Fellowship to Roxanne Lamson).
Data Availability Statement
All data and code required to replicate this analysis are available through tDAR under the collection “Environmental Drivers of Wealth Inequality among Ancestral Puebloan Farmers in Bears Ears National Monument” (https://core.tdar.org/collection/88724/environmental-drivers-of-wealth-inequality-among-ancestral-puebloan-farmers-in-bears-ears-national-monument).
Competing Interests
The authors declare none.
Supplementary Material
The supplementary material for this article can be found at https://doi.org/10.1017/aaq.2025.8.
Supplementary Code 1. Lamson Supplementary Code.
Supplementary Data 1. Observed Dataset and Bootstrapped Sample.