Housing price comovements are an important issue in economics. This study focuses on monthly housing prices of 99 major cities in China for the years 2010–2019 by using correlation-based hierarchical analysis and synchronisation analysis, through which one could determine interactions and interdependence among the prices, heterogeneous patterns in price synchronisations and their changing paths over time. Empirical results show that the degree of comovements is slightly lower after March 2017 but no persistent drop is found. Several groups of cities are identified, each of which has its members showing relatively strong but volatile price synchronisations. Certain cities show potential of serving as price leaders within a group. Results here could be useful to policy analysis regarding housing price comovements.
1. Introduction
Housing markets have been growing fast in China for the past 10 years. Housing prices have become nearly everyone’s concern. Regional price trends and inter-relationships are extremely important because they directly affect people’s decisions on real estate investment and cities to reside and work. A few studies have approached this problem in a limited scope under the empirical framework of the vector autoregression. For example, Yang et al. (Reference Yang, Liu and Leatham2013) focus on housing price dynamics from four cities, Beijing, Shanghai, Guangzhou and Chongqing, from December 2000 to May 2010. Gong et al. (Reference Gong, Hu and Boelhouwer2016) consider housing price relationships from 10 cities, Xiamen, Shenzhen, Chengdu, Kunming, Guiyang, Nanning, Changsha, Nanchang, Fuzhou and Guangzhou, from June 2005 to May 2015.
Different levels of housing price comovements across cities are helpful indicators of systemic risk in the housing market. It is important for policy makers to take cross-regional dependence, as well as its transmission mechanism, into consideration when designing policies (Zhang and Fan, Reference Zhang and Fan2019) to prevent potential market overheating. Meanwhile, understandings of dynamic connectedness among housing prices of different cities could benefit investors when optimising portfolios and diversifying risk (Antonakakis et al., Reference Antonakakis, Chatziantoniou, Floros and Gabauer2018).
While time series models, such as the vector autoregression, are powerful econometric tools to reveal spillover mechanisms, the results could be sensitive to model specifications (Zhang et al., Reference Zhang, Ji, Zhao and Horsewood2021). Vector autoregression-based estimations might be constrained by dimensionality as well for a large dataset (Zhang and Fan, Reference Zhang and Fan2019). In practice, investors often only need correlations across assets when building portfolios (Zhang et al., Reference Zhang, Ji, Zhao and Horsewood2021). Correlations between two variables could be influenced by other variables in a system and they might vary with time.
Motivated by potential challenges from the vector autoregression and practical needs of the current study, we employ the framework of network analysis. This approach allows for avoidance of typical dimensionality constraints for many time series models and incorporations of practical concerns that investment diversifications are essentially constructed on understandings of correlations (Zhang et al., Reference Zhang, Ji, Zhao and Horsewood2021).
The current study focuses on shedding light on comovements and heterogeneities in monthly housing prices of 99 major cities for the years 2010–2019. We adopt a correlation-based method that measures closeness of different prices and a derived hierarchical network from the correlation that allows for characterisations of the topology and hierarchy showing interactions and interdependence of all prices in the network.Footnote 1 To authors’ knowledge, this is the first study on housing prices of all major cities in China by using network analysis. We build correlation and distance matrices for the 99 price series. From these matrices, we construct hierarchical structures of price interactions that allow for identifications of groups of cities with similar price comovements and dynamics. The measurement of price comovements here considers overall dynamic linkages in the price system. The empirical framework also facilitates selecting groups of cities for better policy analysis concerning housing prices. Specially, we find through minimum spanning tree (MST) analysis that housing prices of Nanjing and Kunshan, Tianjin and Wuhan, Changzhou and Changsha, Changchun and Zibo, and Shantou and Dongying are directly connected. We also find that these five pairs of cities form sectoral groups through hierarchical tree (HT) analysis. We discuss potential reasons behind these findings. Our results show that the degree of housing price comovements across all cities is slightly lower after March 2017 but no persistent drop is identified. Meanwhile, several groups of cities are determined, each of which has its members showing relatively strong but volatile price synchronisations. For example, there is a significant drop in the synchronisation between Tianjin and Wuhan, but a significant increase between Nanjing and Kunshan and between Shantou and Dongying after late 2018. It is also observed that there is no persistent high or low synchronisation within a specific group. Finally, rolling importance analysis of different cities reveals no persistent increasing or decreasing trend for a city’s housing price.
2. Literature review
In economic analysis, much effort has been devoted to studying housing price relationships. Fundamental econometric models such as the autoregressive, vector autoregressive and vector error correction approaches, as well as their numerous variations, have been widely used to facilitate the analysis. For example, Zhu et al. (Reference Zhu, Füss and Rottke2013) use Case–Shiller housing price indices for 1995–2009 to examine spatial linkages in returns, idiosyncratic risks and volatilities across 19 U.S. regional housing markets under the framework of the dynamic space panel model including generalised autoregressive conditional heteroskedasticity terms and with the spatial weight matrix. They find that interconnections across markets could be wider than expected, as economic proximity, in addition to geographic closeness, is an important source of influence, and the interconnections could be stronger than expected due to the significant contagion effects during the 2007–2009 subprime and financial crises. Their results suggest that increased comovement and interdependence, particularly among geographically diverse regions with similar economic conditions, might help explain the failure of the geographic portfolio diversification strategy. Chiang (Reference Chiang2016) uses data from six Chinese mega cities for 2003–2014 to create three submarket panels to investigate dynamic interactions among the residential, office and retail markets. Through panel cointegration tests, they do not find a long-run equilibrium among the three property submarkets. With panel causality tests, they find that changes in the residential market lead to those in the commercial market. Their results suggest that policy makers should specially emphasise on the residential market to restrain the rising real estate prices. Yang et al. (Reference Yang, Yu and Deng2018) explore housing price spillovers among 69 large- and medium-sized Chinese cities for July 2005–June 2015 under the high-dimensional generalised vector autoregressive framework. They find highly interactive housing prices. Their results suggest that important cities in price spillover networks appear to be consistent with core cities supported by regional development plans of the government and agglomerate in five relatively concentrated areas. They also identify significant determinants of the (net) positive spillover, including a higher administrative status, population, city gross domestic product and secondary education. Zhang and Fan (Reference Zhang and Fan2019) utilise the vector autoregressive-based time series approach to study short-run dynamics of urban housing prices in 70 Chinese cities for April 2006–July 2016 and find that prices across cities have increasingly connected, which consequentially is associated with higher systemic risk.
Network analysis is a useful tool for economic analysis of comovements and heterogeneities among different variables. For example, Hidalgo and Hausmann (Reference Hidalgo and Hausmann2009) use it to develop a view of economic growth and development which gives a central role to the complexity of a country’s economy. Miśkiewicz and Ausloos (Reference Miśkiewicz and Ausloos2010) utilise it to approach the question of whether the world economy has reached its globalisation limit. Reyes et al. (Reference Reyes, Schiavo and Fagiolo2010) employ it to facilitate analysis of the pattern of international integration followed by East Asian countries and Latin American countries. Kristoufek et al. (Reference Kristoufek, Janda and Zilberman2012) adopt it to analyse relationships between prices of biodiesel, ethanol and related fuels and agricultural commodities. Minoiu and Reyes (Reference Minoiu and Reyes2013) apply it to explore the global banking network with data on cross-border banking flows for 184 countries. Matesanz et al. (Reference Matesanz, Torgler, Dabat and Ortega2014) exploit it to shed light on comovements in a wide group of commodity prices. Recently, it is used for housing price analysis. Zhang et al. (Reference Zhang, Ji, Zhao and Horsewood2021) propose a network approach based on partial correlations along with rolling-window analysis to analyse cross-regional dependency in the U.K. housing market, using regional house price indices. They find that regional housing market interactions are most strongly influenced by house prices in the outer South East region and the influence is stronger for highly interconnected markets. They also find that house prices in London would have the strongest influence when regional housing markets are less connected. Wu et al. (Reference Wu, Li, Chong and Niu2021) use sale prices of stocking houses from 35 large- and medium-sized cities in China for 2010–2021 to investigate the spatial linkage through a modified gravity model and network analysis. They find that the integration degree of the housing price network is relatively low and housing price influences are polarised. They also identify several cities whose house prices have a relatively higher degree of centrality and several whose house prices are relatively isolated.
Previous studies on housing prices have linked them to different factors, including house-related characteristics (e.g., Peterson and Flanagan, Reference Peterson and Flanagan2009; Selim, Reference Selim2009) such as the house age, type, number of units, lot size, number of stories, baths, exterior composition and location, macroeconomics (e.g., Kang et al., Reference Kang, Lee, Jeong, Lee and Oh2020; Lam et al., Reference Lam, Yu and Lam2008; Rafiei and Adeli, Reference Rafiei and Adeli2016) such as the gross domestic product, gross national product, consumer price index, stock market index, interest rate, default rate and unemployment, and their own time series properties (e.g., Gong et al., Reference Gong, Hu and Boelhouwer2016; Gu et al., Reference Gu, Zhu and Jiang2011; Yang et al., Reference Yang, Liu and Leatham2013). Our study here focuses on house prices themselves for analysis of price relationships.
3. Data
Data for analysis are sourced from the China Real Estate Index System (CREIS), which is an analytical platform designed to reflect market conditions and development trends of housing markets in major cities in China. Its origin dates back to 1994, initiated by the Development Research Center of the State Council, Real Estate Association and National Real Estate Development Group Corporation. In 1995 and 2005, CREIS was audited by academic experts from the Development Research Center of the State Council, Ministry of Construction, Ministry of Land and Resources, Banking Regulatory Commission, Real Estate Association and certain universities. Currently, it publishes periodically different housing price indices, including the 100 city index, city composite index, residential index, hedonic index, office building index, retail index, villa price index, second-hand housing sales index and rental price index, and becomes the system with the widest coverage in terms of housing markets. We make use of the 100 city index, which became available in CREIS in 2010.
For a specific city, the price index is calculated as:
 $ {P}_j^t=\frac{\sum {P}_{ij}^t\times {Q}_{ij}}{\sum {Q}_{ij}} $
, where
 $ {P}_j^t $
represents the average housing price in the
 $ j $
th city at time
 $ t $
,
 $ {P}_{ij}^t $
represents the housing price of the
 $ i $
th project in the
 $ j $
th city at time
 $ t $
and
 $ {Q}_{ij} $
represents the construction area of the
 $ i $
th project in the
 $ j $
th city.
The data span from June 2010 to May 2019.Footnote
2
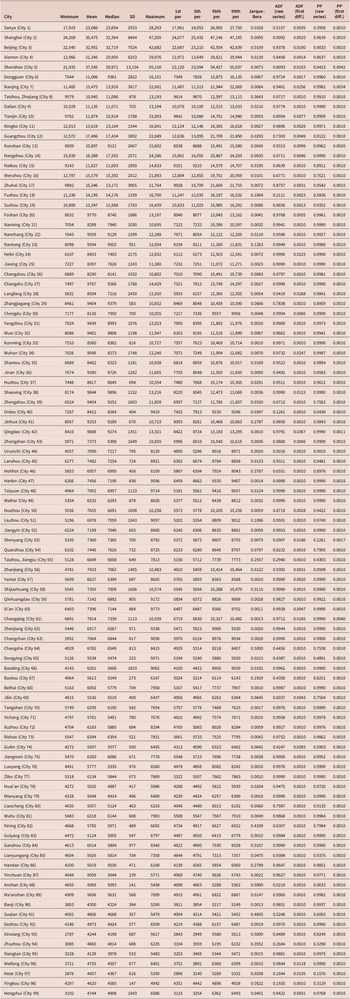
Table 1 shows summary statistics of housing prices across the 99 cities plotted in figure 1, including the minimum, mean, median, standard deviation (SD), maximum, 1st percentile, 5th percentile, 95th percentile, 99th percentile and
 $ p $
-values of the Jarque–Bera test (Jarque and Bera, Reference Jarque and Bera1980), augmented Dickey–Fuller (ADF) test (Dickey and Fuller, Reference Dickey and Fuller1979) based on the raw series and first difference series, and Phillips–Perron test (Phillips and Perron, Reference Phillips and Perron1988) based on the raw series and first difference series. At the 5 per cent significance level, housing prices of 80 cities are found to be non-normally distributed based on the Jarque–Bera test, while those of the remaining 19 cities are not. Among the 19 cities, housing prices of Taizhou (Zhejiang), Fuzhou, Nantong, Zhangjiagang, Hohhot, Taizhou (Jiangsu), Baotou, Handan, Anshan and Yingkou appear to be closer to be normally distributed than other cities. However, we note that there is no single city showing housing prices nicely matching a normal distribution. The ADF and Phillips–Perron (PP) tests generally show that the raw series are not stationary but the first differences are.
Data summary statistics

(Colour online) Ninety-nine cities considered in this study

4. Method
4.1. Hierarchical analysis
Consider two time series,
 $ {TS}_i $
and
 $ {TS}_j $
. The Pearson correlation coefficient between them is
 $ {\rho}_{i,j} $
in equation (1), where
 $ {N}_{win} $
is the length of a temporal window and
 $ \overline{TS} $
is the average of a time series over the window.
 $$ {\rho}_{i,j}=\frac{\sum_{k=1}^{N_{win}}\left({TS}_i(k)-\overline{TS_i}\right)\left({TS}_j(k)-\overline{TS_j}\right)}{\sqrt{\sum_{k=1}^{N_{win}}{\left({TS}_i(k)-\overline{TS_i}\right)}^2{\sum}_{k=1}^{N_{win}}{\left({TS}_j(k)-\overline{TS_j}\right)}^2}}. $$
Following Gower (Reference Gower1966), the distance between the evolution of
 $ {TS}_i $
and
 $ {TS}_j $
is
 $ {D}_{i,j} $
in equation (2), which is used to build the appropriate taxonomy. Intuitively, small distance is associated with two synchronised series and large distance with two independent series.
 $$ {D}_{i,j}=\sqrt{2\left(1-|{\rho}_{i,j}|\right)}. $$
With
 $ {D}_{i,j} $
, the MST is built following the Kruskal (Reference Kruskal1956) algorithm, which starts with connecting the closest series revealed via their shortest distance. Through connecting the remaining series based on their closeness to previously linked series, one will arrive at the MST, which is a loop-free network showing the most important connections and communities.
The HT also is built following the single-linkage clustering algorithm (Johnson, Reference Johnson1967), which uses the hierarchical dendrogram to show clustering characteristics of the series. In complex networks, clustering based on similarities of certain characteristics is one way to define communities (Wasserman and Faust, Reference Wasserman and Faust1994).
Through the MST and HT, one could arrive at clusters based on correlations showing similar patterns in terms of price dynamics. When conducting hierarchical analysis, time series in the first differences representation are employed and
 $ {N}_{win}=107 $
.
4.2. Synchronisation
For
 $ {N}_{win}=12 $
, 1 year, two rolling-window-based synchronisation measurements are considered to show the evolution of interdependence among series. The first one is the global correlation (GC), which is the sum of all correlation pairs among series normalised by the number of pairs. The second one is the MST cost (MSTC), which is the sum of all distance pairs among series normalised by the number of pairs. The normalisation enables comparisons of results when different numbers of series are studied. Intuitively, the tighter the series are linked, the higher the GC or the low the MSTC. Due to this reason, we will focus on presenting GC-based results.
Also for
 $ {N}_{win}=12 $
, another rolling-window-based measurement considered is the synchronisation intensity (SI), which is the number of connections for each series inside the MST weighed by the distance of the connections. The SI helps characterise how each series moves within the network over time and whether it turns to be more or less synchronised.
5. Result
One main advantage of network analysis is that it allows one to go beyond first-order relationships and capture the whole structure of relationships (Reyes et al., Reference Reyes, Schiavo and Fagiolo2010) that form the housing price system. For example, one could study housing price interactions between any two or more cities that relate to a given one and evaluate the closeness of housing price relationships among a set of cities. This could help us understand specific properties of housing price linkages characterising different (groups of) cities. In network analysis, relatively important housing prices might not necessarily be those whose corresponding cities have the most advanced economy but rather those involved in a large number of linkages.
Figure 2 shows the MST, which provides a rough representation of the topological organisation in the sense that price series are directly linked if they tend to be more synchronised. In other words, one could see from the MST those cities that tend to be more connected with others and those that tend to have more specific or idiosyncratic price paths. For example, Cities 7 (Nanjing) and 13 (Kunshan), 10 (Tianjin) and 34 (Wuhan), 26 (Changzhou) and 64 (Changsha), 63 (Changchun) and 77 (Zibo), and 35 (Shantou) and 65 (Dongying) are directly connected. The connection between Nanjing and Kunshan is not surprising as they both locate in Jiangsu province and share certain regional economic development commonalities. The connection between Tianjin and Wuhan could be partly due to their logistics linkage (van de Bovenkamp and Fei, Reference van de Bovenkamp and Fei2016) that contributes to the economic integration. The connection between Changzhou and Changsha should be related to their synergistic development along the Yangtze River economic belt (Ma et al., Reference Ma, Deng and Zhang2017; Xu et al., Reference Xu, Yang, Liu, Zhang and Li2017; Zeng et al., Reference Zeng, Yang and Wang2018, Reference Zeng, Cao and Wang2020; Zhong et al., Reference Zhong, Feng and Wen2016) and similarities in some key economic sectors (Wang and Chen, Reference Wang and Chen2011; Xu et al., Reference Xu, Yang, Liu, Zhang and Li2017; Zhou, Reference Zhou2014). The connection between Changchun and Zibo is probably related to the national initiative aiming at promoting economic development and industrial transformation and upgrading in these cities. The connection between Shantou and Dongying is likely due to their similar coastal economies (Chen, Reference Chen2007) and characteristics of urban land use (Cao et al., Reference Cao, Yuan, Zhou and Qian2009; Lu et al., Reference Lu, Yang and Chen2020).
Minimum spanning tree. The numbers represent the 99 cities whose indices are shown in table 1. Please zoom in for a better view of the numbers in this plot

Figure 3 shows the HT, which shows the hierarchical structure based on proximity of price dynamics. In other words, one could discover groups of cities with similar price dynamics and cities with more idiosyncratic price paths. As compared to the MST, the HT also reveals comovements of price clusters that are created endogenously (Matesanz et al., Reference Matesanz, Torgler, Dabat and Ortega2014). While we could see different degrees of heterogeneities in price dynamics from the HT, several sectoral groups are formed, including Group 1—Cities 7 (Nanjing) and 13 (Kunshan), Group 2—Cities 10 (Tianjin) and 34 (Wuhan), Group 3—Cities 26 (Changzhou) and 64 (Changsha), Group 4—Cities 63 (Changchun) and 77 (Zibo), and Group 5—Cities 35 (Shantou) and 65 (Dongying). For Group 1, housing prices of Kunshan might be influenced by those of Nanjing. Kunshan is surrounded by three of the largest cities in China that include Shanghai, Nanjing and Hangzhou of Zhejiang province (Long et al., Reference Long, Tang, Li and Heilig2007). Kunshan is unique due to its high population density and agricultural intensity. The growth of Shanghai, prosperity of Nanjing and Hangzhou and policies established by the Kunshan local government for developing townships and village enterprises have pushed the economic development of Kunshan (Long et al., Reference Long, Tang, Li and Heilig2007). Our result of the sectoral group between housing prices of Nanjing and Kunshan is likely to be related to their regional economic relationships. For Group 2, housing prices of Tianjin might be influenced by those of Wuhan. Being the central location in China, Hubei province has obvious advantages in terms of regional transportation. Wuhan, the capital city of Hubei province, is being promoted by the provincial government to become a major industrial and commercial city. One of the goals is to construct Wuhan as a national logistics hub with good layouts of modern logistic parks, logistic centres and distribution centres that fulfil domestic and global (e.g., the ‘one belt one road’ initiative) needs (van de Bovenkamp and Fei, Reference van de Bovenkamp and Fei2016). Wuhan also serves as the shipping centre of the Yangtze River’s middle section. Over the past few years, the ‘four horizontal and four vertical’ passenger line initiative’s speed transport networks have been significantly expanded in China, which lead to an 8-hour provincial capital traffic circles. Wuhan serves as the intersection of the high-speed transport networks and is within a 4-hour traffic circle from important cities in China, which include Beijing, Shanghai, Chongqing, Guangzhou and Tianjin. Our result of the sectoral group between housing prices of Wuhan and Tianjin is likely driven by their economic integration facilitated by the logistics linkage. For Group 3, housing prices of Changzhou and Changsha might affect each other. Zeng et al. (Reference Zeng, Yang and Wang2018) rank both cities of regional importance along the Yangtze River economic belt, considering their economic development, technological innovation, transportation infrastructure and ecological environment. Zhong et al. (Reference Zhong, Feng and Wen2016) point out that Changzhou was one of six central cities along the Yangtze River economic belt in 1988 and 2001, considering their economic connections with other cities, and the six central cities are changing over time. For example, Zhong et al. (Reference Zhong, Feng and Wen2016) find that Changsha was one of six central cities in 2012 while Changzhou was not on the list for that year. Ma et al.’s (Reference Ma, Deng and Zhang2017) study suggests that Changsha is becoming more important along the Yangtze River economic belt in 2015, while Changzhou needs to improve its population size and economic scale to rejoin the list of central cities along the belt. More recently, Zeng et al. (Reference Zeng, Cao and Wang2020) rank both Changzhou and Changsha as regional significant central cities along the belt in 2019, with Changsha leading Changzhou. These two cities also have similarities in some key economic sectors, such as the tourism (Wang and Chen, Reference Wang and Chen2011), construction machinery (Zhou, Reference Zhou2014) and innovative output (Xu et al., Reference Xu, Yang, Liu, Zhang and Li2017). Our result of the sectoral group between housing prices of Changzhou and Changsha might be partly explained by the synergistic development along the belt, evolving economic scales, similarities of economic sectors, and thus migrating labour force. For Group 4, housing prices of Zibo might be influenced by those of Changchun. These two cities’ economies both used to heavily rely on energy and resources. The national initiative aiming at industrial transformation and upgrading for green and innovative economic growth covers Zibo and Changchun, with the latter showing more promising outcomes in recent years and the former facing the slow population growth challenge. Nevertheless, both cities are ranked as achieving satisfying industrial transformation and upgrading results in 2020 by pushing the establishment of green and innovative industrial enterprises with local governments’ efforts. These new enterprises in the two cities have similarities in terms of the economic sectors covered, such as the agriculture, education, service and technology, for balanced development and compete for labour force. While industrial transformation and upgrading could be a way to help local governments avoid relying on the real estate sector and land fiscal revenue in the long run, such reliance might be hard to avoid during the transition period (Liu, Reference Liu2010) that could be discovered from these two cities’ land policies and housing prices in the past decade. Our result of the sectoral group between housing prices of Changchun and Zibo should be tied to the common national initiative. For Group 5, housing prices of Shantou and Dongying might affect each other. These two cities have similar coastal economies and Shantou’s economy has developed significantly so that it has similar economic scales as Dongying (Chen, Reference Chen2007). Chen (Reference Chen2007) also finds that these two cities have the same regional industrial structure. Cao et al. (Reference Cao, Yuan, Zhou and Qian2009) and Lu et al. (Reference Lu, Yang and Chen2020) study the urban land use issue for 2005–2006 and 2003–2017, respectively, and find that these two cities show close results in terms of the land use efficiency. Our result of the sectoral group between housing prices of Shantou and Dongying could stem from their similar economic structures and land use characteristics.
(Colour online) Hierarchical tree. The numbers on the horizontal axis represent the 99 cities whose indices are shown in table 1

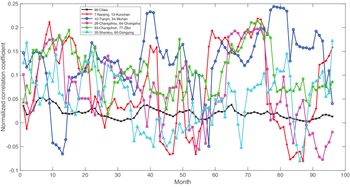
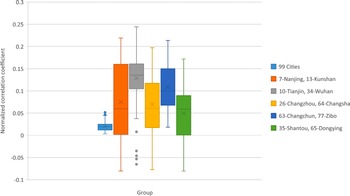
Figure 4 shows the GC for all of the 99 cities (Group 0) and cities in Groups 1–5, which sheds light on price interactions between all city pairs of a group and thus price comovement information in the group. The distribution of the GC is also plotted in figure 5. For Group 0, the synchronisation is relatively low and stable over time, which slightly decreases on average after March 2017, indicating that the housing market might become more regionalised recently. For Groups 1–5, the synchronisation is much more volatile but also at significantly higher levels on average as compared to Group 0, suggesting obvious heterogeneous price dynamics within specific groups of cities. For example, there is a significant drop in the synchronisation between Tianjin and Wuhan, but a significant increase between Nanjing and Kunshan and between Shantou and Dongying after late 2018. For Groups 1–5, it is also observed that there is no persistent high or low synchronisation within a specific group, revealing that economic development within a specific group could be related but there exist obvious idiosyncratic paths contributing to the ever-fluctuating synchronisation. These results indicate that certain policy analysis, for example, market microstructure and forecasting (Xu and Zhang, Reference Xu and Zhang2021c), related to housing prices of individual cities might be better conducted by taking into consideration the synchronisation and heterogeneity.
(Colour online) Global correlation

(Colour online) The box and whisker plot of the global correlation in figure 4. The box and whisker plot contains the mean, median, first quartile, third quartile, interquartile range (IQR) and outliers, where a point is considered an outlier if it exceeds a distance of 1.5 times the IQR below the first quartile or above the third quartile

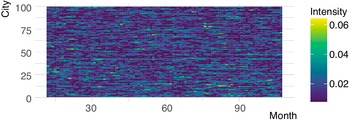
Figure 6 shows the SI, which helps determine the rolling importance of different cities in the network. One could see that over time, the SI is fluctuating, with no persistent increasing or decreasing trend for a city. There are cities [e.g., City 63 (Changchun)] whose prices appear to be more connected to other prices in the network. These cities could be price leaders in their respective groups (Matesanz et al., Reference Matesanz, Torgler, Dabat and Ortega2014), which might be tested by lead-lag (e.g., Li et al., Reference Li, Yang, Hsiao and Chang2005; Xu, Reference Xu2014b,Reference Xuc, Reference Xu2015b, Reference Xu2017b,Reference Xuc, Reference Xu2018a,Reference Xub,Reference Xuc,Reference Xud,Reference Xue, Reference Xu2019a,Reference Xuc, Reference Xu2020; Xu and Thurman, Reference Xu and Thurman2015a,Reference Xu and Thurmanb; Yang et al., Reference Yang, Bessler and Leatham2001, Reference Yang, Kolari and Min2003, Reference Yang, Hsiao, Li and Wang2006, Reference Yang, Yang and Zhou2012, Reference Yang, Li and Wang2020; Yang and Leatham, Reference Yang and Leatham1999) and contemporaneous (e.g., Awokuse and Bessler, Reference Awokuse and Bessler2003; Bessler et al., Reference Bessler, Yang and Wongcharupan2003; Bessler and Akleman, Reference Bessler and Akleman1998; Bessler and Yang, Reference Bessler and Yang2003; Bizimana et al., Reference Bizimana, Angerer, Bessler and Keita2015; Chopra and Bessler, Reference Chopra and Bessler2005; Haigh and Bessler, Reference Haigh and Bessler2004; Lai and Bessler, Reference Lai and Bessler2015; Xu, Reference Xu2014a, Reference Xu2015a, Reference Xu2017a, Reference Xu2019a,Reference Xub; Yang and Bessler, Reference Yang and Bessler2004) causality. Here, it is worth noting that the fact that the MST and HT methodologies are very straightforward is not only their advantage but also potentially their limitation depending on specific research purposes. Particularly, one could not directly comment on causality-related questions based on the results (Kristoufek et al., Reference Kristoufek, Janda and Zilberman2012).
(Colour online) Synchronisation intensity. City indices are shown in table 1

6. Conclusion
This study analyses comovements of monthly housing prices of 99 major cities in China for the years 2010–2019 by shedding light on interdependence and synchronisation through network analysis and topological and hierarchical characterisations of price dynamics. The empirical framework facilitates endogenous identifications of city groups with similar price synchronisation patterns, which can benefit policy analysis concerning housing prices of individual cities. The framework also enables us to figure out price interactions, allowing for complexities and heterogeneities in the price system.
We find that housing prices of Nanjing and Kunshan, Tianjin and Wuhan, Changzhou and Changsha, Changchun and Zibo, and Shantou and Dongying are directly connected. We also find that these five pairs of cities form sectoral groups. Potential reasons for these findings include factors such as economic integration, synergistic development and policy initiatives. The degree of comovements is generally slightly lower after March 2017 but no persistent drop is discovered. This suggests that there could be supply and demand pattern changes after March 2017 that decrease regional housing price synchronisation. We identify several groups of cities, each of which has its members generally showing relatively strong but volatile price dynamics across the sample period. Price synchronisation, on average, within a certain group also is higher than that across all of the 99 cities. Housing prices of cities in an identified group might be driven by group specific factors in addition to common factors across the nation. Further, we show that certain cities have potential of being price leaders within an identified group due to their increasing connectivities over time with other cities. These heterogeneities in price dynamics should be useful to policy analysis aiming at housing market stabilisation.
As one could not directly comment on causality-related questions based on results here (Kristoufek et al., Reference Kristoufek, Janda and Zilberman2012), it could be a worthwhile avenue to pursue this topic for future research. Results here might be of use when selecting certain cities for analysis, which could help alleviate the dimensionality issue of time series models (Zhang and Fan, Reference Zhang and Fan2019). Our analysis focuses on the 100 major cities. As there are more than 700 cities in China, it would be interesting to extend the analysis to this magnitude if data become available in the future. Analysis of housing price comovements can be helpful in monitoring nationwide and regional overheating in the real estate market and thus risks and bubbles. Excessive comovements identified could serve as warning indicators to policy makers when designing policies to cool down the market from the perspective of multiple locations. The evolving pattern of housing price comovements over time can also help shed light on different cities’ economic development processes. It might be valuable to policy makers to sort out if it is the speculative capital inflow or fundamental economic development that makes a city’s housing prices more important and connected to other cities over time.