Implications
It is widely accepted that the amount and type of fat in meat influence two major components of meat quality notably tenderness and flavour. In addition, change in fatty acid (FA) profiles of meat can reduce the risk of cardiovascular diseases, cancer and diabetes. Our study shows the ability of NIR spectroscopy to accurately predict FA profile of individual carcasses under abattoir conditions. This information could help to develop a value-based marketing system for meat quality and be used in breeding programmes to genetically improve FA profiles of meat.
Introduction
The amount and proportion of fatty acid (FA) in beef intramuscular fat (IMF) are key factors that influence technological and sensory meat quality, especially shelf life (lipid and pigment oxidation) and flavour (Elmore et al., Reference Elmore, Mottram, Enser and Wood1999; Vatansever et al., Reference Vatansever, Kurt, Enser, Nute, Gill and Richardson2000; Wood et al., Reference Wood, Richardson, Nute, Fisher, Campo, Kasapidou, Sheard and Enser2003). Individual FA have very different melting points that affect the firmness or softness of the fat in meat, especially the subcutaneous and IMF, but also the IMF. Groups of fat cells containing solidified fat with a high melting point appear whiter than liquid fat with a lower melting point, such that fat colour is another aspect of lean meat quality affected by FA composition. Furthermore, the ability of unsaturated FA to rapidly oxidize, especially those containing more than two double bonds, influences the rancidity and colour deterioration of meat and the flavour development during cooking (Wood et al., Reference Wood, Richardson, Nute, Fisher, Campo, Kasapidou, Sheard and Enser2003).
Consumers are interested in the fat composition of meat, as scientific evidence suggests that diets high in saturated fat are associated with increased levels of blood total and low-density lipoprotein-cholesterol, which results in increased risk of cardiovascular diseases (Webb and O’Neill, Reference Webb and O’Neill2008). Coronary heart disease is one of the major public health concerns, primarily because it accounts for more deaths than any other disease or group of diseases. Thus, a lower saturated FA (SFA) intake and a higher polyunsaturated FA (PUFA) intake, especially of n-3 FA for an appropriate n-6/n-3 balance, are recommended in order to avoid cardiovascular-type diseases. The consumption of beef in human diets also supplies conjugated linoleic acids (CLA), which are a group of positional and geometrical isomers that are associated with beneficial health properties such as reducing the risk for cancer, atherosclerosis and diabetes (Enser, Reference Enser2001; Rainer and Heiss, Reference Rainer and Heiss2004). In addition, the amount and composition of ruminant IMF depends on factors such as diet (Gatellier et al., Reference Gatellier, Mercier, Juin and Renerre2005; Dannenberger et al., Reference Dannenberger, Nuernberg, Scollan, Ender and Nuernberg2007), age or live weight (Okeudo and Moss, Reference Okeudo and Moss2007) and the genetic origin of the animals (Raes et al., Reference Raes, De Smet and Demeyer2001), which also explains the increasing interest in defining the FA profile of beef from different breeds.
Quantitative chemical techniques for the determination of FA involve extraction of total lipids with diethyl ether, followed by conversion of the FA to their methyl esters and then analysis by capillary gas chromatography, a costly and time-consuming process.
Near infrared reflectance (NIR) spectroscopy is a rapid and non-destructive method, neither requiring reagents nor producing waste (Osborne et al., Reference Osborne, Fearn and Hindle1993; Prieto et al., Reference Prieto, Roehe, Lavín, Batten and Andrés2009a). Owing to these advantages, this technology is being broadly used by the industry research units for large-scale meat quality evaluation to predict the chemical composition (Tøgersen et al., Reference Tøgersen, Isaksson, Nilsen, Bakker and Hildrum1999; Cozzolino and Murray, Reference Cozzolino and Murray2002; Alomar et al., Reference Alomar, Gallo, Castañeda and Fuchslocher2003; Prieto et al., Reference Prieto, Andrés, Giráldez, Mantecón and Lavín2006), as well as physical and sensory characteristics of meat (Park et al., Reference Park, Chen, Hruschka, Shackelford and Koohmaraie1998; Shackelford et al., Reference Shackelford, Wheeler and Koohmaraie2005; Andrés et al., Reference Andrés, Murray, Navajas, Fisher, Lambe and Bünger2007; Prieto et al., Reference Prieto, Andrés, Giráldez, Mantecón and Lavín2008; Prieto et al., Reference Prieto, Ross, Navajas, Nute, Richardson, Hyslop, Simm and Roehe2009b). The structure of FA can produce individual spectral characteristics and they are, therefore, very accessible for detection by near infrared spectroscopy (González-Martín et al., Reference González-Martín, González-Pérez, Hernández-Méndez, Alvarez-García and Merino Lázaro2002). Hence, NIR spectroscopy has been applied to study the FA content of Iberian pig fat (De Pedro et al., Reference De Pedro, Garrido, Bares, Casillas and Murray1992; García-Olmo et al., Reference García-Olmo, Garrido-Varo and De Pedro2001), intact pork loins (González-Martín et al., Reference González-Martín, González-Pérez, Alvarez-García and Gónzalez-Cabrera2005) and ground beef (Windham and Morrison, Reference Windham and Morrison1998; Realini et al., Reference Realini, Duckett and Windham2004; Sierra et al., Reference Sierra, Aldai, Castro, Osoro, Coto-Montes and Oliván2008).
As part of a much wider meat-eating quality project, this study examined the use of NIR spectroscopy for the online estimation of FA (individual and groups) composition and IMF content of beef from Aberdeen Angus (AA×) and Limousin (LIM×) crossbred cattle, by direct application of a fibre-optic probe to the M. longissimus thoracis immediately after exposing the meat surface in the abattoir. The animals used in the analysis were mostly from our experimental farm where the diet was the same for all animals to detect genetic differences between breeds independent from the diet.
Material and methods
Animals and meat samples
Data were collected on 194 crossbred steers and heifers, whereby 88 and 106 were sired by either AA or LIM sires, respectively. A total of 144 of these animals were obtained from the Beef Research Centre (BRC) situated at the Scottish Agricultural College, Edinburgh. All these 144 animals from the BRC were finishing during the final 2 to 4 months of their production cycle on similar diets consisting of first cut grass silage and a barley-based concentrate (50:50 on a dry matter (DM) basis) which was offered ad libitum as a completely mixed ration on a daily basis. The ration analysis averaged 381 g/kg DM, 12.0 MJ/kg DM metabolizable energy and 139 g/kg DM crude protein. All animals remained on these diets for a minimum of 8 weeks after which they were selected for slaughter according to standard commercial practice (target grades R4L or better). A further 50 crossbred AA× and LIM× steers and heifers were selected at the abattoir from commercial farms where, although the ration formulation is not known, their ages and slaughter dates suggest that their finishing management was likely to be similar to that at the BRC. All 194 animals were slaughtered in 11 batches from autumn 2006 until late winter 2008 (batches 1 to 3, 4 to 8 and 9 to 11 during the autumn and winter of 2006, 2007 and 2008, respectively) where the average live weight was 582 and 609 kg and age at slaughter was 546 and 544 days for AA× and LIM× sired beef cattle, respectively.
The left sides of the carcasses were cut at the 13th rib at 48 h post mortem. NIR measurements were taken on the caudal cut surface of the M. longissimus thoracis. After removing a 125 mm section, the next 25 mm of the M. longissimus lumborum was taken, vacuum packed and frozen for subsequent analysis of FA composition.
FA and IMF analysis
FA analysis was carried out by direct saponification as described in detail by Teye et al. (Reference Teye, Sheard, Whittington, Nute, Stewart and Wood2006). Samples were hydrolysed with 2 M KOH in water : methanol (1 : 1) and the FAs extracted into petroleum spirit, methylated using diazomethane and analysed by gas liquid chromatography. Samples were injected in the split mode, 70:1, onto a CP Sil 88, 50 m × 0.25 mm fatty acid methyl esters (FAME) column (Chrompack UK Ltd, London, UK) with helium as the carrier gas. The output from the flame ionization detector was quantified using a computing integrator (Spectra Physics 4270; Darmstadt, Germany) and linearity of the system was tested using saturated (FAME4) and monounsaturated (FAME5) methyl ester quantitative standards (Thames Restek UK Ltd, Windsor, UK). All measurements of FA were performed in duplicate, the error between replications being usually 1% to 2% with a maximum allowance of 5% error. Total IMF content was calculated gravimetrically as total weight of FA extracted.
Spectra collection
NIR measurements were taken at 48 h post mortem by placing the active area scanning head, 63.5 mm in diameter, over the surface of the exposed M. longissimus thoracis and recording a spectrum from 350 to 1800 nm, by means of a NIR spectrophotometer (Qualityspec Pro, ASD Inc., Boulder, CO, USA). Twenty replicate measurements were taken by moving and rotating the scanning head around the muscle surface. The sampling error of measurements is reduced due to the large area measured by the NIR head (Downey and Hildrum, Reference Downey and Hildrum2004). The scanning head incorporated a broad-band light source for tissue illumination and a sampling fibre optic probe that passed the reflected light back to the spectrometer. The spectrometer interpolated the data to produce measurements in 1-nm steps, resulting in a diffuse reflectance spectrum of 1451 data points. Absorbance data were stored as log (1/R), where R is the reflectance. The twenty reflectance spectra of each sample were visually examined for consistency and then averaged. The instrument was operated by the proprietary software package Indico Pro (ASD Inc.).
Data analysis
The effect of breed cross (AA× or LIM×) on FA composition measured by chemical analysis was estimated using the general linear models procedure of the SAS package (SAS, 2003). Calibration and validation of the NIR data were performed using The UNSCRAMBLER program (version 8.5.0, Camo, Trondheim, Norway). The detection of anomalous spectra was accomplished using the Mahalanobis distance (H-statistic) to the centre of the population, which indicates how different a sample spectrum is from the average spectrum of the set (Williams and Norris, Reference Williams and Norris2001). A sample with an H-statistic of ⩾3.0 standardized units from the mean spectrum was defined as a global H outlier and was eliminated from the population. In addition, some samples were removed from the initial data set as concentration outliers (T-statistic), which measure how closely the reference value matches the predicted value. Hence, the samples whose predicted values exceed 2.5 times the standard error of estimation were considered as T-statistic outliers and excluded from the population. As NIR spectra are affected by particle size, light scatter and path-length variation, pre-treatments of the spectral data improve the accuracy of calibration. Thus, spectral data pre-treatments such as multiplicative scatter correction (MSC; Dhanoa et al., Reference Dhanoa, Lister, Sanderson and Barnes1994) and first- or second-order derivatives (Shenk et al., Reference Shenk, Workman and Westerhaus1992) were applied to the spectra. MSC reduces multi-colinearity and the confusing effects of baseline shift and curvature of the spectra arising from scattering effects because of physical effects. The use of first- and second-order derivatives increase the resolution of spectrum peaks, hence highlighting the signals related to the chemical composition of the meat samples (Davies and Grant, Reference Davies and Grant1987). Partial least square regression type I (PLSR1) was used for predicting FA concentration using NIR spectra as independent variables. Internal full cross-validation was performed in order to avoid over-fitting the PLSR equations. Thus, the optimal number of factors in each equation was determined as the number of factors after which the standard error of cross-validation no longer decreased substantially. The accuracy of prediction was evaluated in terms of coefficient of determination (R 2) and standard error of cross-validation (SECV) (Westerhaus et al., Reference Westerhaus, Workman, Reeves and Mark2004).
Results and discussion
Chemical data
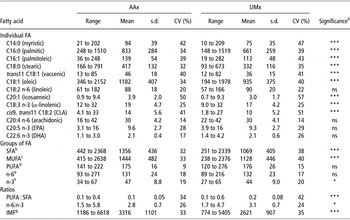
Ranges, means, standard deviations and coefficients of variation (CV) of the FA profile (individual and groups) and IMF content of AA× and LIM× muscle samples are summarized in Table 1. Most authors express FA data on a percentage basis (percentage of the total FA) when used for prediction by NIR spectroscopy. Only Sierra et al. (Reference Sierra, Aldai, Castro, Osoro, Coto-Montes and Oliván2008) used reference data expressed in absolute concentrations (weight of muscle) in order to perform the NIR calibrations. In this study, FAs were also expressed as concentration (mg) in the muscle because in preliminary analyses higher accuracies of prediction were obtained in comparison with FA expressed of total fat. The advantage of using the amount of FA can be expected because the NIR absorbance is based on the amount of molecular bonds in the organic matrix, so correlating the NIR data with FA expressed in absolute concentrations should be more accurate than on a percentage basis. The latter may be equivalent to the ratio of amount of molecular bonds of the FA to the total molecular bonds of all FA.
Descriptive statistics for FA and IMF content (mg/100 g muscle) in Aberdeen Angus (AAx, n = 84)Footnote a and Limousin (LIMx, n = 105)Footnote a crossbred beef samples

FA = fatty acids; IMF = intramuscular fat; CLA = conjugated linoleic acid; EPA = eicosapentaenoic acid; DHA = docosahexaenoic acid; SFA = saturated fatty acids; MUFA = monounsaturated fatty acids; PUFA = polyunsaturated fatty acids.
a Number of samples after eliminating outliers.
b C12:0 + C14:0 + C16:0 + C18:0.
c C16:1 + Ct18:1 + C9c18:1 + C11c18:1 + C20:1.
d C18:2n-6 + C18:3n-3 + C20:3n-6 + C20:4n-6 + C20:5n-3 + C22:4n-6 + C22:5n-3 + C22:6n-3.
e C18:2 + C20:3 + C20:4 + C22:4.
f C18:3 + C20:5 + C22:5 + C22:6.
g Intramuscular fat.
h ns = P > 0.05.
* P < 0.05, ***P < 0.001.
In general terms, the values of concentration for individual and groups of FA as well as the IMF content in both AA× and LIM× beef samples were within the normal range of variation reported by other authors (Enser et al., Reference Enser, Hallett, Hewitt, Fursey and Wood1996 and Reference Enser, Hallett, Hewett, Fursey, Wood and Harrington1998; Sierra et al., Reference Sierra, Aldai, Castro, Osoro, Coto-Montes and Oliván2008). Statistically significant differences (P < 0.001) were observed in most individual and groups of FA and IMF content between the two breed crosses studied (Table 1), whereby FA concentration was mainly higher in AA× beef samples, which would be a consequence of these animals having greater total IMF. Non-significant differences between breed crosses were found for linoleic, arachidonic, eicosapentaenoic (EPA), docosahexaenoic (DHA), PUFA and n-6 FA, since on a standard diet the variability in supply of these FA would be small and many PUFA, especially the longer chain PUFA, are in the phospholipids fraction which does not vary much as the animal gets fatter. Most individual FA showed a broad range of concentration in both the AA× and LIM× sample populations. In general, those FA with a higher range of concentration were those with a higher presence in meat. Regarding FA groups, SFA and MUFA (monounsaturated FA) showed a high variability of concentration (see Table 1), probably due to the high heterogeneity of total IMF content of the meat samples included in this study (ranging from 1186 to 6618 and 774 to 5405 mg FA/100 g muscle for AA× and LIM× beef samples, respectively, Table 1). However, PUFA, n-6 and n-3 FA showed narrower ranges of concentration, which could be because PUFA are mainly located in membrane phospholipids, strictly controlled by a complex system of enzymes and relatively constant between individuals (Scollan et al., Reference Scollan, Hocquette, Nuernberg, Dannenberger, Richardson and Moloney2006). As animals mature and deposit more fat, the relative proportion of PUFA decreases (Warren et al., Reference Warren, Scollan, Enser, Hughes, Richardson and Wood2008). When observing the variability among samples, most individual and groups of FA and IMF content had CV higher than 20% in both AA× and LIM× samples, except for arachidonic, PUFA and n-6 FA which showed CV in the range from 9% to 18% in both breed crosses.
The ratios PUFA : SFA and n-6:n-3 FA are often used to evaluate the nutritional quality of fat. The recommendations of the Department of Health and Social Security UK (1994) are that the ratio n-6:n-3 is less than 4.0 and that the ratio PUFA : SFA is 0.45 or higher. In our study, the ratio n-6:n-3 was lower than 4 for samples from both breed crosses (2.8 and 3.1 for AA× and LIM× samples, respectively) but the ratio of PUFA : SFA was lower than 0.45 (0.1 and 0.2 for AA× and LIM×samples, respectively). A ratio of PUFA : SFA of around 0.1 has been widely found in meat of ruminants (Enser et al., Reference Enser, Hallett, Hewitt, Fursey and Wood1996 and Reference Enser, Hallett, Hewett, Fursey, Wood and Harrington1998) as microbial biohydrogenation of unsaturated FA in the rumen produces a high proportion of SFA (Scollan et al., Reference Scollan, Hocquette, Nuernberg, Dannenberger, Richardson and Moloney2006). Hence, meat has been implicated in causing the imbalanced FA intake of today’s consumers and, for this reason, ways to improve the PUFA : SFA ratio during meat production have been investigated in many studies (Sañudo et al., Reference Sañudo, Enser, Campo, Nute, Maria, Sierra and Wood2000; Sheard et al., Reference Sheard, Enser, Wood, Nute, Gill and Richardson2000; Scollan et al., Reference Scollan, Choi, Kurt, Fisher, Enser and Wood2001; Kouba et al., Reference Kouba, Enser, Whittington, Nute and Wood2003).
Spectral information
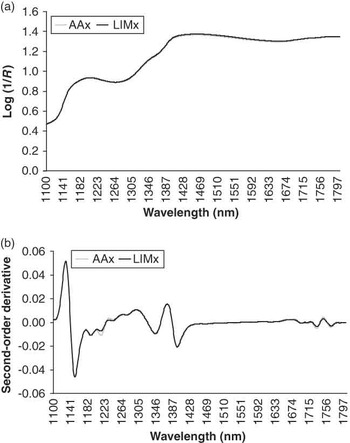
In preliminary studies, we observed that the inclusion of the visible region in the NIR equations did not substantially improve the accuracy of FA profile predictions, so we only took into account the absorbance data of wavelengths from 1100 to 1800 nm hereafter. Figure 1a shows the raw spectrum (log (1/R)), averaged over AA× or LIM× loin samples, obtained with the fibre-optic probe by direct application on the sample at 48 h post mortem. The raw average NIR spectra showed two broad peaks at 1130 to 1270 and 1400 to 1450 nm which are known wavelengths where C–H and O–H bonds cause different forms of vibration, which are related to fat and water content, respectively (Murray, Reference Murray1986; Murray and Williams, Reference Murray and Williams1987; Shenk et al., Reference Shenk, Workman and Westerhaus1992).
Average NIR spectra of the Aberdeen Angus (AA×) and Limousin (LIM×) crossbred samples of loin measured with the fibre-optic probe for the mathematical treatments: (a) none (Log (1/R)) and (b) second-order derivative.

The application of the second-order derivative to the NIR spectra results in a spectral pattern display of absorption peaks pointing downwards (Shenk et al., Reference Shenk, Workman and Westerhaus1992), but an apparent band resolution enhancement takes place because it highlights the signals related to the chemical composition of meat samples. In this sense, the peaks at 1150, 1195, 1215, 1345, 1395, 1725 and 1765 nm in the second-order derivative spectrum (Figure 1b) were located in the same wavelength as in the raw spectrum of both AA× and LIM× meat samples but with a better definition and inverted; some of them being different between both breeds. They can be attributed to the absorption of the C–H bonds present in the FA molecules (C–H first and second overtone and C–H combination bands region; Murray, Reference Murray1986; Murray and Williams, Reference Murray and Williams1987; Shenk et al., Reference Shenk, Workman and Westerhaus1992). Hence, it is possible to predict the FA profiles of meat samples based on absorbance of C–H bonds at different wavelengths of NIR measurements. Thus, all information of C–H bonds absorbance was combined and equations to estimate the amount of FA were developed separately for AA× and LIM× beef samples.
Prediction of the FA composition and IMF content
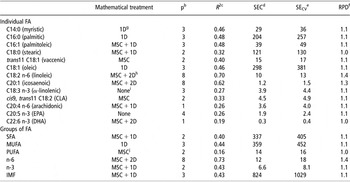
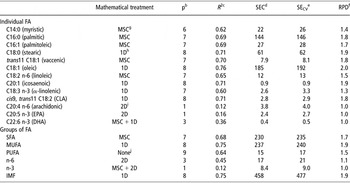
After eliminating outliers and testing different mathematical treatments, the best calibration equation for individual and groups of FA and IMF content in AA× and LIM× beef muscle samples, using the criteria of maximizing the coefficient of determination (R 2) and minimizing the standard error of cross-validation (SECV), are shown in Tables 2 and 3, respectively.
Prediction of FA profile and IMF content in Aberdeen Angus crossbred beef samples using NIR spectra (n = 84)Footnote a

FA = fatty acids; IMF = intramuscular fat; CLA = conjugated linoleic acid; EPA = eicosapentaenoic acid; DHA = docosahexaenoic acid; SFA = saturated fatty acids; MUFA = monounsaturated fatty acids; PUFA = polyunsaturated fatty acids.
a Number of samples after eliminating outliers.
b Number of partial least square terms utilized in the calibration equation.
c Coefficient of determination of calibration.
d Standard error of calibration.
e Standard error of cross-validation.
f Ratio performance deviation calculated as s.d./SECV.
g First-order derivative.
h Second-order derivative.
i Raw absorbance data (Log (1/R)).
j Multiplicative scatter correction.
Prediction of FA profile and IMF content in Limousin crossbred beef samples using NIR spectra (n = 105)Footnote a

FA = fatty acids; IMF = intramuscular fat; CLA = conjugated linoleic acid; EPA = eicosapentaenoic acid; DHA = docosahexaenoic acid; SFA = saturated fatty acids; MUFA = monounsaturated fatty acids; PUFA = polyunsaturated fatty acids.
a Number of samples after eliminating outliers.
b Number of partial least square terms utilized in the calibration equation.
c Coefficient of determination of calibration.
d Standard error of calibration.
e Standard error of cross-validation.
f Ratio performance deviation calculated as s.d./SECV.
g Multiplicative scatter correction.
h First-order derivative.
i Second-order derivative.
j Raw absorbance data (Log (1/R)).
When plotting the FA concentration predicted by NIR spectroscopy against that obtained by chemical analysis for the 88 AA× samples (graphs not shown), most samples were not homogeneously distributed along the regression line but mostly located closely together with a few samples as extreme values, which were considered outliers. This may be due to the fact that most of the tested animals were from an experimental farm where only a few sires of high genetic potential were used, and the diet was the same for these animals, which may have prevented a homogenous spread over the range of FA content in AA× samples. Hence, four outliers were deleted from the whole AA× beef sample population, whereas only one was eliminated from LIM× data; thus samples from 189 animals (84 AA× and 105 LIM×) were used to carry out the NIR calibrations. In relation to mathematical treatments, the majority of FA were more successfully predicted when MSC and/or derivatives were applied to the spectra, which reduced the noise and light scattering effects. This is in agreement with the results of González-Martín et al. (Reference González-Martín, González-Pérez, Hernández-Méndez, Alvarez-García and Merino Lázaro2002, Reference González-Martín, González-Pérez, Hernández-Méndez and Álvarez-García2003 and Reference González-Martín, González-Pérez, Alvarez-García and Gónzalez-Cabrera2005) and Sierra et al. (Reference Sierra, Aldai, Castro, Osoro, Coto-Montes and Oliván2008) who observed that the use of the MSC or SNVD treatment and/or derivatives provided the best NIR calibrations for FA content in pork and beef samples. Consequently, when calibrations were obtained from the raw absorbance data (referred to as none treatment and given as Log (1/R)), NIR predictability was mostly at a low level.
As presented in Table 2, the prediction equations for most individual and groups of FA as well as IMF content in AA× beef samples showed R 2 lower than 0.48, indicating a low NIR predictability. Furthermore, the SECV were high so that the ratio of s.d. to SECV (ratio performance deviation (RPD)) were lower than 1.14, deviating substantially from that considered in the literature as suitable for screening purposes (Williams, Reference Williams2001 and Reference Williams2008). Only for the linoleic, icosaenoic and n-6 FA, the percentage of variance explained by the model was over 60% (R 2 = 0.7, 0.6 and 0.7, respectively). Nevertheless, the SECV for these FA (SECV = 13, 1.5 and 18 mg/100 g muscle, respectively) were still high compared to s.d. (s.d. = 18, 2.0 and 24 mg/100 g muscle, respectively). Moreover, it has to be noted that a high number of partial least square factors were included in those equations (P = 8) compared to the number of samples in the population (n = 84), thus it seems probable that these equations had been over-fitted. In agreement with our results, published studies have shown that determining FA is quantitatively difficult (De Pedro et al., Reference De Pedro, Garrido, Bares, Casillas and Murray1992; Reinhardt et al., Reference Reinhardt, Paul and Röbbelen1992). According to Windham and Morrison (Reference Windham and Morrison1998), the failure to determine accurately some individual FA is probably due to the similarities in their NIR absorption pattern, because different FA have the same absorbing molecular group (–CH2–).
Accurate NIR predictions were found for most individual FA in LIM× samples (Table 3). The highest predictabilities were obtained for the palmitic, palmitoleic, stearic, vaccenic, oleic, icosaenoic and CLA with coefficients of determination of 0.69, 0.69, 0.71, 0.70, 0.76, 0.71 and 0.71, respectively, and low standard errors of cross-validation (SECV = 146, 28, 62, 8.1, 192, 0.9 and 2.9 mg/100 g muscle, respectively) compared to s.d. indicated for those FA (see Table 1). Consequently, RPD statistics ranged from 1.7 to 2.0. Statistically significant correlations (P < 0.001) among those FA and IMF content may have contributed to the accuracy of NIR predictions. In the case of the linoleic acid, the NIR predictability was lower (SECV = 13 mg/100 g muscle; RPD = 1.5), but the correspondent calibration equation still showed relatively high coefficient of determination and could be used as an approximate prediction (R 2 = 0.65). On the contrary, myristic, α-linolenic, arachidonic, EPA and DHA acids could not be accurately predicted by NIR spectroscopy (R 2 = 0.62, 0.60, 0.12, 0.16 and 0.36; SECV = 26, 3.3, 4.0, 2.7 and 0.5 mg/100 g muscle; RPD = 1.4, 1.3, 1.0, 1.0 and 1.0; respectively). It is well known that the success of this procedure relies partially on the variability present in the samples analysed, which was for most of these FA about one half of magnitude found for other FA studied (Table 1). Furthermore, statistically non-significant correlations between those FA and IMF content (P > 0.1), low overall concentration and many double bonds, which would reduce C–H bonds detectable in the near infrared region, could also have negatively influenced the NIR predictions.
Comparisons between studies are complicated because of the use of different NIR equipment, measurement modes, wavelength ranges, sample preparation and FA chemical analysis. As stated beforehand, this study together with that performed by Sierra et al. (Reference Sierra, Aldai, Castro, Osoro, Coto-Montes and Oliván2008) in beef are the only ones using reference data expressed as concentration of FA in lean muscle tissue, whereas previous studies expressed the data FA as a proportion of the total fat. Nevertheless, González-Martín et al. (Reference González-Martín, González-Pérez, Hernández-Méndez, Alvarez-García and Merino Lázaro2002) found similar results for palmitic and oleic acids in subcutaneous fat of swine to those reported in this study. However, Windham and Morrison (Reference Windham and Morrison1998), González-Martín et al. (Reference González-Martín, González-Pérez, Hernández-Méndez and Álvarez-García2003), Pla et al. (Reference Pla, Hernández, Ariño, Ramírez and Díaz2007) and Sierra et al. (Reference Sierra, Aldai, Castro, Osoro, Coto-Montes and Oliván2008) showed better predictions when they predicted the FA content in beef, swine subcutaneous fat and rabbit meat. This lack of agreement within studies could be due to the fact that Pla et al. (Reference Pla, Hernández, Ariño, Ramírez and Díaz2007) and Sierra et al. (Reference Sierra, Aldai, Castro, Osoro, Coto-Montes and Oliván2008) used rabbit meat samples from different genetic origins, fed different diets and produced in conventional or organic systems and beef meat samples of very different breeds to perform NIR calibrations, in order to ensure a reasonable variation of FA in samples that represent the different sources of variation expected during analysis. Likewise, Windham and Morrison (Reference Windham and Morrison1998) used beef neck lean samples collected from seven different meat processing establishments. In addition, it should be noted that in our study samples of muscle were directly scanned (without previous fat extraction) in order to assess the online implementation of NIR spectroscopy, whereas González-Martín et al. (Reference González-Martín, González-Pérez, Hernández-Méndez and Álvarez-García2003) scanned subcutaneous fat of swine, which is expected to provide more spectral information with regard to FA content. For stearic acid, our results agree with those reported by Windham and Morrison (Reference Windham and Morrison1998), González-Martín et al. (Reference González-Martín, González-Pérez, Hernández-Méndez and Álvarez-García2003) and Sierra et al. (Reference Sierra, Aldai, Castro, Osoro, Coto-Montes and Oliván2008) and are better than those obtained by González-Martín et al. (Reference González-Martín, González-Pérez, Hernández-Méndez, Alvarez-García and Merino Lázaro2002 and Reference González-Martín, González-Pérez, Alvarez-García and Gónzalez-Cabrera2005) and Pla et al. (Reference Pla, Hernández, Ariño, Ramírez and Díaz2007). The icosaenoic acid was estimated in our study with much more accuracy than in the study carried out by González-Martín et al. (2009, Reference González-Martín, González-Pérez, Hernández-Méndez and Álvarez-García2003 and Reference González-Martín, González-Pérez, Alvarez-García and Gónzalez-Cabrera2005) and Pla et al. (Reference Pla, Hernández, Ariño, Ramírez and Díaz2007). With regard to CLA, only a few authors have predicted its content by NIR spectroscopy, despite its increasing importance for human health. In this study, CLA was more accurately predicted than in the study carried out by Sierra et al. (Reference Sierra, Aldai, Castro, Osoro, Coto-Montes and Oliván2008) (R 2 = 0.71 v. 0.59, RPD = 1.8 v. 1.6).
When FAs were grouped (Table 3), the calibration equation for SFA and MUFA for LIM× beef samples showed accurate predictions (R 2 = 0.68 and 0.75, SECV = 235 and 240 mg/100 g muscle, RPD = 1.7 and 1.9, respectively), whereas the NIR predictability for PUFA content was less reliable (R 2 = 0.6, SECV = 17 mg/100 g muscle, RPD = 1.5), probably due to a less variability in sample population (CV = 15%, Table 1) and much lower concentrations (about 7% of total fat). In addition, the higher double bonds in PUFA result in less C–H bonds to be detectable in the near infrared region, which may be another reason for their lower accuracy of prediction by NIR spectroscopy. Nevertheless, the coefficient of determination was still relatively high, so that the correspondent calibration equation for PUFA content could be used as an approximate prediction. In general, most researchers have described accurate NIR calibrations to estimate SFA and MUFA content in meat (Windham and Morrison, Reference Windham and Morrison1998; González-Martín et al., Reference González-Martín, González-Pérez, Hernández-Méndez, Alvarez-García and Merino Lázaro2002 and Reference González-Martín, González-Pérez, Hernández-Méndez and Álvarez-García2003; Realini et al., Reference Realini, Duckett and Windham2004; Pla et al., Reference Pla, Hernández, Ariño, Ramírez and Díaz2007; Sierra et al., Reference Sierra, Aldai, Castro, Osoro, Coto-Montes and Oliván2008). For PUFA content, González-Martín et al. (Reference González-Martín, González-Pérez, Hernández-Méndez and Álvarez-García2003) and Pla et al. (Reference Pla, Hernández, Ariño, Ramírez and Díaz2007) reported better predictions than those obtained in this study; however, our results are in accordance with those reported by González-Martín et al. (Reference González-Martín, González-Pérez, Hernández-Méndez, Alvarez-García and Merino Lázaro2002 and Reference González-Martín, González-Pérez, Alvarez-García and Gónzalez-Cabrera2005) and are better than those reported by Sierra et al. (Reference Sierra, Aldai, Castro, Osoro, Coto-Montes and Oliván2008) (R 2 = 0.25, RPD = 1.1). Regarding n-6 and n-3 FA prediction, the ability of NIR spectroscopy was low (R 2 = 0.45 and 0.12, SECV = 21 and 9.0 mg/100 g muscle, RPD = 1.1 and 1.0, respectively). In contrast, Pla et al. (Reference Pla, Hernández, Ariño, Ramírez and Díaz2007) predicted accurately n-6 FA in rabbit meat samples (R 2 = 0.91, RPD = 3.3), probably as consequence of a higher range of n-6 FA content in this kind of meat. In our study, the correlation between n-3 FA and IMF content was not statistically significant (P > 0.1), which could have reduced the NIR predictability. As far as IMF content is concerned, NIR predictability was high (R 2 = 0.75, SECV = 477 mg/100 g muscle, RPD = 1.9), which is in agreement with that showed throughout the literature (Cozzolino and Murray, Reference Cozzolino and Murray2002; Alomar et al., Reference Alomar, Gallo, Castañeda and Fuchslocher2003; Prieto et al., Reference Prieto, Andrés, Giráldez, Mantecón and Lavín2006; Andrés et al., Reference Andrés, Murray, Navajas, Fisher, Lambe and Bünger2007).
Comparing the accuracy of the reference measurements with those obtained in the NIR calibrations for those FA showing moderate to high predictability in LIM× beef samples, it could be observed that the SECV was lower than twice the value of the standard error of laboratory (SEL) for C16:0, C16:1, C18:0, trans11 C18:1, C18:1, C18:2 n-6, C20:1, cis9, trans11 C18:2, SFA, MUFA, PUFA and IMF content (SEL: 97, 16, 46, 5.1,117, 7, 0.7, 1.8, 148, 143, 9 and 301 mg/100 g muscle, respectively). Thus, the obtained level of error was less than the specification limits allowed by the industry in order to implement online the NIRS technology to predict the FA profile (SECV < 2 SEL, Windham et al., Reference Windham, Mertens and Barton1989).
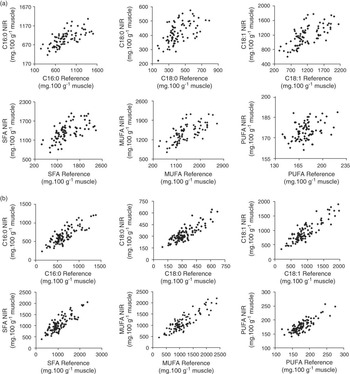
Figure 2 plots the relation between the values obtained at the laboratory for the most abundant FA and those predicted by NIR spectroscopy for both AA× and LIM× beef loin samples. As shown, the relationship was better for the LIM× than for the AA× beef samples, in spite of the mean content of IMF and FA was higher in the latter breed. The different adipocyte size between both breeds could be one reason. Mendizabal et al. (Reference Mendizabal, Albertí, Eguinoa, Arana, Soret and Purroy1999) and Alzón et al. (Reference Alzón, Mendizabal, Arana, Albertí and Purroy2007) found the leaner animal had smaller adipocytes. AA× samples showed more IMF content than LIM×, so that the adipocyte size in AA× is expected to be higher than in LIM×. Hence, the spatial arrangements of deposits of IMF in meat can be different between breeds, of which AA× samples most likely showed bigger individual clusters. This would mean that any NIR signal taken at one cross section may collect information about IMF at that point, but that section may not be as representative (spatially) of the IMF distribution through the loin in AA× as in LIM×. However, the adipocyte size of IMF in the samples used was not measured, so further studies are required in order to validate this hypothesis.
Relation between the values obtained at the laboratory for the most abundant fatty acids and those predicted by NIR spectroscopy in (a) Aberdeen Angus (AA×) and (b) Limousin (LIM×) crossbred beef loin samples (without outliers).

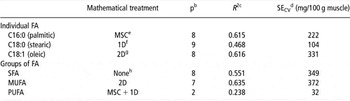
In order to use NIR spectroscopy online in the abattoir, one prediction equation over all breeds (AA× and LIM×) is likely to be necessary. In a preliminary analysis, in which both AA× and LIM× samples of this study were combined, Prieto et al. (Reference Prieto, Ross, Navajas, Nute, Richardson, Hyslop, Simm and Roehe2009c) obtained NIR predictabilities more accurate than those found in this study for AA× but less than those for LIM× (R 2 (SECV, mg/100 g muscle) for C16:0, C18:0, C18:1, SFA, MUFA and PUFA of 0.615 (222), 0.468 (104), 0.616 (331), 0.551 (349), 0.635 (372) and 0.238 (32), respectively; Table 4). Therefore, the combination of breeds resulted for the present data in a more pooled predictability.
Prediction of FA profile in Aberdeen Angus and Limousin crossbred beef samples using NIR spectra (n = 194)Footnote a (Prieto et al., Reference Prieto, Ross, Navajas, Nute, Richardson, Hyslop, Simm and Roehe2009c)

FA = fatty acids; SFA = saturated fatty acids; MUFA = monounsaturated fatty acids; PUFA = polyunsaturated fatty acids.
a Number of samples after eliminating outliers.
b Number of partial least square terms utilized in the calibration equation.
c Coefficient of determination of calibration.
d Standard error of cross-validation.
e Multiplicative scatter correction.
f First-order derivative.
g Second-order derivative.
h Raw absorbance data (Log (1/R)).
Conclusion
The results of this research show that NIR spectroscopy has the potential to be used online in the abattoir as an early predictor for the total fat content and the main individual and groups of FA in LIM× meat samples. The accuracies of prediction of FA were lower in AA× than in LIM× beef samples. These differences between breeds were obtained on animals, which were mostly from a single experimental farm and finished on a similar dietary regime. Therefore, differences between breeds in accuracy of estimation of FA by NIR are expected to be mostly due to genetic differences of these breeds. One reason could be the differences in the adipocyte size between breeds which might have influenced the NIR spectra collection. This suggests the use of specific prediction equations for each of the breeds. Nevertheless, further research is required in order to validate the obtained models and results on the same and different breeds. Overall, the results indicate that the NIR technique has the potential to predict accurately FA profile under abattoir conditions, which can be used to determine meat quality in a value-based marketing system and in breeding programmes to genetically improve FA profiles of meat.
Acknowledgements
We are grateful to the Scottish Government for funding the research and Scotbeef, QMS, BCF and Signet for their substantial support. In addition, we thank SAC colleagues Kirsty McLean, Laura Nicoll, Claire Anderson, Mhairi Jack, Ann McLaren, Ruth Turl, Elizabeth Goodenough, John Gordon, Lesley Deans, Alex Moir and Cameron Craigie for their help in the experimental work and Bristol colleagues Kathy Hallett, Fran Taylor and Fran Whittington for the fatty acid analysis. N. Prieto is grateful to the Ministry of Science and Innovation (MICINN), Spain, for financial assistance via a post-doctoral grant.