Implications
Glucose is the primary precursor for lactose synthesis, and the supply of glucose to the mammary gland plays an important role in milk production. In this study, we show that high concentrations of glucose stimulate the glucose uptake by bovine mammary epithelial cells. The activity of hexokinases (HKs), especially HK2, rather than gene expression of glucose transporters may play a more important regulatory role in this process. This suggests that stimulation of HK activity in the mammary gland may be a useful way to enhance the efficiency of glucose transport and utilization in dairy cows.
Introduction
Large amounts of glucose are required to sustain lactation, and glucose requirements increase approximately twofold in late pregnant ewes and fourfold in lactating dairy cows compared with their non-lactating counterparts (Bell and Bauman, Reference Bell and Bauman1997). Up to 85% of the circulating glucose is consumed by the lactating mammary gland (Biskerst et al., Reference Biskerst, Annison and Linzell1974). Thus, providing sufficient glucose to the mammary gland is a metabolic priority in lactating animals. In some studies, glucose has been infused into the duodenum of dairy cattle to determine the possible role of increased glucose availability in milk synthesis (Hurtaud et al., Reference Hurtaud, Lemosquet and Rulquin2000; Rigout et al., Reference Rigout, Lemosquet, van Eys, Blum and Rulquin2002), and found that increased glucose concentrations did affect the milk compositions. However, it is not clear whether increased glucose availability affects glucose uptake in the mammary epithelial cells.
Glucose is transported into the mammary epithelial cells via facilitative glucose transporters (GLUTs), with GLUT1 being the major transporter and GLUT8 being another important type of transporter in the bovine mammary gland (Zhao et al., Reference Zhao, Dixon and Kennelly1996 and Reference Zhao, Miller, Wall, Zheng, Dong, Neville and McFadden2004). The absorbed glucose is then phosphorylated by hexokinases (HKs) in the cytoplasm to form glucose-6-phosphate for metabolic utilization, the first step of glucose metabolism. HKs may play greater roles in glucose metabolism than in glucose transport in the mammary gland of goats (Nielsen et al., Reference Nielsen, Madsen and Hedeboe2001) and bovine (Xiao and Cant, Reference Xiao and Cant2005). The HKs have four isozymes, HK1 to HK4. Each of the HKs has tissue-specific patterns of expression and differs in catalytic and regulatory properties (Wilson, Reference Wilson2003). Both HK1 and HK2 are reported to be expressed in lactating rat mammary gland (Kaselonis et al., Reference Kaselonis, McCabe and Gray1999); however, the expression profile of HKs in lactating bovine mammary gland is still unclear.
Although it is known that GLUTs and HKs are involved in the control of glucose transport rate, there are open questions with respect to the relationship between GLUTs and HKs in the regulation of glucose transport and utilization by glucose availability in the bovine mammary gland. The aims of this study were to investigate the effects of glucose availability on glucose transport in the primary bovine mammary epithelial cells (BMEC), and to determine the roles of GLUTs and HKs in these effects.
Material and methods
Cell culture and treatment
The primary BMEC within passage 8 were cultured as described previously (Zhao et al., Reference Zhao, Liu, Zhou and Liu2010), and seeded at density of 5 × 10⁴ cells/ml in a six-well culture plate. When the cells were cultured to about 80% confluence, the culture media were changed to Dulbecco's modified Eagle's medium without glucose (Gibco, Grand Island, NY, USA), with supplement of d-glucose (Sigma, St Louis, MO, USA) to the concentrations of 2.5, 5, 10 and 20 mM. After incubation for 12 h, cells were harvested to isolate RNA and the RNA was stored at −80°C until subsequent analysis, whereas the glucose content in the culture media and HKs activity of the cells were analyzed immediately. Using the same procedures, different concentrations of 3-bromopyruvate (3-BrPA; 30, 50 or 70 μM), a specific inhibitor of HK2, were added to the media containing 2.5 or 10 mM glucose, respectively.
The experiment was performed three times on different days, and at least four wells per treatment. In each experiment, the cells were taken from three cows and pooled.
Glucose uptake and cell proliferation
Glucose levels in the culture media were determined using an enzymatic coloring glucose oxidase/peroxidase assay kit (Jiancheng, Nanjing, China). The amount of absorbed glucose, determined on the basis of the difference before and after incubation (Accorsi et al., Reference Accorsi, Gamberoni, Isani, Govoni, Viggiani, Monari, De Ambrogi, Munno, Tamanini and Seren2005), was expressed as μg of glucose per μg of protein. The total protein of the cells was determined using the Bradford method (Bradford, Reference Bradford1976), and the cell proliferation was determined using an MTT (3-(4, 5-dimethylthiazol-2-yl)-2, 5-diphenyltetrazolium bromide, Sigma, St Louis, MD, USA) assay as described previously (Zhao et al., Reference Zhao, Liu, Zhou and Liu2010).
mRNA abundance
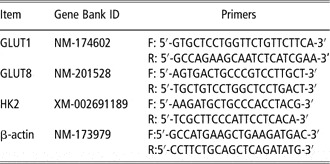
Total RNA was isolated using the Trizol Reagent (Invitrogen, Carlsbad, CA, USA), and the first strand of cDNA was transcribed using a reverse transcription kit (Takara, Tokyo, Japan). The mRNA abundance was determined by real-time quantitative PCR using the SYBR Green method (7500, Applied Biosystems, Singapore), and the primers used are listed in Table 1. The PCR was started with a 10 s pre-denaturalization at 94°C, followed by 40 cycles of 5 s denaturation at 95°C and 34 s annealing and extension at 60°C. Gene expression values were normalized to reference gene of β-actin in the same sample. The relative changes in each gene expression were calculated using the 2−ΔΔCT (cycle threshold, CT) method (Livak and Schmittgen, Reference Livak and Schmittgen2001), with 2.5 mM glucose as the control group.
Primers for real-time PCR

GLUT = glucose transporter; HK = hexokinase.
HK activity
The HK activity was measured using a total HK assay kit (Genmed, Arlington, MA, USA). Briefly, the cells were lysed and cleared by centrifugation (1600 × g, 5 min), and 20 μl of the lysate was loaded into 180 μl of the reaction buffer on ice, then the absorbance was immediately detected using a spectrophotometer (Spectramax M5, Molecular Devices, Sunnyvale, CA, USA) at 340 nm. The optical density value at 5 min minus that at 0 min was used to calculate the total activity of HKs, and the activity was presented as nmol NADPH produced per mg protein per min.
Statistical analysis
Data were analyzed by ANOVA, and Duncan's multiple range tests were used for multiple comparisons using the SPSS 16.0 software. P < 0.05 was considered as a significant difference, and each experiment was performed three times.
Results
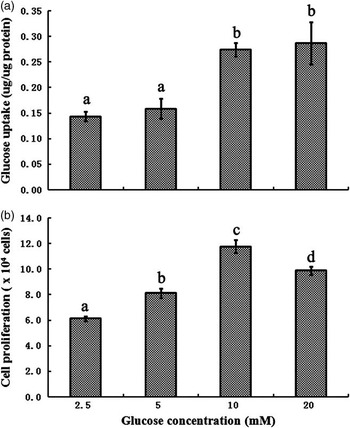
A dose-dependent profile of glucose uptake by the BMEC under different glucose availability is shown in Figure 1a. Glucose uptake was approximately twofold greater in the BMEC incubated with 10 and 20 mM glucose than with 2.5 mM (P < 0.05), with no difference between 10 and 20 mM glucose (P > 0.05). The viability of BMEC increased first and then decreased with the increasing glucose availability (Figure 1b), with the highest value at 10 mM (P < 0.05), followed by at 20 mM and then at 5 mM (P < 0.05).
Glucose uptake (a) and cell proliferation (b) by bovine mammary epithelial cells under different glucose concentrations. The cell proliferation in 2.5 mM glucose is assigned a value of 100%, and the other values are expressed in relative units. Values with different superscripts (a, b, c and d) are significantly different (P < 0.05), and bars indicate the standard error (a, n = 6; b, n = 10).

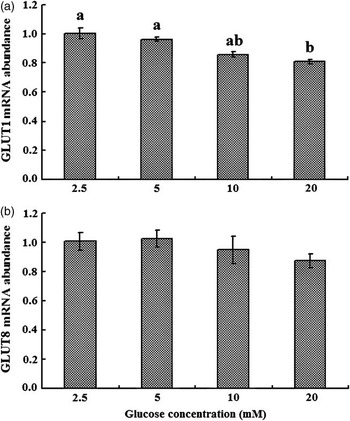
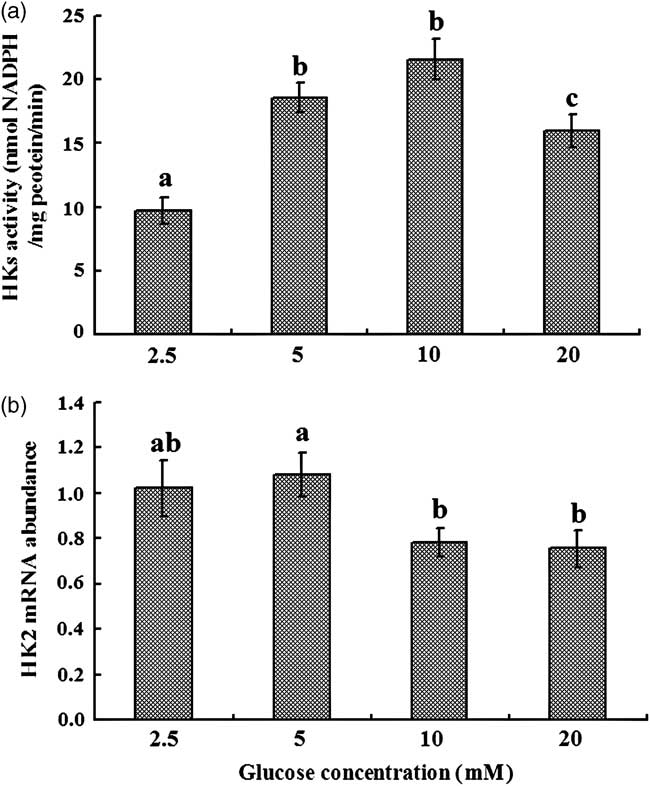
The GLUTs and HKs were investigated to determine the possible mechanisms involved in the regulation of glucose uptake by glucose availability in the BMEC. Compared with the control (2.5 mM), 5 and 10 mM glucose did not affect the GLUT1 gene expression (P > 0.05, Figure 2a); however, 20 mM glucose decreased the mRNA abundance of GLUT1 (P < 0.05, Figure 2a). The abundance of GLUT8 mRNA was not affected by any concentrations of glucose (P > 0.05, Figure 2b). The HK activity increased initially and then decreased with increasing concentrations of glucose, with the highest activity at 10 mM glucose (P < 0.05, Figure 3a). The mRNA of HK1 could not be detected, whereas that of HK2 was expressed at a relatively high level in the BMEC (data not shown). Compared with the control, the increasing glucose availability (5, 10 and 20 mM) did not elevate mRNA abundance of HK2 (P > 0.05); however, the HK2 mRNA abundance was lower in 10 or 20 mM than that in the control and 5 mM (P < 0.05; Figure 3b).
The abundance of glucose transporter-1 (GLUT1; a) and GLUT8 (b) mRNA in the bovine mammary epithelial cells under different glucose concentrations. The abundance of GLUT1 and GLUT8 mRNA in 2.5 mM glucose is assigned a value of 1.0, and the other values are expressed in relative units. Values with different superscripts (a, b) are significantly different (P < 0.05), and bars indicate the standard error (n = 4).

Hexokinases (HKs) activity (a) and HK2 mRNA abundance (b) in bovine mammary epithelial cells under different glucose concentrations. The abundance of HK2 mRNA in 2.5 mM glucose is assigned a value of 1.0, and the other values are expressed in relative units (a). Values with different superscripts (a, b, c) are significantly different (P < 0.05), and bars indicate the standard error (n = 4).
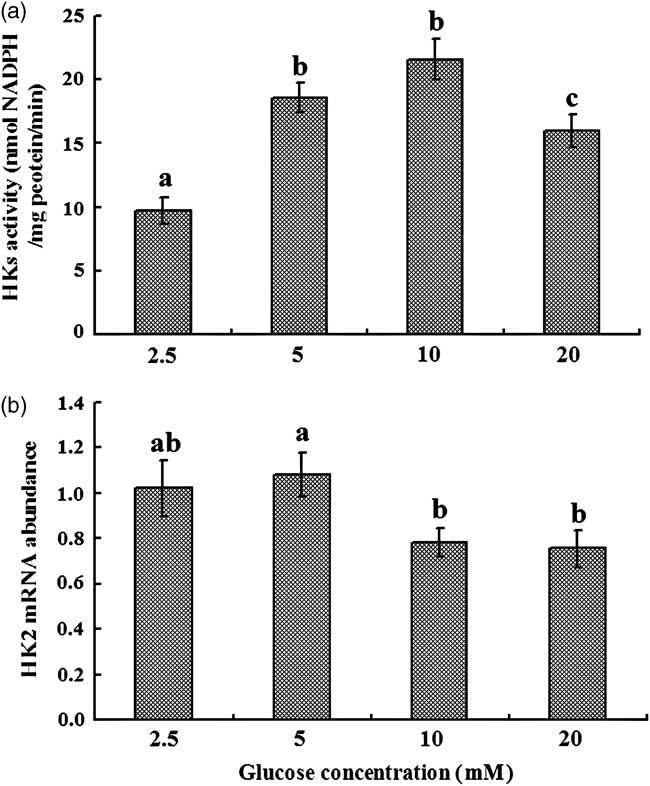
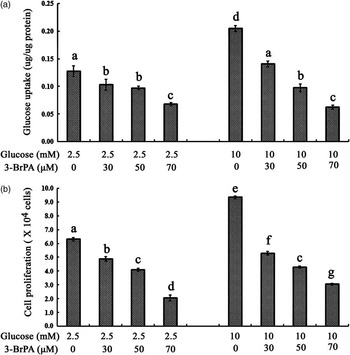
Figure 4 shows the results of glucose uptake and cell proliferation when the HK2 activity was inhibited. The glucose uptake at 2.5 and 10 mM glucose was decreased with increasing concentrations of 3-BrPA (0, 30, 50 or 70 μM; P < 0.05; Figure 4a). The glucose uptake was higher at 10 mM glucose than that at 2.5 mM glucose with either 0, 30 or 50 μM 3-BrPA (P < 0.05; Figure 4a), whereas there was no difference between 2.5 and 10 mM glucose with 70 μM 3-BrPA (P > 0.05; Figure 4a). The cell proliferation at 2.5 and 10 mM glucose showed the same pattern with glucose uptake when treated with different concentrations of 3-BrPA (0, 30, 50 or 70 μM). The cell proliferation was higher at 10 mM glucose than that at 2.5 mM glucose with either 0, 30 or 70 μM 3-BrPA (P < 0.05; Figure 4b), whereas there was no difference between 2.5 and 10 mM glucose with 50 μM 3-BrPA (P > 0.05; Figure 4b).
Effects of 3-bromopyruvate (3-BrPA) on glucose uptake (a) and cell proliferation (b) by the bovine mammary epithelial cells. Different concentration of 3-BrPA was added into 2.5 or 10 mM glucose, respectively. The cell proliferation at 2.5 mM glucose is assigned a value of 100%, and the other values are expressed in relative units. Values with different superscripts (a, b, c, d, e, f, g) are significantly different (P < 0.05), and bars indicate the standard error (a, n = 6; b, n = 10).

Discussion
Glucose is of central metabolic importance in virtually all organisms, and is pivotal in lactating animals because glucose is the primary precursor of lactose synthesis, and lactose controls the milk volume by maintaining osmolarity of milk (Cant et al., Reference Cant, Trout, Qiao and Purdie2002). The metabolite of glucose can also be used as a substrate for the synthesis of nucleotides, milk proteins and lipids. In this study, increased glucose availability stimulated glucose uptake by the mammary epithelial cells. In the same pattern, high concentrations of glucose enhanced BMEC proliferation. The intermediary metabolites of glucose, such as glucose-6-phosphate and NADPH can act as survival factors (Plas et al., Reference Plas, Rathmell and Thompson2002; Nutt et al., Reference Nutt, Margolis, Jensen, Herman, Dunphy, Rathmell and Kornbluth2005), and cell growth is dependent on energy supply (Buchakjian and Kornbluth, Reference Buchakjian and Kornbluth2010; Mulukutla et al., Reference Mulukutla, Khan, Lange and Hu2010). It is indicated, from our results, that glucose availability did affect the glucose transport and utilization by the BMEC, which is not consistent with the report that glucose uptake is unaffected by glucose infusion in ruminants. These controversial results may be attributed to a reduction or a marked inhibition of gluconeogenesis during glucose infusion on sheep (Judson and Leng, Reference Judson and Leng1973), or may be different with diets providing post-ruminal supply of starch on dairy cattle (Hurtaud et al., Reference Hurtaud, Lemosquet and Rulquin2000; Rigout et al., Reference Rigout, Lemosquet, van Eys, Blum and Rulquin2002). In addition, the blood glucose concentration is tightly regulated, and duodenal glucose infusion results only in minor changes in glucose concentration compared with the range of concentration in the media.
Both GLUT1 and GLUT8 are important GLUTs in the bovine mammary gland (Zhao et al., Reference Zhao, Dixon and Kennelly1996 and Reference Zhao, Miller, Wall, Zheng, Dong, Neville and McFadden2004). As the downregulation of GLUT1 may lead to the reduction of glucose availability for lactose synthesis (Ben Chedly et al., Reference Ben Chedly, Lacasse, Marnet, Komara, Marion and Boutinaud2011), and as the expression of GLUT1 mRNA was elevated in response to high glucose availability in chicken and rat thymocytes (Aulwurm and Brand, Reference Aulwurm and Brand2000; Humphrey and Rudrappa, Reference Humphrey and Rudrappa2008), it was assumed that high concentration of glucose may stimulate glucose uptake accompanied with the increase of GLUT1 and/or GLUT8 mRNA level in the BMEC. However, in this study, compared with the control (2.5 mM), 5 or 10 mM glucose did not affect the expression of GLUT1 mRNA, and abundance of GLUT8 mRNA was not affected by various concentrations of glucose. This may be attributed to the special features of glucose supply and metabolism by ruminants (Reynolds, Reference Reynolds1992), and the specific mechanisms are yet to be studied. The GLUT1 mRNA was lower in 20 mM glucose compared with 2.5 and 5 mM glucose, which was consistent with the report that GLUT expression was inhibited by high glucose concentrations in other cells (Ohta et al., Reference Ohta, Isselbacher and Rhoads1990; El-Kebbi et al., Reference El-Kebbi, Roser, Pollet, Cushman and Wilson1994). However, glucose uptake was higher in 20 mM of glucose compared with 2.5 and 5 mM glucose. As the mRNA levels do not always correlate with protein expression, glucose availability may partly regulate GLUT expression at the post-transcriptional level. The expression profile of GLUT1 and GLUT8 protein under different glucose availability needs further research. Except for GLUT amounts, the increased glucose concentration gradient across the cell membrane may partly account for the elevated glucose uptake in 10 and 20 mM glucose, as glucose transport across the plasma membrane of the lactating BMEC has a Km value of 8.29 mM for 3-O-methyl-d-glucose (Xiao and Cant, Reference Xiao and Cant2003), and the purified GLUT1 exhibits a Km of 5 to 7 mM for glucose (Mueckler et al., Reference Mueckler, Hresko and Sato1997).
The HKs, the key enzymes for glucose metabolism, may play an important role in glucose transport under different glucose availability. To determine the hypothesis, the HK activity was investigated. It was observed that BMEC grown in higher glucose concentrations (5, 10 and 20 mM) had higher HK activities, which confirmed the previous assumption and agreed with Yamada et al. (Reference Yamada, Brink, Bisse, Epting and Engelhardt2005), who reported that HK activities showed positive relationship with glucose uptake. As both HK1 and HK2 were expressed in lactating rat mammary gland (Kaselonis et al., Reference Kaselonis, McCabe and Gray1999), and it is interesting to define the specific role each HK played in the BMEC, the expression of HK1 mRNA could not be detected, whereas the HK2 was expressed at a relatively high level in the BMEC. As HK2 is involved in the process of anabolism (Sebastian et al., Reference Sebastian, Horton and Wilson2000; Southworth et al., Reference Southworth, Davey, Warley and Garlick2007), the above results suggest that HK2 may play an important role in milk synthesis in the lactating bovine mammary gland. The expression of HK2 is closely associated with glucose transport (Ong et al., Reference Ong, Jin, Song, Yu, Zhang and Chow2008; Chehtane and Khaled, Reference Chehtane and Khaled2010), and over-expression of HK2 usually induced increase of glucose uptake (Fueger et al., Reference Fueger, Bracy, Malabanan, Pencek, Granner and Wasserman2004). Therefore, it is possible that HK2 plays an important role in the regulation of glucose uptake by the BMEC.
Increasing glucose availability did not elevate the expression of HK2 mRNA, suggesting that glucose availability may not regulate HK2 at the transcriptional level in the lactating BMEC. The 3-BrPA is an inhibitor to HK2 (Kim et al., Reference Chen, Xu, Achanta, Zhang and Huang2006). Addition of 3-BrPA resulted in a preferential covalent modification of HK2 protein in a concentration- and time-dependent manner (Chen et al., Reference Chen, Xu, Achanta, Zhang and Huang2006). In 2.5 or 10 mM glucose, addition of 3-BrPA decreased the glucose uptake in a dose-dependent manner, whereas the increased glucose uptake at 10 mM glucose was nearly abolished by adding 30 μM of 3-BrPA. In addition, when 125 μM 3-BrPA was added, the glucose uptake by the BMEC was totally blocked at 2.5 or 10 mM glucose (data not shown). The results support the previous assumption that HK2 may play an important role in glucose uptake in the BMEC. The relationship between the inhibition of HK2 and depression of glucose uptake is complex. In this study, the cell proliferation induced by high glucose availability was decreased with increasing concentrations of 3-BrPA. Besides, inhibition of HK2 may activate mitochondrial apoptotic signal cascades and induce apoptotic cell death (Pastorino et al., Reference Pastorino, Shulga and Hoek2002; Pastorino and Hoek, Reference Pastorino and Hoek2003). The depressed growth of cells may partly account for the depression of glucose uptake, because glucose is required for cell growth (Greiner et al., Reference Greiner, Guppy and Brand1994; Mulukutla et al., Reference Mulukutla, Khan, Lange and Hu2010). However, the specific glucose-sensing mechanism and pathways in the BMEC are yet to be elucidated in detail. It is reported that eukaryotic cells take signals from the glycolytic and the pentose phosphate pathway metabolites to sense glucose availability through the action of protein kinase and transcription factors, such as stimulatory protein-1 (Vaulont et al., Reference Vaulont, Vasseur-Cognet and Kahn2000; Towle, Reference Towle2005).
In summary, increased glucose availability stimulated glucose transport by the BMEC, and this effect may act through a mechanism other than regulating GLUT and HK2 mRNA levels. Inhibition of HK2 depressed the glucose uptake and cell proliferation stimulated by high glucose availability, suggesting that HK2 may play an important role in the regulation of glucose uptake by glucose availability in the BMEC. The regulation of gene expression and post-transcriptional modification of HKs may be required to enhance glucose transport and utilization by the bovine mammary gland.
Acknowledgments
This study was supported by a grant from the National Natural Science Foundation of China (No. 30901034), the earmarked fund for Modern Agro-industry Technology Research System (CARS-37) and by the International Foundation for Science (IFS, B/4444-1). The authors gratefully acknowledge Dr Fengqi Zhao, University of Vermont, USA, for his help with the English language.