INTRODUCTION
In China, as in many other parts of Asia, rice and wheat are grown frequently in rotation. Rice–wheat (RW) systems occupy 0·10 of the arable area in China, mainly along the Yangtze River (Huke & Huke Reference Huke and Huke1992). These systems are of major importance for ensuring China's food security. The population of China is expected to increase by nearly half a billion people by 2030 (FAO 2003), requiring large additional quantities of rice and wheat. Since suitable agricultural land is scarce in China, RW systems are managed very intensively, i.e. with high inputs to maximize yields per unit of land. Extremely high annual doses of 500–650 kg N/ha are common in RW systems (Zhu et al. Reference Zhu, Han, Liu, Zhang and Shao2000), with low nitrogen use efficiency (NUE) (Xu & Wu Reference Xu and Wu1999; Cui et al. Reference Cui, Cheng, Han and Li2000; Peng et al. Reference Peng, Huang, Zhong, Yang, Wang and Zou2002), particularly in southern Jiangsu Province. Applying N beyond crop needs results in undesirable emissions to the environment, such as gaseous and leaching losses and runoff to surface water, and in unnecessary production costs for farmers (Li & Zhang Reference Li and Zhang1999; Xing & Zhu Reference Xing and Zhu2000).
Commonly, the rice crop in RW systems is grown by keeping a permanent layer of water on the field, resulting in higher seepage and percolation losses than in the wheat crop. Competing claims for fresh water sources call for more efficient use of irrigation water in rice production (Bouman & Tuong Reference Bouman and Tuong2001; Bouman et al. Reference Bouman, Humphreys, Tuong and Barker2006). To reduce water use in irrigated rice, water-saving techniques are being developed. These include the introduction of periods with saturated, but non-flooded, soil conditions during part of the growing period, also known as intermittent irrigation (II) (Mao Reference Mao1993), direct seeding of rice under non-flooded conditions (Xie et al. Reference Xie, Cheng and Feng1995) and the introduction of ground cover, reducing evaporation losses (Lin et al. Reference Lin, Dittert, Tao, Kreye, Xu, Shen, Fan, Sattelmacher, Bouman, Hengsdijk, Hardy, Bindraban, Tuong and Ladha2002). II can reduce water input without affecting yields (Belder et al. Reference Belder, Bouman, Cabangon, Lu, Quilang, Li, Spiertz and Tuong2004, Reference Belder, Spiertz, Bouman, Lu and Tuong2005). Water-saving techniques in rice may also improve soil physical and biological properties for the associated wheat crop (Timsina & Connor Reference Timsina, Singh, Badaruddin, Meisner and Amin2001), resulting in increased NUEs in the wheat (Zheng Reference Zheng, Hobbs and Gupta2000).
There has been considerable research on N dynamics in rice and wheat separately, but few studies have described those dynamics in RW systems (Timsina et al. Reference Timsina and Connor2001). Information on N dynamics in RW systems in relation to II is especially scarce, which constrains the development of RW systems with improved water and NUEs. The present study examines N response and NUE in a RW system based on a 2-year field experiment with two seasons of rice and wheat, different nitrogen regimes and different water management in the rice crop, including conventional flooding and II.
MATERIALS AND METHODS
Experimental design
The experiments were carried out at the Jiangpu experimental station of Nanjing Agricultural University at Nanjing (32°04′N, 118°48′E) from 2002 to 2004, covering two sequences of rice and wheat crops. The soil is a clayey loam (Anthrosol; FAO 2006) with pH 7·1, soil organic matter content 16·3 g/kg, total N content 1·6 g/kg, available phosphorus 23·9 mg/kg and available potassium 95·7 mg/kg in the 0–400 mm soil layer. The japonica rice cultivar Wuxiangjing9 and wheat cultivar Yangmai10 were grown.
Management and treatments in the rice season
The experiment was a two-factor split plot design with three replicates. The main factor, water management, consisted of two treatments, i.e. conventional irrigation (CI) and II. The sub-factor nitrogen management consisted of five application rates, i.e. 0, 75, 150, 225 and 300 kg N/ha. Plot size was 10×3 m2. Plots were separated by plastic film to 300 mm below soil surface to reduce water and nitrogen flows between adjacent plots. In 2002, rice was sown on 11 May and transplanted as six-leaf seedlings on 15 June at one seedling per hill, spaced at 250 and 150 mm between and within the rows, respectively. Because of differences in maturity, the 0 kg N/ha plots were harvested on 5 October, the remaining II-plots on 15 October and the remaining CI-plots on 21 October. After transplanting, the CI treatment was flooded with a water layer of 20–50 mm, except during mid-season drainage for 2 days, starting on 31 July, and for 5 days, starting on 25 August. Relative soil water content (defined as soil water content divided by field capacity) in II was maintained throughout the growth period between c. 0·85 (when the soil started to form cracks) and saturation, through drainage or irrigation. Before transplanting, 0·60 of the total nitrogen was applied as basal fertilizer, another 0·20 at 15 days after jointing, and the remaining 0·20 at 25 days after jointing (5–10 days before heading). In addition to nitrogen, 135 kg P2O5 and 210 kg K2O/ha were applied as basal fertilizer.
In 2003, rice was sown on 15 May and transplanted on 15 June in a 300×150 mm pattern. All plots were harvested on 23 October. Crop management was identical to that in 2002.
Management and treatments in the wheat season
In 2002, after the rice harvest, the land was ploughed and seed was drilled on 9 November at 180 grains/m2. Each rice plot was sub-divided into three to apply three N rates to wheat, i.e. 0, 150 and 300 kg N/ha. Before sowing, 0·60 of the N was applied, and the remainder was top-dressed at the jointing stage. In addition, 135 kg P2O5 and 210 kg K2O/ha were applied as basal fertilizer. Wheat was harvested on 3 June.
In 2003, an alternative layout was selected, based on the results of the previous year: the rice plots of each N treatment were split into two, with half receiving the same N-doses as in the rice season, while the other half did not receive any N. Before sowing of the wheat crop, the soil was prepared with a rotating plough and 0·60 of the fertilizer was applied, the remainder being applied in equal splits at jointing and booting. All plots received 135 kg P2O5 and 210 kg K2O/ha as basal fertilizer. Wheat was sown on 6 November at a density of 150 grains/m2 and was harvested on 26 May.
Measurements
Dry weight and nitrogen content
During the entire experiment, dates of key growth stages of crops were recorded. Rice and wheat plants were harvested from 1 m2 subplots to determine panicle and spike number, grain number/panicle, grain number/spike and grain weight. The proportion of filled grains was determined from the number of filled grains/panicle. Filled grains were selected in a NaCl solution with a specific gravity of 1·03. Plant samples, separated in grain and straw, were oven-dried at 80°C for 2 days. The yields were measured from the samples and expressed on the basis of 0·86 g dry matter (DM)/g fresh weight moisture content for both crops. Concentrations of N in grain and straw were determined by micro-Kjeldahl (AOAC 1984), following digestion in a H2SO4–H2O2 solution.
Soil nitrogen
Total and nitrate nitrogen in the 0–400 and 400–800 mm soil layers were periodically monitored, both before and after crop growth in the plots of 0, 150 and 300 kg N/ha and under both water management treatments. Nitrate (NO3-N) was extracted from fresh soil samples using an equilibrium extraction with 2·0 N KCl solution and analysed using a flow analyser. Total soil N was determined after air-drying of soil samples, using micro-Kjeldahl, following digestion in a H2SO4–H2O2 solution. Nitrate and total N were expressed in kg/ha using the bulk density of each soil layer.
NUE indicators and analysis
Apparent nitrogen recovery (ANR) is the ratio of the difference in N uptake between the treated and the zero-fertilizer plot to the application rate. Physiological NUE (kg grain DM/kg N) is defined as grain production per unit N uptake by the crop, while agronomic efficiency (AE, in kg grain DM/kg N) is defined as grain production per unit N applied. These characteristics are presented in three-quadrant graphs (De Wit Reference De Wit1953; Van Keulen Reference Van Keulen1982): one quadrant presents grain yield against N application (fertilizer response curve, AE), the second, yield against N uptake (yield–uptake curve, NUE), and the third relates N application to N uptake (application–uptake curve, ANR). Only two out of these three relations are mutually independent, the third relation always follows from the other two.
Weather data
Daily radiation, precipitation, maximum and minimum temperature data were collected from a meteorological station located 1 km from the experiments.
Data analysis
GenStat for Windows, 8th edition (http://www.vsn-intl.com/genstat/) was used for the data analysis, i.e. establishing effects of management and N rates, and their interactions on yield, yield components and soil N. Statistical differences were determined using Wald statistics.
RESULTS
Weather
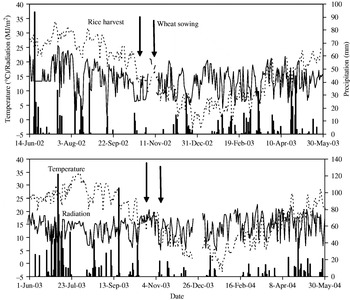
Average daily solar radiation during the first rice-growing season was 14·9 MJ/m2 compared to 13·2 MJ/m2 during the second season (Fig. 1). Rainfall in the second rice season was more frequent and much higher than in the first rice season (1054 v. 421 mm). Average temperature was 25·7°C in the first v. 25·1°C in the second season. Frequency of rainfall in the first wheat season was higher than in the second, although total rainfall was similar (511 v. 435 mm). However, the higher rainfall frequency and the associated cloudiness resulted in lower average daily solar radiation during the first wheat season: 13·0 MJ/m2 compared to 14·4 MJ/m2 during the second season. Consistent with the radiation levels, average temperature during the first wheat season was 10·1 v. 11·4°C in the second season.
Daily mean temperature, radiation and precipitation at Nanjing in two seasons with RW rotations. Solid lines are radiation, dotted lines are temperature and columns are precipitation.

Rice
Grain yield
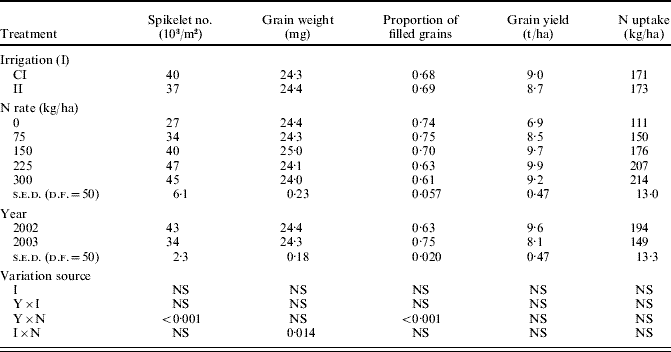
In both seasons, yields increased with N rates except for the highest N rate (Table 1). Neither water management nor the interaction of water and nitrogen had an effect on yields. The lower yield at the highest N rate was associated with the lowest proportion of filled grains. The number of spikelets was 26% higher in the first year than in the second year, and associated with a 20% higher grain yield. There was no interaction between years and treatments, indicating consistent yield responses across years.
Average (two seasons, 2002 and 2003) yield components, grain yield and aboveground N uptake at maturity of rice at different N rates and for two irrigation methods, and their variation source

NS, not significant.
Aboveground N uptake
N uptake was similar for both water management treatments (Table 1), but uptake increased with increasing N rates. Below 150 kg N/ha, total crop N uptake exceeded N fertilizer input, while at the higher rates it was reversed. There was no interaction between N and water management on N uptake. Consistent with the yield difference between both years, crop N uptake in 2002 was clearly higher than in 2003 (194 v. 149 kg N/ha), associated with N uptake in the control (0 kg N/ha) plots, i.e. 130 kg N/ha in 2002 and 91 kg N/ha in 2003. Interactions between years and treatments were not significant, indicating that the variation in N uptake was consistent under different N and water management in both years.
NUE
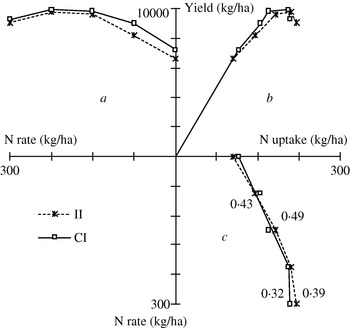
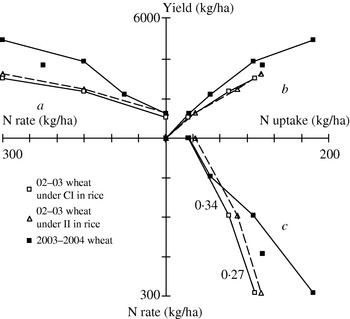
Data on rice yields and N uptake for the 2 years were pooled, as trends were similar. The fertilizer response (AE) curve in quadrant (a) of Fig. 2 shows maximum yields at N doses of 150 kg N/ha. Under CI, AE varied between 18·8 and 4·3 kg grain/kg N applied and under II between 10·4 and 3·5 kg grain/kg N applied.
Relations between N application and yield (quadrant a), N uptake and yield (quadrant b) and N application and N uptake (quadrant c) for the rice seasons in 2002 and 2003 (pooled data from two seasons). The numbers in quadrant c represent mean ANRs (see text for details) under different water management practices, II=intermittent irrigation, CI=conventional flood irrigation (see text for details), below and above 150 kg N/ha.

NUE is the slope of the linear part of the curve relating grain yield and N uptake (Fig. 2, quadrant (b)). In the present experiment, the relation between yield and N uptake started to deviate from the linear at uptake values exceeding 145 (CI) and 169 kg N/ha (II), indicating that at higher N-availability, other growth factors became limiting (Van Keulen Reference Van Keulen1982). Comparison of the CI and II curves shows that in two of the three cases, NUE of II is lower than that of CI, which could hint at some water stress during at least part of the growing season.
Indigenous soil N supply was about 110 kg N/ha and not significantly different between II and CI (Fig. 2, quadrant (c)). At N rates below 225 kg N/ha, average ANR was lower under CI (0·43) than under II (0·49). At 300 kg N/ha, ANR dropped to 0·32 and 0·39 for CI and II, respectively.
When comparing both rice seasons, NUEs were much higher in 2002 than in 2003 (not shown), i.e. the crop produced more grain yield per unit N uptake in 2002, suggesting that factors other than N reduced yield in 2003, such as unfavourable weather conditions.
Wheat
Grain yield
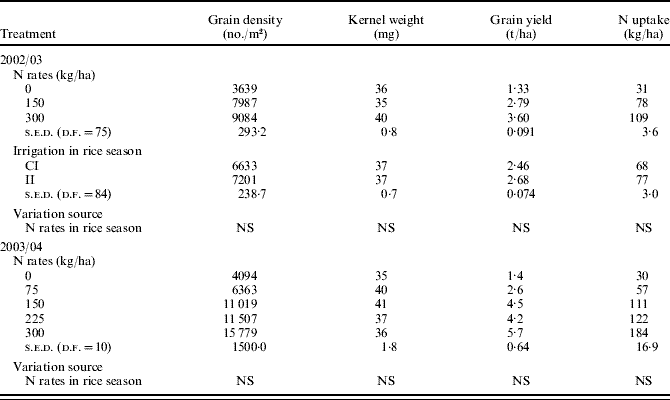
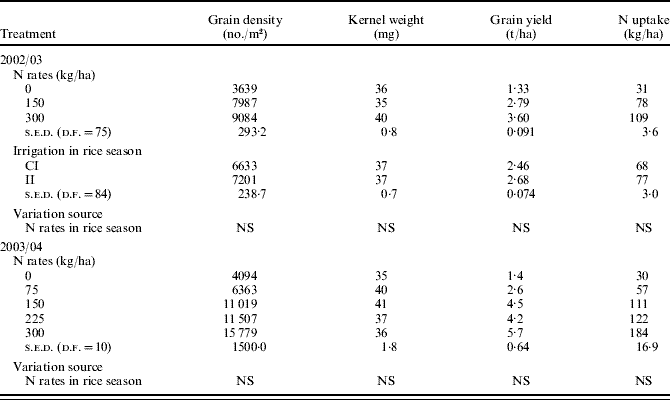
Grain yields ranged from 1·3 to 3·6 t/ha on average for the control (0/0 kg N/ha) and the 300/300 kg N/ha treatment, respectively. Wheat yields in the II plots were 10% higher than in the CI plots (Table 2). Hence, water management affected grain yields and yield components in the first wheat season. In the second season, yields ranged from 1·4 to 5·7 t/ha. Grain yield increased almost linearly with increasing N rates and was closely related to grain number per unit area (R 2=0·9618, n=15), which ranged from 4000 to 15 800 per m2, suggesting a strong N limitation to grain formation in the 0/0 plots. In both seasons, grain number increased with increasing N rate, though effects were more pronounced in the second season. On average, yields at the N rates of 150 and 300 kg/ha were lower in the first season, associated with lower grain numbers per unit area. In both seasons, effects of N rates in the preceding rice crop on wheat yield and yield components were not significant, suggesting no carry-over of residual N between seasons. This even holds for the wheat control plots in the second year, following high N applications in rice season.
Yield components, yield and aboveground N uptake at maturity of wheat under different treatments in the 2002/03 and 2003/04 seasons, and their variation source
NS, not significant.
Aboveground N uptake
Average N uptake in wheat following II was 9 kg/ha higher than following CI in the first season (Table 2). In the control plots, wheat in particular absorbed more N following rice under II. Nitrogen uptake ranged from 31 to 109 kg N/ha in the first season, and from 30 to 184 kg N/ha in the second and was significantly affected by N rates, but not by the N rates on the preceding rice crop, indicating no carry-over of residual N in either year.
NUE
Grain yields increased with N rates in both wheat seasons (Fig. 3, quadrant (a)). In the first season, agronomic NUE (AE) of the 150 and 300 kg N/ha treatments was 9 kg grain/kg N applied and was not affected by water management in the preceding rice season. AE was on average 16 kg grain/kg N applied in the second season. ANRs in the first season were identical following CI and II in rice: 0·34 and 0·27 below and above 150 kg N/ha, respectively (Fig. 3, quadrant (c)), average ANR was 0·45 in the second season. Grain yield increased with increasing N uptake (Fig. 3, quadrant (b)), and NUE was not different for the water management treatments in the rice season, with an average value of 42 kg/kg in the first season.
Relations between N application and yield (quadrant a), N uptake and yield (quadrant b) and N application and N uptake (quadrant c) for the wheat seasons. Numbers in quadrant c represent ANRs (see text for details).

Soil nitrogen content
Total soil N
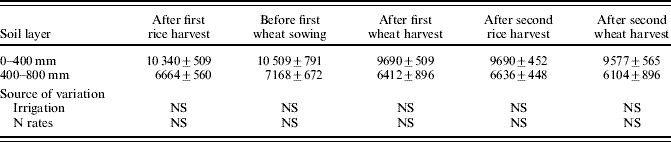
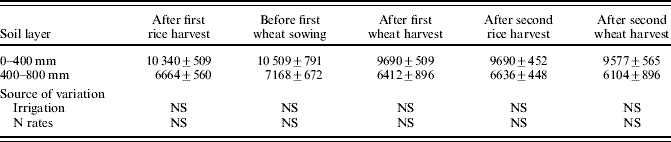
Total N in the 0–800 mm soil layer was variable during the experiment (Table 3), but the effects of irrigation and nitrogen management were not significant, while the distribution over the 0–400 and 400–800 mm soil layers hardly changed. In all treatments, total soil N decreased with soil depth.
Total nitrogen (kg/ha) in the 0–400 mm and 400–800 mm soil depths during the experiment
NS, not significant.
Soil nitrate
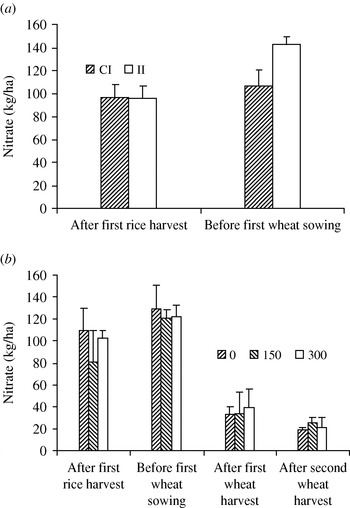
Soil nitrate varied significantly during the experiment (Fig. 4). Directly following harvest of the first rice crop, nitrate in the surface 400 mm layer was not different between CI and II, while after a fallow period of 17 days, it was higher under II than under CI. Nitrate was low and not different among N rates after rice harvest, confirming that carry-over of mineral N was limited. Nitrate following wheat harvest was much lower than after the first rice season, but not different among the N treatments.
Effects of different water management (a) and nitrogen application rates (b) on nitrate in the 0–400 mm soil profile during the experiment.

DISCUSSION
II of rice did not result in significantly lower yields than continuous flooding in the two experimental seasons, confirming previous experiences (Cao et al. Reference Cao, Jiang, Wang, Tian, Bouman, Hengsdijk, Hardy, Bindraban, Tuong and Ladha2002; Belder et al. Reference Belder, Bouman, Cabangon, Lu, Quilang, Li, Spiertz and Tuong2004, Reference Belder, Spiertz, Bouman, Lu and Tuong2005). In the present study, the soil water content in II was kept between 0·85 of soil water content at field capacity and saturation, which is not low enough (soil water tension <−10 kPa) to cause severe water stress for rice (Belder et al. Reference Belder, Bouman, Cabangon, Lu, Quilang, Li, Spiertz and Tuong2004). II, however, increased nitrogen uptake and yield of the subsequent wheat crop in the first season, associated with higher soil nitrate before the wheat season (Fig. 4). One possible reason is the higher residual root biomass of rice under II (Yang et al. Reference Yang, Yang, Yang and Zhu2004), resulting in higher N mineralization from residues, which resulted in higher indigenous N supply (Fig. 3 c). Further research is required to investigate this hypothesis.
Nitrogen had significant effects on grain yield and yield components of both rice and wheat. In rice, yield responded no further at N rates exceeding 150 kg/ha, in contrast to wheat, which responded up to rates of 300 kg N/ha, especially in the first season. In general, wheat yields were much lower than those of rice at the same N fertilizer rates. The period between panicle and spike initiation and maturity for both rice and wheat lasted 65 days. However, leaf area duration (the integral of green leaf area over time) in wheat was smaller than in rice, as wheat leaves senesced well before maturity in contrast to those of rice, which resulted in smaller average crop biomass (5 v. 15 t/ha).
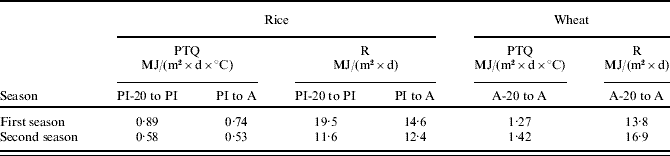
The lower yields of rice in the second season are a consequence of high rainfall and associated low solar radiation, resulting in lower spikelet densities. Two weeks after rice transplanting, in the tillering phase, a 3-week heavy rainfall period started. Rainfall on 4 and 5 July, totalled 200 mm (Fig. 1), resulting in complete submergence of the crop for 2 days. Radiation before anthesis was lower in 2003 than in 2002 (Table 4), resulting in lower growth rates and thus lower spikelet densities (Kropff et al. Reference Kropff, Cassman, Peng, Matthews, Setter and Cassman1994). The difference in yield between the 2 years was also consistent with the difference in photothermal quotient (PTQ), defined by Nix (Reference Nix and Yoshida1976) as the ratio of mean daily radiation for an interval to mean temperature minus a base temperature. PTQ prior to anthesis showed a positive linear relationship to grain yield (Nix Reference Nix and Yoshida1976; Islam & Morison Reference Islam and Morison1992; Ortiz-Monasterio et al. Reference Ortiz-Monasterio, Dhillon and Fischer1994).
The PTQ and radiation (R) from 20 days prior to panicle initiation (PI-20) to PI and from PI to anthesis (A) in rice and from 20 days prior to anthesis (A-20) to A in wheat in two seasons
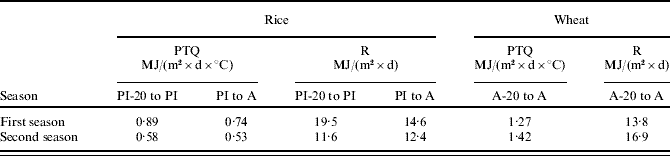
PTQ is defined as the ratio of the mean daily total incident solar radiation for an interval to the mean temperature less the base temperature (Nix Reference Nix and Yoshida1976). The base temperature for japonica rice is 8°C and for wheat 4·5°C.
N rates in the preceding rice season did not affect wheat yields, suggesting that there was little N carry-over from the rice season to wheat, which is supported by low total soil nitrogen and nitrate after rice harvest. This is consistent with results from Ladha et al. (Reference Ladha, Dawe, Ventura, Singh, Ventura and Watanabe2000), showing no residual effect on rice grain yield and N uptake after 8 years of urea–N application. Fan et al. (Reference Fan, Jiang, Liu, Zhang, Lu, Zeng and Christie2005) also observed no differences in soil mineral N after rice harvest following different N rates in rice. In contrast to the present results, however, Fan et al. (Reference Fan, Jiang, Liu, Zhang, Lu, Zeng and Christie2005) observed differences in residual mineral N following differential N rates on wheat. These divergent results may reflect differences in experimental conditions (soil and climate).
In the 2002/03 season, wheat yields were lower than in 2003/04 and the yields (4·5–6·0 t/ha) commonly realized at application rates of 135–315 kg N/ha after rice in South Jiangsu (Xu & Wu Reference Xu and Wu1999; Wang et al. Reference Wang, Lin, Sun, Xia and Lian2003). The lower radiation and PTQ during the 20 days prior to anthesis in the first wheat season (Table 4) resulted in much lower grain numbers (Nix Reference Nix and Yoshida1976; Fischer Reference Fischer1985; Bindraban et al. Reference Bindraban, Sayre and Solis-Moya1998), which may have created sink limitations during grain filling.
The pooled rice data showed higher ANRs under II than under CI, in line with other reports (Belder et al. Reference Belder, Spiertz, Bouman, Lu and Tuong2005). Low ANRs may have been caused by higher N losses under CI due to de-nitrification and ammonia volatilization (Cai et al. Reference Cai, Zhu, Trevitt, Freney and Simpson1986; Zhu et al. Reference Zhu, Cai, Simpson, Zhang, Chen, Jackson and Freney1989). Water management treatments in the previous rice season had no effect on ANR of wheat.
Dobermann et al. (Reference Dobermann, Witt, Abdulrachman, Gines, Nagarajan, Son, Tan, Wang, Chien, Thoa, Phung, Stalin, Muthukrishnan, Ravi, Babu, Simbahan and Adviento2003) reported strong variations in indigenous N supply in different areas of Asia, with a maximum value of 80 kg/ha in irrigated rice in Jinhua, Zhejiang Province in Southeast China. In the present experiment, indigenous soil N supply was 130 kg/ha in the first rice season and 91 kg/ha in the second, which was fully reflected in differences in rice yields of the control plots between the two years, i.e. 7·2 t/ha in 2002 and 6·7 t/ha in 2003. Potential indigenous N supply in rice in Southeast China may thus be substantially higher than the widely accepted rate of 80 kg N/ha, which should have consequences for nitrogen recommendations in rice (Witt & Dobermann Reference Witt, Dobermann, Dobermann, Witt and Dawe2004). Indigenous N supply was much lower in the wheat season, i.e. about 30 kg/ha (Table 2). This difference in indigenous soil N supply should be accounted for in nutrient management of RW systems.