

The archaeological record has long been conceived as consisting of the traces left behind by human occupation (Schiffer Reference Schiffer1987), but historically archaeologists have focused on the most tangible traces such as artifacts and ecofacts that we can see and touch. Today, studies are increasingly demonstrating that human beings and the activities they carry out also leave more subtle traces that require special methodologies to recover but which are no less informative than their more tangible counterparts (Barba Reference Barba and Manzanilla1986, Reference Barba2007; Middleton et al. Reference Middleton, Barba, Pecci, Burton, Ortiz, Salvini and Suárez2010; Middleton and Price Reference Middleton and Price1996; Parnell et al. Reference Parnell, Terry and Nelson2002a; Terry et al. Reference Terry, Fernández, Parnell and Inomata2004; Wells et al. Reference Wells, Terry, Parnell, Hardin, Jackson and Houston2000, Reference Wells, Novotny, Hawken, Glascock, Speakman and Popelka-Filcoff2007). Highlighted here is the geochemical study of anthropogenic soils associated with archaeological sites. Such studies have begun to identify signature residues, composed of phosphorus (P) and trace metals, which are the result of the daily activities of prehistoric human populations. The presence of phosphorus in soil is closely connected with the use and disposal of organic materials, particularly foodstuffs. As plant materials were gathered and animals hunted, phosphorus was transported to ancient settlements. Phosphorus is a component of many biological molecules within plant and animal food products, including phospholipids, nucleic acids, nucleotides, coenzymes, and phosphoproteins (Sanchez Reference Sanchez, Barker and Pilbeam2007). As the foodstuffs were processed and consumed and wastes disposed, the phosphorus became readily adsorbed, or fixed, on the surfaces of the soil particles where they remained for millennia (Barba and Ortiz Reference Barba and Ortiz1992; Parnell et al. Reference Parnell, Terry and Golden2001, Reference Parnell, Terry and Nelson2002a).
The presence of trace metal concentrations in soils significantly above background levels are also attributable to anthropogenic sources. Trace metals can be left behind by numerous events including the erosion of mineral pigments used in the decoration of architecture or other craft products, the deposition of raw materials collected for use in workshop activities, and the disposal of plant and animal remains, which in addition to phosphorus contain many trace nutrients. The metals associated with such activities precipitate on contact with calcareous soils and stucco floors found at Maya archeological sites, leaving behind the observable traces. Metals such as copper (Cu), iron (Fe), manganese (Mn), lead (Pb), and zinc (Zn) remain stable in the soil for long periods of time as they come in contact with clay lattices, or form insoluble oxide, sulfate, or carbonate complexes (Lindsay Reference Lindsay1979; Wells et al. Reference Wells, Terry, Parnell, Hardin, Jackson and Houston2000). The identification of patterns of trace metals in geochemically analyzed soil samples can provide us with significant information about prehistoric populations and can also be used prior to excavation as a primary step in the development of excavation strategies that save time and money and yield enhanced archaeological data (Barba et al. Reference Barba, De Pierreboug, Trejo, Ortiz and Link1995; Dunning Reference Dunning, Foss, Timpson and Morris1993; Manzanilla and Barba Reference Manzanilla and Barba1990; Parnell et al. Reference Parnell, Terry and Golden2001; Terry et al. Reference Terry, Hardin, Houston, Jackson, Nelson, Carr and Parnell2000).
In recent years, geochemical techniques have been employed to further our understanding of the pre-Columbian Maya (e.g., Barba and Ortiz Reference Barba and Ortiz1992; Dunning Reference Dunning, Foss, Timpson and Morris1993; Manzanilla and Barba Reference Manzanilla and Barba1990; Terry et al. Reference Terry, Hardin, Houston, Jackson, Nelson, Carr and Parnell2000; Wells Reference Wells2004). Bruce Dahlin, Richard Terry, and colleagues have extended geochemical analysis of soil phosphorus and metals to the identification of activities associated with marketplaces and other trade loci (Dahlin et al. Reference Dahlin, Jensen, Terry, Wright and Beach2007, Reference Dahlin, Bair, Beach, Moriarty, Terry, Staller and Carrasco2010). Arguments for the existence of marketplaces within Maya and Mesoamerican society have previously been based on architectural evidence, such as deliberately maintained open spaces and alignments of postholes and minimal stone foundations resembling market stalls (Jones Reference Jones1996; Tourtellot Reference Tourtellot1988; Wurtzburg Reference Wurtzburg1991), ethnographic and ethnohistoric comparative analyses (Berdan Reference Berdan and Plattner1985; Thompson Reference Thompson1970), as well as studies of the distribution of goods in the archaeological record (Garraty Reference Garraty2009; Hirth Reference Hirth1998). Recent geochemical studies of potential marketplaces, however, have provided additional lines of evidence for identifying marketplaces using soil chemistry. By examining soil samples from a contemporary Maya market in Guatemala, as well as multiple proposed ancient Maya markets, a pattern of phosphorus and zinc traces co-occurring has been noted (Bair et al. Reference Bair, Terry and Moriarty2006; Bair and Terry Reference Bair, Terry, Masson, Lope and Hare2009; Dahlin et al. Reference Dahlin, Jensen, Terry, Wright and Beach2007). Based on the ethnoarchaeological data gathered in Guatemala, these zones appear to be associated with the preparation and marketing of foodstuffs. It has also been noted that neighboring areas in these marketplaces tend to have elevated trace metal concentrations that have been suggested to be the result of processing and distributing craft materials (Dahlin et al. Reference Dahlin, Jensen, Terry, Wright and Beach2007). When such signatures are seen to have a patterned distribution, particularly when the pattern presents footpaths in between the identified features, as was noted at the contemporary market in Antigua, and the proposed ancient Maya markets of Trinidad de Nosotros and Chunchucmil, the interpretation of such open spaces serving as marketplaces is highly probable (Bair et al. Reference Bair, Terry and Moriarty2006; Dahlin et al. Reference Dahlin, Jensen, Terry, Wright and Beach2007, Reference Dahlin, Bair, Beach, Moriarty, Terry, Staller and Carrasco2010).
During the process of mapping the Preclassic Maya site of Xtobo, Yucatan, Mexico, Anderson encountered a large delineated space largely lacking in visible architecture, which was dubbed the Xtaabay Group. This open space was reminiscent of proposed marketplaces at other Maya sites and thus led Anderson to the work of Dahlin, Terry, and Bair. The early dates and the scale of society involved at Xtobo made the assumption of a marketplace and an associated market economy more dubious than for the larger Classic Maya settlements. In addition, time and money were short for intensive investigation of the feature, which would have required clearing an area of more than 5 ha of dense vegetation as well as horizontal excavations to expose traces of ephemeral marketplace stall constructions, if they even existed. Under these conditions the collection of surface soil samples in search of similar geochemical signatures provided a much more feasible methodology for a preliminary investigation of the Xtaabay Group in regard to its potential role in marketplace activities, as well as to gather further data on human activities in other areas of the site.
THE SITE OF XTOBO, YUCATAN, MEXICO
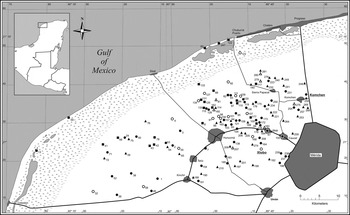
The archaeological site of Xtobo is a regional center within the Preclassic Maya occupation of Northwest Yucatan. The site was first recorded in 2002 by the Proyecto Costa Maya, a survey project investigating the northwest corner of the state of Yucatan, Mexico (Andrews and Robles Castellanos Reference Andrews and Castellanos2004). At the time, Xtobo was subject to basic investigations including the creation of a tape-and-compass map of the site center and the excavation of three test pits (Anderson Reference Anderson, Andrews and Castellanos2003). These initial investigations revealed a site of significant size with an occupation dating to the Preclassic period, favoring a Middle Preclassic date, with no significant later reoccupation. Proyecto Costa Maya additionally encountered a large Preclassic occupation throughout the region including a total of 140 sites, only seven of which were previously known (Figure 1). Analyses of the regional settlement pattern suggested that sites within the region were organized into a three-tiered settlement hierarchy, with Xtobo as one of perhaps three to four regional centers (Anderson Reference Anderson2005; Peniche May Reference Peniche May2010; Uriarte Torres Reference Uriarte Torres2011). This occupation included many notable features, but perhaps most interesting was the presence of 23 examples of ballcourt architecture dating to the Middle Preclassic period (Medina Castillo Reference Medina Castillo, Castellanos and Andrews2003, Reference Medina Castillo2005), one example of which is found alongside the plaza at Xtobo.
Map of northwest Yucatan showing sites with Preclassic period occupations. Sites marked by triangles represent sites with Middle Preclassic occupations, squares represent sites with Late Preclassic occupations, and circles represent sites with both Middle and Late Preclassic occupations (Anderson Reference Anderson2011:Figure 1).

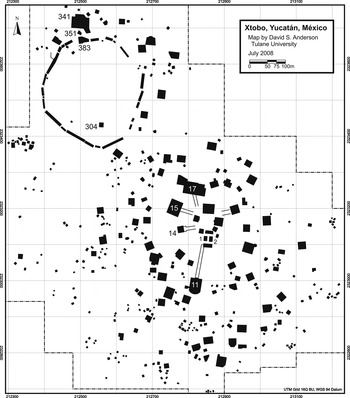
The precocious nature of this previously unknown regional Preclassic occupation, along with the lack of reoccupation at Xtobo, encouraged Anderson (Reference Anderson2010, Reference Anderson2011) to return to the site for further investigations. The new Proyecto Arqueologico de Xtobo carried out topographic mapping of the settlement and further test excavations to confirm the site's period of occupation. This work documented a densely inhabited settlement covering at least 67 ha, firmly dating to the Preclassic period, with the principle occupation beginning in the late Middle Preclassic period and continuing into the early Late Preclassic period. A total of 387 structures were encountered throughout the site expressing a notable variability in size and form (Figure 2). At the center of the site there is a well-defined plaza flanked by two pyramids, each approximately 8 m tall. To the south of the plaza, and in part connected to it, is the site's ballcourt, and radiating out from the plaza are five causeways connecting the plaza with other large architecture groups. Due to their associations with metates, or grinding stones, and their overall form, three of these connected architectural groups (Structures 15, 16, and 18) were hypothesized to be high-status residential compounds. Of the two remaining structures connected to the plaza, one is a small, heavily damaged pyramid, and the other is a double Triadic Group. Triadic Group architecture is a common form throughout Preclassic Maya sites in the Peten region of Guatemala and is composed of a main pyramid flanked by two small in-facing structures all three of which are frequently built upon a basal platform (Hansen Reference Hansen and Houston1998). The presence of a triadic group at Xtobo indicates a possible connection between the two regions. Outside of the site center the site includes a dense dispersal of residential architecture, including a wide diversity of structure forms. Together these features suggest that Xtobo was a culturally complex, albeit relatively small, community.
Map of Xtobo, Yucatan, Mexico. The Xtaabay group is visible in the northwest corner of the site.

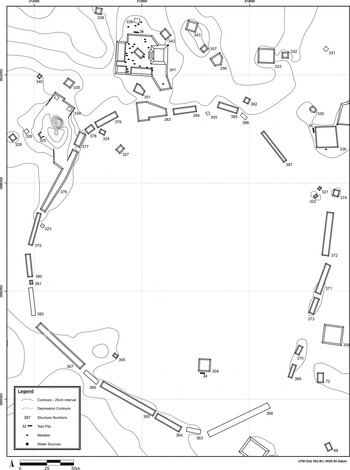
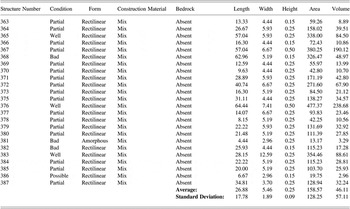
During the process of surveying and mapping the site of Xtobo, the delineated open space that is the Xtaabay Group came to light. Northwest of the site center a series of long, low stone platforms were encountered, which as a group were arranged to define a roughly circular area approximately 5 ha in extent (see Figure 3). In total, 24 of these defining structures were recorded (Table 1). The lengths of the structures vary significantly, but their widths are much less variable, averaging 5.46 m with a standard deviation of 1.89 m. The height of the structures also shows relatively little variability, averaging 25 cm high with a standard deviation of just 9 cm. The dimensions and construction techniques of many of these structures give them the general appearance of being sacbes, that is, elevated causeways. Sacbes were generally built by the Maya to either connect prominent architectural groups within a site, as seen in the center of Xtobo, or to connect important sites within a region (Folan Reference Folan and Trombold1991; Shaw Reference Shaw2008). Typically, sacbes are built in a straight line or along a single orientation, and while exceptions such as turns, curves, or intersections have been noted (e.g., Stuart Reference Stuart1979; Villa Reference Villa1934), they are not common. Thus, despite the appearance of the structures defining the Xtaabay group, their layout is completely atypical for Maya sacbes. Within the area defined by these structures there is a notable decrease in structure frequency. Within the 5 ha space only five structures were encountered, resulting in a dramatically lower structure density in comparison to the reminder of the site, which averaged over five structures per hectare. In addition, the structures located inside of the Xtaabay group are relatively small and almost all were located within 25 m of the defining structures, thus furthering the appearance of empty space within the group. Structure 304, a rectilinear platform measuring 13.5 × 13 m in extension and 50 cm tall, is the largest structure within the feature, and is also located furthest from the edge. Under the limited project resources it was not possible to directly date the Xtaabay group or its defining structures; however, a test pit placed alongside Structure 304 recovered a sizeable collection of Preclassic pottery and no pottery from the Classic or Postclassic periods. A similar pattern was noted in excavations carried out across the site, all excavations at Xtobo recovered Preclassic materials, while only two test pits associated with buildings in the site's periphery were found to also have significant quantities of Classic period pottery. Thus, Xtobo appears to have only witnessed a significant occupation during the Preclassic period. As such, while we currently lack direct data on the dating of the Xtaabay group, the preponderance of the evidence suggests that the Group can be associated with the Preclassic period occupation of Xtobo.
Map of the Xtaabay Group at Xtobo, Yucatan, Mexico.

Architectural data for the defining structures of the Xtaabay Group

The land on which the site of Xtobo is located has seen more recent use for the purposes of raising livestock. Just over a half of a kilometer to the west of the pre-Columbian site center is the Rancho Xtobo, a nineteenth-century cattle ranch. The possibility that the Xtaabay group was associated with this modern occupation, perhaps as a cattle pen, rather than the prehistoric occupation, was considered; however, the structures that define the Xtaabay group were found to be notably different from the structures found at the historic ranch. The historic period walls built to define cattle pens were constructed of a single course of large stones laid without the aid of mortar. Where they have collapsed, these walls leave a scatter of large stones no more than a meter wide and lacking in small filling stones. The width of the Xtaabay group structures noticeably surpasses that of the fallen historic walls, and the composition of the structures is much more similar to that seen for other pre-Columbian structures than it is for the historic period walls. Thus, it was determined that it was highly unlikely that the Xtaabay Group could be associated with the region's historic occupation.
One further structure at Xtobo was targeted for soil sampling due to its notable features. Structure 341 is easily the largest structure outside of the site center and is far enough away from the plaza that it was initially identified as the center of a separate site named Xtobo 2 (Robles Castellanos and Andrews Reference Robles Castellanos and Andrews2003). The building was labeled a Complex Basal Platform in the architecture typology developed during work at Xtobo due to its large area (2,070 m2) and the existence of five separate superstructures on top of the basal platform level. Also of note is that 23 limestone metates, or grinding basins, were found associated with the structure, along with an additional four metates on neighboring Structure 338. Together these metates make up approximately 23% of all metates encountered across the entire site. These data cause Structure 341 to clearly stand apart from its neighbors; also they bring to mind some of the late Terminal Classic platforms encountered at the site of Chunchucmil, Yucatan, which have likewise been found to be associated with abnormally large quantities of metates (Magnoni et al. Reference Magnoni, Hutson, Stanton, Stanton and Magnoni2008).
SOILS AND GEOLOGY OF THE REGION
Xtobo is located on a horizontal plain (0–5% slope) of Pliocene limestone-conglomerate lithology. The soils of the area are classified as Leptosols (World Reference Base) with possible nudilithic, lithic, and rendzic subdesignations depending on specific conditions that vary throughout the area (Bautista et al. Reference Bautista, Palacio-Aponte, Quintana and Zinck2011). The typical soil profiles at Xtobo are characterized by a thin surface horizon (averaging less than 37.5 cm) over limestone parent material (A/R) or a thin surface horizon over unconsolidated parent material over limestone bedrock (A/C/R). The Maya classification for soils found at Xtobo would likely be Pus lu'um, Tzek'el lu'um, or Box lu'um, as these all have characteristic dark, thin surface horizons due to increased organic matter overlying limestone (Bautista and Zinck Reference Bautista and Zinck2010). The Tzek'el lu'um designation is used in areas where there are bedrock outcrops or boulders. These soils have limited rooting space and are well drained yet have a high water retention and nutrient status due to the organic matter content (Bautista and Zinck Reference Bautista and Zinck2010; Sweetwood et al. Reference Sweetwood, Terry, Beach, Dahlin and Hixson2009). The soil landscape would not have been much different during ancient Maya times because these flat and clayey soils would have eroded very slowly if at all (Beach Reference Beach1998; Brenner et al. Reference Brenner, Leyden, Curtis, Gonzalez and Dahlin2003; Curtis et al. Reference Curtis, Hodell and Brenner1996; Sweetwood et al. Reference Sweetwood, Terry, Beach, Dahlin and Hixson2009).
METHODOLOGY
Our objectives in conducting geochemical prospection for phosphorus and trace metals at the site of Xtobo were to determine if the Xtaabay group may have served as a Preclassic Maya marketplace, as well as to determine the locations of important archaeological features associated with food preparation, consumption, and disposal and those related to workshop and use of pigments and other mineral materials within the central plaza and in association with Structure 341. In this way we could add to our current understanding of the site as well as identify areas of interest for future excavation projects.
Field Sampling
The sampling strategy at the Xtaabay group was to collect surface soil samples at 25 m intervals along 100 × 100 m transects that had been cut during the mapping process. A tighter sampling grid would have been preferable, but the dense vegetation found in the Xtaabay group would not allow for accurate positioning of the samples without further clearing. The area on and around Structure 341 was additionally targeted for sampling due to the structure's proximity to the Xtaabay group and the architectural features noted above. As the structure had been cleared for mapping, it could be sampled at 10 m grid intervals. Finally, the northern portion of the site center was also sampled to both investigate activities within the area and to serve as a comparison to the samples from the Xtaabay group. The relatively open vegetation found at the site center allowed for samples to be taken on 25 m grid intervals. At each grid point, the leaf litter was removed and three small 0–10 cm deep samples were collected by trowel, shovel, or core sampler within a 0.5 m radius. The samples (ca. 400 g) were placed in Whirlpak plastic bags and transported to the Soil Analysis Laboratory at Brigham Young University for preparation and chemical analysis. The samples were air-dried, and the aggregates were crushed to pass a 2 mm sieve.
Chemical analyses
A comparison of nitric/perchloric acid digested and extractable element analyses has demonstrated that both methods yield important information regarding ancient activity areas (Parnell et al. Reference Parnell, Terry and Nelson2002a). The proportionate increase in anthropogenic elements in samples from known human activity areas is, however, greater in the extraction procedures than in the mixed acid digestion procedure. The Mehlich and DTPA extraction procedures used in this study save both time and money and are much less hazardous than mixed acid digestion procedures. Phosphorus analysis was accomplished with Mehlich II extraction solution and Hach reagents (Hach Co., Loveland, Colorado). Solutions were measured for relative phosphorus concentrations using a Hach DR 850 spectrophotometer. The percent transmittance readings were compared to a standard curve and converted to parts per million concentrations of phosphorus (Parnell et al. Reference Parnell, Terry and Golden2001; Terry et al. Reference Terry, Hardin, Houston, Jackson, Nelson, Carr and Parnell2000). This procedure has been successfully tested at other Maya sites (Hutson et al. Reference Hutson, Stanton, Magnoni, Terry and Craner2007; Hutson and Terry Reference Hutson and Terry2006; Parnell et al. Reference Parnell, Terry and Golden2001, Reference Parnell, Terry and Nelson2002a, Reference Parnell, Terry and Sheets2002b; Terry et al. Reference Terry, Hardin, Houston, Jackson, Nelson, Carr and Parnell2000) and in ethnoarchaeological contexts (Fernández et al. Reference Fernández, Terry, Inomata and Eberl2002; Terry et al. Reference Terry, Fernández, Parnell and Inomata2004).
Trace metal analysis was conducted by a chelate extraction procedure, using 0.5 M DTPA (diethylenetriaminepentaacetic acid) solution buffered at pH 7.3 (Fernández et al. Reference Fernández, Terry, Inomata and Eberl2002; Hutson et al. Reference Hutson, Stanton, Magnoni, Terry and Craner2007; Lindsay and Norvell Reference Lindsay and Norvell1978; Parnell et al. Reference Parnell, Terry and Nelson2002a, Reference Parnell, Terry and Sheets2002b; Terry et al. Reference Terry, Fernández, Parnell and Inomata2004). Heavy metal concentrations were then determined on a Thermo inductively coupled plasma atomic emission spectrometer (ICPAES). Metals simultaneously analyzed were copper, iron, manganese, lead, and zinc. The Mehlich II and DTPA extraction procedures remove portions of precipitated and adsorbed phosphorus and trace metals from the surfaces of soil particles. Quality control samples were analyzed with each run. Background values of soils and floors were based on the average extractable element concentration in 10% of the samples lowest in concentration (Dahlin et al. Reference Dahlin, Jensen, Terry, Wright and Beach2007; Hutson and Terry Reference Hutson and Terry2006; Parnell et al. Reference Parnell, Terry and Nelson2002a; Terry et al. Reference Terry, Fernández, Parnell and Inomata2004).
RESULTS AND DISCUSSION
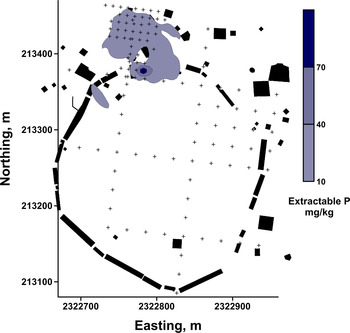
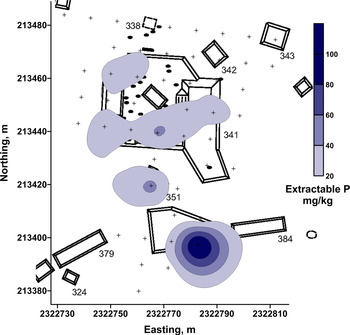
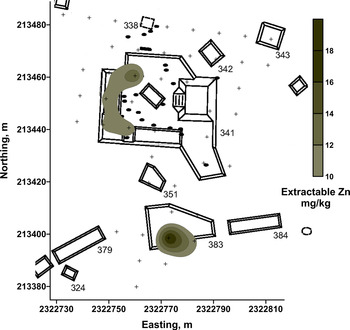
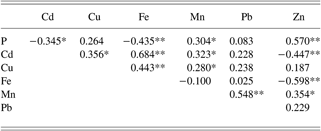
The geochemical analyses of the soil samples collected at Xtobo provided a series of interesting results. Background levels of soil phosphorus at Xtobo were determined to be 5.2 mg/kg throughout the site. Similar background phosphorus levels of 7.7 and 12 mg/kg were found in the soils at the sites of Chunchucmil and Mayapan, respectively, both of which are located in similar geologic contexts in northern Yucatan (Bair and Terry Reference Bair, Terry, Masson, Lope and Hare2009; Hutson and Terry Reference Hutson and Terry2006; Sweetwood et al. Reference Sweetwood, Terry, Beach, Dahlin and Hixson2009). The highest phosphorus concentration (117 mg/kg) encountered at Xtobo was found on Structure 383, which is one of the defining structures located on the northern edge of the Xtaabay group (Figure 4). This elevated phosphorus concentration was 22 times the background level for the site. This compares with the highest phosphorus concentrations at Chunchucmil Plaza D and Mayapan Square K that were 35 and 28 times the background phosphorus concentrations at those respective sites. South of Structure 383, the soil phosphorus concentrations in all other portions of the Xtaabay Group were within 3 mg/kg of the background level (5.2 mg/kg). Just to the north of Structure 383, elevated concentrations of phosphorus (in excess of 20 mg/kg) were found along the west and south edges of Structure 341 (Figure 5). Phosphorus levels were also high on adjacent Structure 351. The distribution of zinc traces follows a similar pattern to that of the observed phosphorus traces. The highest concentration of zinc (19 mg/kg) was found on Structure 383 of the Xtaabay group, and elevated concentrations were also noted in association with Structures 341 and 351 (Figure 6). Statistically, zinc concentrations were found to be significantly correlated with phosphorus levels for all three structures (r = 0.57, p < .01) (Table 2). Again mirroring phosphorus concentrations, near background levels of zinc (<3 mg/kg) were found throughout the remainder of the Xtaabay Group south of Structure 383 (data not shown). The elevated phosphorus and zinc signatures found in association with Structure 383 and the buildings to the north of the group are generally comparable to those collected in locations of food preparation, distribution, and consumption in the modern Guatemalan marketplace at Antigua (Dahlin et al. Reference Dahlin, Jensen, Terry, Wright and Beach2007). Therefore, the geochemical soil analyses suggest that similar activities took place at the north end of the Xtaabay group. However, it appears that if the Xtaabay group functioned as a marketplace, only this one building on the edge of the group would have served for food production and distribution.
The spatial distribution of extractable phosphorus in the Xtaabay group and north Structures 341, 351, and 383 at Xtobo. The isopleth lines represent the phosphorus concentrations in mg/kg.

The spatial distribution of phosphorus on the basal platform of Structures 341, 351, and 383 at the north edge of the Xtaabay group at Xtobo. The isopleth lines represent the extractable phosphorus concentrations in mg/kg.

The spatial distribution of zinc on the basal platform of Structures 341, 351, and 383 at the north edge of the Xtaabay group at Xtobo. The isopleth lines represent the extractable zinc concentrations in mg/kg.

Pearson Correlation of extractable elements on and around Platform 341 and Structures 351 and 383 at the north end of the Xtaabay Feature
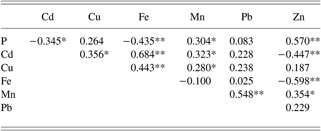
n = 51
Cronbachs Alpha =−0.197367
Standardized Cronbachs Alpha = 0.556542
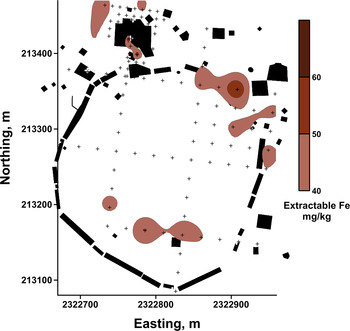
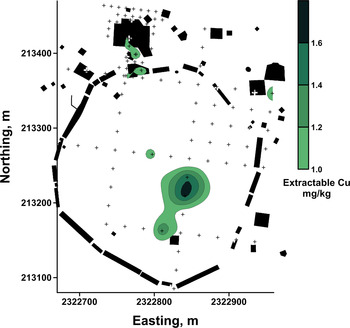
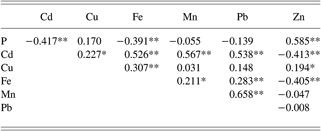
Iron and copper concentrations were noted in several areas throughout the Xtaabay feature and the northern structures (Figures 7 and 8). Though iron and copper concentrations were significantly correlated (r = 0.307, p < 0.01) (Table 3), the areas of highest concentration generally did not overlap with one another in the central and southern portions of the feature, suggesting they are the result of entirely separate activities.
The spatial distribution of extractable iron in the Xtaabay group and north Structures 341, 351, and 383 at Xtobo. The isopleth lines represent the iron concentrations in mg/kg.

The spatial distribution of extractable copper in the Xtaabay group and north Structures 341, 351, and 383 at Xtobo. The isopleth lines represent the copper concentrations in mg/kg.

Pearson Correlation of extractable elements on and around the Xtaabay feature and structures at the north end of the feature
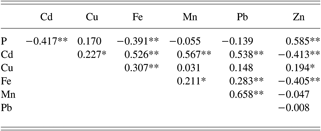
n = 117
Cronbachs Alpha =−0.256108
Standardized Cronbachs Alpha = 0.494052
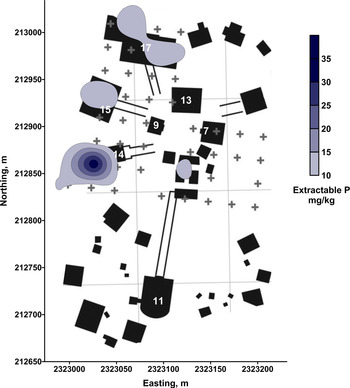
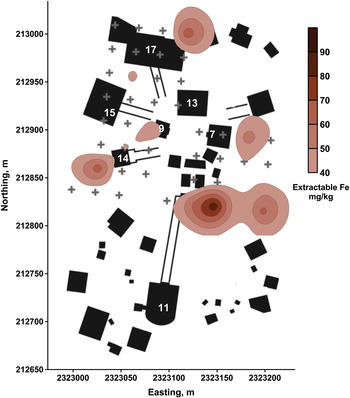
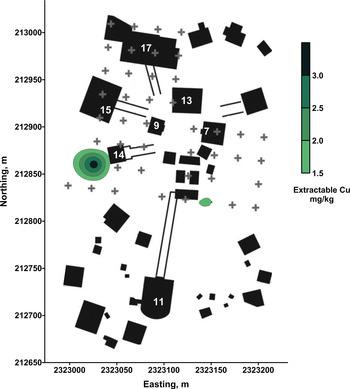
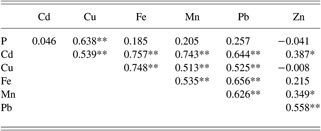
Elevated phosphorus levels were also found in samples collected from the central plaza, notably in association with Structures 15, 16, and 17, to the northwest of the plaza (Figure 9). The highest concentration of phosphorus (35.6 mg/kg) in the site center, however, was found just to the west of Structure 14. Structures 15 and 16 appear to be high-status domestic structures, while Structure 17 is a smaller platform annexed onto Structure 16. All three structures were found to be associated with metates, thus it is arguable that the phosphorus traces are the result of kitchen activities and domestic food remains. It should be noted that the phosphorus concentrations in the site center were not significantly correlated with zinc traces (r = 0.03 ns) (Table 4). The phosphorus concentration encountered to the west of Structure 14 is likely a special case of organic and mineral waste disposal because there were also high concentrations of the metals copper, iron, manganese, and lead at this location. The iron and copper concentrations found in the site center show a highly significant correlation (r = 0.747, p < .01) (Table 4; Figures 10 and 11). In some cases, though, the accumulation of elemental residues may be the result of translocational processes. For example, the concentrations of iron and copper located to the southeast of the ballcourt (Structures 2 and 3) overlap a low-lying area that accumulates drainage from the site during the rainy season.
The spatial distribution of phosphorus on the structures and floors of the central plaza at Xtobo. The isopleth lines represent the extractable phosphorus concentrations in mg/kg.

The spatial distribution of iron on the structures and floors of the central plaza at Xtobo. The isopleth lines represent the extractable iron concentrations in mg/kg.

The spatial distribution of copper on the structures and floors of the central plaza at Xtobo. The isopleth lines represent the extractable copper concentrations in mg/kg.

Pearson Correlation of extractable elements on and around structures at the site center of Xtobo
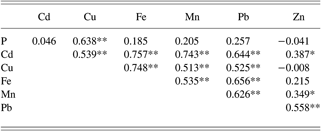
n = 43
Cronbachs Alpha = 0.459887
Standardized Cronbachs Alpha = 0.839612
Two locations at Xtobo showed a notable overlap of high concentrations of phosphorus, iron, copper, manganese, and lead—these were the samples taken in association with Structures 14 and 351. This mixture of both phosphorus and trace metals is suggestive of mixed household and workshop midden deposits. A similar geochemical signature was found in association with a midden excavated at the site of Aguateca, Guatemala, between Structures M8-8 and M8-10, where mixed household and workshop debris was encountered (Inomata et al. Reference Inomata, Triadan, Ponciano, Pinto, Terry and Eberl2002; Terry et al. Reference Terry, Fernández, Parnell and Inomata2004). It is also possible that the trace metals at Structures 14 and 351 resulted from eroded mineral pigments once used to paint the stuccoed architecture of Xtobo. However, the metallic residues are inconsistently associated with architecture and particularly in the case of the Xtaabay group; they were sometimes encountered well away from architecture. Future excavations and geochemical studies will have to be carried out to better understand the significance of trace metal residues in the anthropogenic soils at Xtobo.
CONCLUSIONS
The initial goal of the soil geochemical prospection at Xtobo was to identify possible marketplace activities carried out within the Xtaabay group. The almost complete lack of phosphorus and zinc in the south and central portions of the group would generally suggest that the group did not witness large quantities of organic debris or food preparation or distribution activities, which have been witnessed at other marketplaces. The trace metals observed were also minimal and did not show strong patterning, making the interpretation of their significance difficult. Thus, the geochemical analyses of the soil samples from the space defined by the Xtaabay group suggest that it is currently a weak candidate for a marketplace. The elevated levels of phosphorus and zinc found at the northern edge of the group as well as in association with Structure 341 and its neighboring structures are more comparable to the results found in marketplaces, but the majority of these traces were found outside of the Xtaabay group itself. These results are further complicated by the occupational history of Structure 341. A test pit excavated alongside the building confirmed it was one of only two known buildings at the site to be reoccupied in the Classic period. Thus, much more detailed excavations will have to be carried out to identify which portions of the building can be associated with the Preclassic occupation of Xtobo, as well as whether the soil tests reflect activities carried out in the Preclassic or Classic period.
That the geochemical analyses of soil samples from the Xtaabay group did not strongly support a marketplace hypothesis is perhaps not surprising. The 5 ha space is several times larger than proposed marketplaces at other Maya sites (Dahlin et al. Reference Dahlin, Bair, Beach, Moriarty, Terry, Staller and Carrasco2010) that were home to, and focal points for, considerably larger populations than that associated with Xtobo. Similarly, a market economy entails a level of economic development requiring full-time craft specialization as well as full-time agriculturalists that could produce sufficient quantities of food to have a surplus to contribute to the exchange. While Xtobo is significantly larger than other contemporary sites in the region, it still was likely home to only approximately 1,552 people at its peak level of occupation (Anderson Reference Anderson2011). There are clear indications of social hierarchy at the site, and thus specialization in personal societal roles; however, a full-scale market economy seems unlikely within a community of this size. It should be noted, however, that there are indications that the site of Xtobo may be considerably larger than currently projected, and if this is indeed the case, then the question of scale may need to be reexamined. In the meantime, Xtobo seems to have been too small to have been the center of a regional market economy.
This unfortunately leaves us without an explanation as to what the Xtaabay group represents. A feature of such notable size and prominence within the site certainly held some significance to the site's former inhabitants. Many possible functions for the group have been entertained, more than a few of which have involved judicious imaginative speculation, but in the end most proposed functions for the group are problematic. Linear perimeter features typically serve as walls either for the purpose of fortification or for imposing societal divisions. The low height of the Xtaabay group defining structures combined with the frequent gaps between them would make for a very poor wall to serve either function. In addition, examples of both types of walls almost always surround the sociopolitical/ritual center of a site, or at least areas of prominent architecture. The absence of significant architecture within the Xtaabay group argues against such a function. Walls can, of course, also be built to contain something rather than to keep something out—for example, animal pens. Such a function seems unlikely in this case, as again the boundary is too insubstantial to contain animals within the space. There could have been a perishable wooden wall built on top of the observed stone foundations, but currently no evidence exists to support such an assertion. Regardless, the low phosphorus concentrations of the soil samples within the Xtaabay group argue against the confinement and supplemental feeding of penned animals.
Open spaces also bring to mind agricultural fields. Indigenous Maya agricultural practices within the Yucatan peninsula generally focus on slash and burn agriculture techniques, which necessitate the rotation of fields every few years to avoid diminishing returns from nutrient-depleted soils. In part to offset this nutrient deprivation, corn, beans, and squash are grown together in a mixed agricultural method locally referred to as a milpa. Regardless, fields must be rotated every few years (Harrison Reference Harrison and Grube2006; Redfield and Villa Rojas Reference Redfield and Rojas1934).Footnote 1 Thus, the Xtaabay group could not have served as a traditional milpa for more than a few years without depleting the soil. The life of a milpa could be extended through the use of organic fertilizers, but the near background levels of phosphorus in the soil samples argue against this possibility. Another important component of Maya agricultural subsistence was the household garden, which was used to grow small quantities of specialty plants such as chili peppers, chaya, and other plants (Harrison Reference Harrison and Grube2006; Lentz et al. Reference Lentz, Beaudry-Corbett, de Aguilar and Kaplan1996). These gardens are typically small and associated with individual households; in addition, they are also kept productive by employing organic fertilizers. Thus, the scale of the Xtaabay group and again the near background levels of phosphorus make it unlikely the group served as a form of household garden.
There are other possible agricultural functions to which the group could have been put, including serving as an orchard for indigenous fruit trees or a field for henequen plants. Fruit-bearing trees make up an important part of household gardens but generally do not require fertilization. Henequen production for the purposes of extracting fiber to make rope is well known from Yucatan's historic period (Quezada Reference Quezada2001) but very poorly known from the pre-Columbian era. Both of these functions are plausible but will be difficult to prove, as the plants involved leave limited traces in the archaeological record (Calunga-García Marín Reference Calunga-García Marín, Gómez-Pompa, Allen, Fedick and Jiménez-Osornio2003; Turner et al. Reference Turner, Klepeis, Schneider, Gómez-Pompa, Allen, Fedick and Jiménez-Osornio2003).
It is also possible that the Xtaabay group could have been used for more esoteric, or dare we say “ritual,” purposes. Deliberately maintained open space could have been put to many uses involving public gatherings and demonstrations. The general problem for such an interpretation in this instance is the lack of cultural precedent or antecedent. The authors are unaware of similar architectural features at other Maya, or even Mesoamerican, sites; thus, there is not an existing pattern to which the group can be compared. A general parallel can be drawn with open plaza spaces, but the Xtaabay group is much larger than an average plaza and, of course, lacks the impressive flanking architecture, which is generally considered to be an important part of the cultural landscape of a plaza context. In the end, the function and/or the role of the Xtaabay group in the lives of the people of Xtobo cannot be firmly established. Clear effort was put into the construction of the group along with continued restriction on further building within the group during the site's lifetime. As such, there is no doubt that the group held some significance to the inhabitants of the site, but at this point we must hope that future investigations will result in a clearer understanding of the group's meaning to the inhabitants of Xtobo.
The results of the geochemical analysis of soils around the plaza of Xtobo, as well as in association with Structure 341, were generally more informative and corroborative. Both Structures 15 and 16 were previously hypothesized as high-status residences. Encountering elevated phosphorus concentrations in association with these buildings helps to bolster this interpretation of domestic function; although, as noted above, the phosphorus concentrations associated with these buildings were not correlated with zinc. This difference in geochemical signature may indicate a subtle difference in activities carried out at these structures. For example, it is possible that food was consumed at these structures but prepared somewhere else. The combined high levels of phosphorus and zinc in association with Structure 341, north of the Xtaabay group, as remarked above, matches the observed signature for both food production and consumption, and thus confirms that the structure's 23 metates were actually used in food production. Before the soil testing, the disproportionately large number of metates associated with Structure 341 had led Anderson to speculate that the metates may have been used for a different purpose, such as processing sascab Footnote 2 from the neighboring mine in order to make plaster. Thus, in this context the use of geochemical analyses helped to avoid an aberrant hypothesis. As noted above, however, the ultimate role of Structure 341 cannot be determined due to the recovery of significant quantities of Classic period sherds in association with the structure. The structure, and its many metates, may have served as a food production point for activities in the Xtaabay group, or the plethora of metates and phosphorus may instead simply be the result of a sustained occupation during both the Preclassic and Classic periods.
At this point, a definitive explanation for the remaining trace metals—iron, copper, manganese, and lead—cannot be offered. The use of hematite, a form of iron oxide, and other mineral pigments and craft items is well documented for Preclassic and Classic Maya culture (Brown and Sheets Reference Brown and Sheets2000; Parnell et al. Reference Parnell, Terry and Sheets2002b; Sheets Reference Sheets2000). Thus, the presence of iron in the soil could be reflective of craft production involving hematite decoration. Sheets (Reference Sheets2000) reported that each household at the village of Joya de Cerén, El Salvador, possessed at least one hematite cylinder, thus providing a potential explanation for widespread iron concentrations. The concentrations of copper and lead are generally less than 2 mg/kg and could have been contaminants contained in mineral pigments or other cultural materials. As mentioned above, trace metals could be the result of mineral pigments used to paint buildings, but the distribution of the trace metals is not evenly associated with architecture. The samples associated with Structures 14 and 351 are intriguing, as they contain both high levels of phosphorus and the metals iron, copper, manganese, and lead. They may be the result of middens or other specialized deposits, but the most problematic point is the disparity in associated architecture between these two samples. Structure 14 is a pyramid directly connected to the plaza by a sacbe, while Structure 351 is a small mound structure located near the site margins. It is unlikely that both buildings would have witnessed similar activities during their occupations. Future excavations at these locations should provide interesting results.
The geochemical analyses carried out at Xtobo have provided an informative data set, corroborating some hypotheses and creating a valuable set of data on which to base future investigations. The Xtaabay group remains an enigma but was clearly not associated with large quantities of organic material to leave behind traces of phosphorus. Results in other portions of the site effectively document what would have otherwise only have been speculated, particularly in association with the high-status residence at the site center. To advance the utility of geochemical prospection in archaeology, experimental studies are clearly needed to determine what activities would leave behind the trace metals observed at Xtobo and elsewhere. The refinement of these techniques will be of undeniable utility to all archaeology.
RESUMEN
El análisis geoquímico de muestras de suelo recolectadas en asociación con restos arqueológicos ha probado ser una herramienta eficaz para la identificación de actividades humanas del pasado. Esta metodología se aplicó al estudio de rasgos especiales del sitio de Xtobo, Yucatan, México. Xtobo fue un centro regional de la época preclásica en el noroeste de Yucatan, y exhibe un patrón de asentamiento complejo, incluyendo una plaza bien definida, varios caminos elevados, y un juego de pelota. Además, el sitio contó con una gran zona abierta y definida a través de la disposición de una serie de estructuras alargadas a su alrededor. Esta zona se pensó inicialmente que podría haber correspondido a un posible área antiguo de mercado. Los resultados del análisis geoquímico en esta área muestran que en varias zonas hubo producción y consumo de alimentos así como en algunas zonas pudieron haberse realizado actividades de producción artesanal. Los resultados del análisis de las muestras recolectadas en el posible área que pudo haber sido el mercado antiguo son anómalas pero no concluyentes.
ACKNOWLEDGMENTS
We wish to dedicate this work to the memory of our colleague Bruce Dahlin who enthusiastically aided in the process of bringing the authors together for this joint research project. He will be sorely missed. We also want to extend thanks to Mary Pletsch, Rachel Bair, Travis Hall, and Dr. John Graveel for their assistance with sample collection. The Instituto Nacional de Antropología e Historia (INAH) permitted the site survey. Funding was provided by the Brigham Young University Mentored Research Program.