INTRODUCTION
The efficiency of phosphorus (P) utilization by dairy cattle has become an increasingly important issue. Concerns about the detrimental effects of excess P excretion into the environment on water quality have led to more restrictive legislation on nutrient management (e.g. the EU Water framework directive (European Commission 2000)). Moreover, global P scarcity is expected during the coming decades (Cordell et al. Reference Cordell, Drangert and White2009), requiring more efficient use of available P.
Phosphorus requirements for milk production comprise a large fraction of the total P dietary requirements of high-producing dairy cattle. Valk & Beynen (Reference Valk and Beynen2003) compared various P requirement systems and found that the dietary P requirement of a dry, pregnant cow was on average 25 g/d, whilst the dietary P requirements of a cow producing 40 kg milk/day was on average 89 g/day. In current recommendations, net P requirements for milk are assumed to be constant, proposing values of 0·9 (NRC 2001; Valk & Beynen Reference Valk and Beynen2003) or 1·0 (CVB 2005) g P/kg milk. However, P content of milk may vary (Lenstrup Reference Lenstrup1926; Pfeffer et al. Reference Pfeffer, Beede, Valk, Pfeffer and Hristov2005; Bannink et al. Reference Bannink, Sebek, Dijkstra, Vitti and Kebreab2010). Moreover, P content in milk may have changed in recent decades (Bijl et al. Reference Bijl, Van Valenberg, Huppertz and Van Hooijdonk2013). This variation in milk P content has consequences for the calculation of the efficiency of P utilization for milk production (i.e. the fraction of ingested P that is incorporated in milk; Bannink et al. Reference Bannink, Sebek, Dijkstra, Vitti and Kebreab2010). Additionally, as the field of animal nutrition moves towards a response-based approach (Dijkstra et al. Reference Dijkstra, Kebreab, Mills, Pellikaan, López, Bannink and France2007), more detailed information on P use for milk production purposes in dairy cattle is required.
On average, 0·70 of all P in milk is present in inorganic forms, 0·20 is esterified with casein, and 0·10 is associated with lipids (NRC 2001). Despite the large amount of available literature with regard to P nutrition and metabolism of dairy cattle, information with regard to variation in milk P content is scarce. It is known that the average P content of milk may vary between different cow breeds (Cerbulis & Farrell Reference Cerbulis and Farrell1976). Wu et al. (Reference Wu, Satter and Sojo2000, Reference Wu, Satter, Blohowiak, Stauffacher and Wilson2001) and Bijl et al. (Reference Bijl, Van Valenberg, Huppertz and Van Hooijdonk2013) found that milk P content was related to milk protein content (g/kg), while NRC (1989) assumed the requirement of P for lactation to be related to the fat content of milk. Subsequently, NRC (2001) suggested that P requirement adjustment based on milk fat content is not of major quantitative significance. In a review by Shennan & Peaker (Reference Shennan and Peaker2000) regarding transport of milk constituents by the mammary gland, it was suggested that the main route of P secretion into milk is via the Golgi secretory vesicles. Inorganic P (P i) is released during the formation of both caseins and lactose in the Golgi, and thus it could be hypothesized that variation in both lactose and protein content of milk could explain part of the variation in milk P content. To our knowledge, this relationship has not yet been tested empirically. Therefore, the objective of the present study was to evaluate the hypothesis that the P content of milk is related to both milk protein and milk lactose content, but not necessarily to milk fat content.
MATERIALS AND METHODS
Data description
Three experiments with individual animal data for milk yield and milk composition were analysed statistically to estimate the effects of variation in milk yield and milk composition (fat, protein and lactose) on milk P content. Experiments 1 and 2 were reported previously by Brandsma & Blok (Reference Brandsma and Blok2005). Briefly, Expt 1 was performed at the ‘Schothorst’ research farm (Lelystad, the Netherlands). Three diets that differed in grass silage to maize silage ratio (65 : 35; 50 : 50; 35 : 65) were fed and concentrates were fed according to milk production level. Experiment 2 was performed at the ‘Waiboerhoeve’ research farm (Lelystad, the Netherlands). Cows received a diet containing grass silage, maize silage, concentrates, soyabean meal, minerals and salt at varying ratios. Experiment 3 was based on the available individual animal data originating from a long-term experiment on P nutrition of dairy cows (Valk & Sebek Reference Valk and Sebek1999; Valk et al. Reference Valk, Sebek and Beynen2002). In the former study, dietary P allowance was 0·67, 0·80 or 1·00 of the Dutch recommendations at that time. Differences in dietary P allowance were obtained by feeding concentrates with different P contents. The basal diet contained grass silage (or artificially dried hay), maize silage, beet pulp, wheat straw and a low P concentrate mixture (Valk & Sebek Reference Valk and Sebek1999; Valk et al. Reference Valk, Sebek and Beynen2002). Information on P intake was not available for all cows, but to our knowledge, a relationship between P intake and milk P content within physiological limits has not been found previously (Klop et al. Reference Klop, Ellis, Bannink, Kebreab, France and Dijkstra2013).
In all three experiments, milking was performed twice daily and milk samples from morning and evening milking were pooled (weight basis) before analysis for milk components. Milk samples were analysed for P content according to internal standard procedures by the Chemical and Endocrinological Laboratory, Lelystad, the Netherlands. Samples were homogenized and diluted and perchloric acid and hydrogen peroxide were used for wet digestion of the samples. Subsequently, the P released was coloured with a vanadate/molybdate solution. The P content was determined spectrophotometrically at 405 nm. The coefficient of variation of this method was 1·7%.
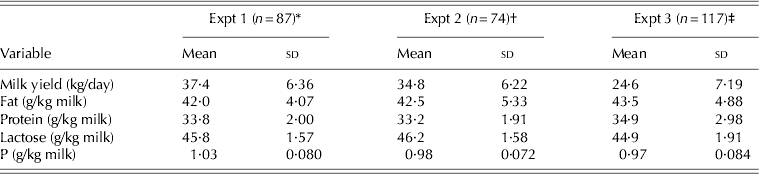
The data from Expt 1 comprised 87 individual cow observations for the variables milk yield, milk fat (g/kg), milk protein (g/kg), milk lactose (g/kg) and milk P (g/kg) (Table 1). Cows in Expt 1 were between 14 and 22 weeks in lactation at the moment of sampling. Repeated observations made over time on the same animal were available for 10 and 24 individual cows for Expts 2 and 3, respectively (Table 1). Milk samples in the dataset of Expt 2 were taken in the period from week 3 until week 20 of lactation. For Expt 3, no information was available regarding stage of lactation at the moment of sampling. To account for the different data structure between Expt 1 and Expts 2 and 3, data analysis for each separate experiment was performed first. Combining the three experiments into one dataset requires averaging of the data per cow for Expts 2 and 3, which could remove a significant portion of the natural variation which is actually of interest. Subsequent to individual analysis, to examine whether a common significant relationship existed, combined analysis was also performed by averaging the repeated data within Expts 2 and 3. Within this combined dataset of the three experiments, the ranges of values for milk yield and fat, protein and lactose content were 17·8–50·7 kg/day, 33·9–53·3 g/kg, 28·8–40·2 g/kg and 40·8–49·0 g/kg, respectively.
Description of the data used for statistical analysis
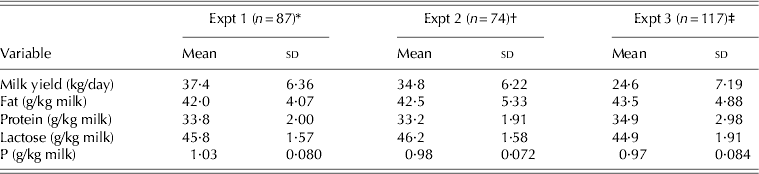
* 87 cows; single observation per animal.
† 10 cows; 6–8 observations per animal.
‡ 24 cows; 3–6 observations per animal.
Statistical analysis
Statistical analysis in all three experiments was performed using PROC MIXED (SAS Institute 2008). For Expt 1, effects of milk yield, milk fat, milk protein and milk lactose content on milk P content were treated as fixed effects in the model. For Expts 2 and 3 the same procedure was used; however, as these experiments contained multiple observations per animal, a random effect of cow was added to the statistical model.
The combined analysis of the three experiments was also performed using PROC MIXED, treating the effects of the available prediction variables as fixed effects, and experiment as random. The random effect of cow was removed as one (average) observation per cow was analysed. The square root of the number of observations per animal was used as a weight factor in the statistical model.
For all models including a random effect of study, an unstructured (UN) variance–covariance structure was fitted. However, the use of this structure requires estimation of a large number of variance and covariance parameters and sometimes resulted in non-convergence of the model. In cases of non-convergence, effects were stepwise removed from the random statement or the variance–covariance structure was simplified. Effects were also removed from the random statement if the P-value of the covariance parameter estimates was above 0·20. This P-value was arbitrarily chosen and higher than the traditional 0·05 because accurate estimation of variance and covariance parameters requires a large number of observations, and therefore more liberal P-values can be used to test effects included in the random statement (St-Pierre Reference St-Pierre2001; Sauvant et al. Reference Sauvant, Schmidely, Daudin and St-Pierre2008). In all cases, estimates of fixed effects were tested against a significance level of P<0·05 and the Bayesian information criterion (BIC) was used as the statistical criterion to indicate the goodness of model fit, where the lower values indicate a better fit (SAS Institute 2008).
Equation evaluation
Owing to the limited availability of data on the relationship between milk P and milk yield/composition, the equations derived from the present study were evaluated back against the developmental database, with the caveat that equations developed should subsequently be evaluated independently when data come available. Evaluation was conducted using the mean square prediction error (MSPE) (Bibby & Toutenburg Reference Bibby and Toutenburg1977) and concordance correlation coefficient (CCC) (Lin Reference Lin1989). The MSPE statistic was calculated as:
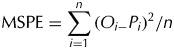 $${\rm MSPE} = \sum\limits_{i = 1}^n {(O_{i -} P_i )^2} /n$$
where n is the total number of observations and O i and P i indicate the observed and predicted values, respectively. The square root of the MSPE (RMSPE) provides an estimate of the overall prediction error when expressed as a fraction of the observed mean. The RMSPE comprises three error fractions, viz. error in central tendency (ECT), error due to deviation of the regression slope from unity (ER) and error due to disturbance, or random error (ED). In addition to the MSPE, the CCC value was used as a second evaluation tool and calculated as:
 $${\rm CCC} = R \times C_b $$
In this formula, R is the Pearson correlation coefficient and a measure of model precision, whereas the bias correction factor (C b) provides a measure of accuracy of the model. The measures v (scale shift) and μ (location shift) are used to calculate C b, where a change in v indicates differences in sd between predicted and observed values. The μ-value indicates under prediction or over prediction at positive or negative values, respectively (Ellis et al. Reference Ellis, Bannink, France, Kebreab and Dijkstra2010).
The residuals (observed-predicted) were tested for normality using the UNIVARIATE procedure in SAS. Residual slopes were tested for significant difference from zero, an indication of heteroscedasticity.
RESULTS
The content of P in milk was on average 1·03, 0·98 and 0·97 g/kg in Expts 1, 2 and 3, respectively (Table 1). Values for milk P content of individual cows across the three experiments ranged from 0·72 to 1·21 g/kg milk.
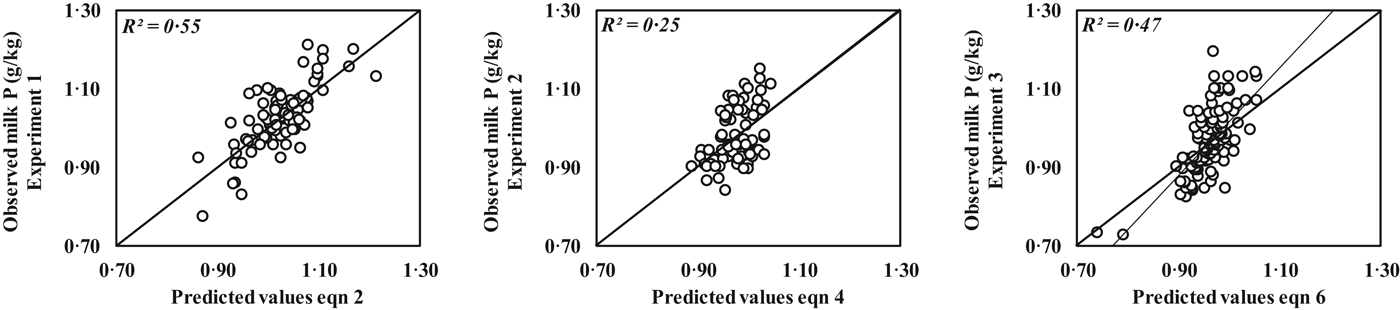
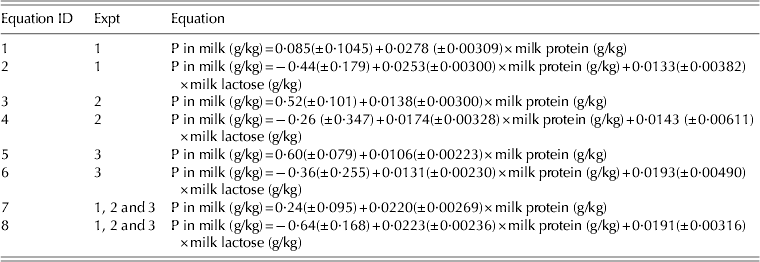
For all three separate experiments and the combined dataset, the best single-variable model, when milk yield (kg/d), milk fat (g/kg), milk protein (g/kg) and milk lactose (g/kg) were potential model variables, included the effect of milk protein. The best two-variable models always included the effects of both milk protein and milk lactose (Table 2; Fig. 1). Milk lactose (g/kg), as a single independent variable in a model for milk P (g/kg), showed the significant effects for the data from Expt 1 and for the combined study analysis only. Single variable models containing milk fat as independent variable showed significant effects, but BIC values were always higher (−201, −221, −301 and −297 for Expts 1, 2, 3 and combined data, respectively) than those of a single variable model containing milk protein as independent variable (−230, −232, −311 and −303 for Expts 1, 2, 3 and combined data, respectively). For all separate experiments and for the combined analysis, the effect of milk fat as third prediction variable in a model that already included the effects of milk protein and lactose on milk P was not significant. The effect of milk yield as a single variable was only significant for Expt 1 and for the combined data, but the BIC was higher (−181 and −252 for Expt 3 and combined data, respectively) than the BIC of a single variable model containing protein as independent variable (−230 and −303 for Expt 3 and combined data, respectively).
Observed v. predicted values for P content of milk (g/kg) for the different experiments (1, 2 and 3, respectively) based on estimates of the model including milk protein (g/kg) and milk lactose (g/kg) as independent variables (Eqns (2), (4) and (6)).

Regression equations for the best one- and two-variable models to predict observed variation in milk P content (g/kg milk), for Expts 1, 2 and 3 and a combined dataset
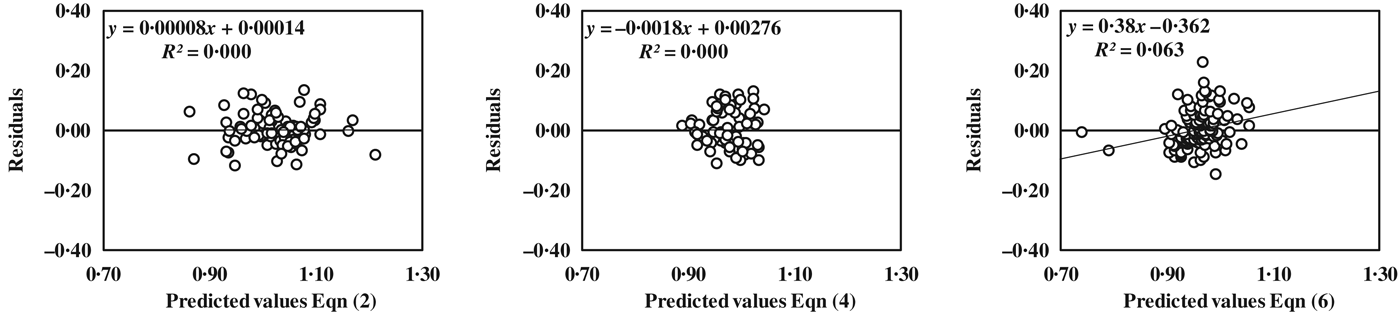
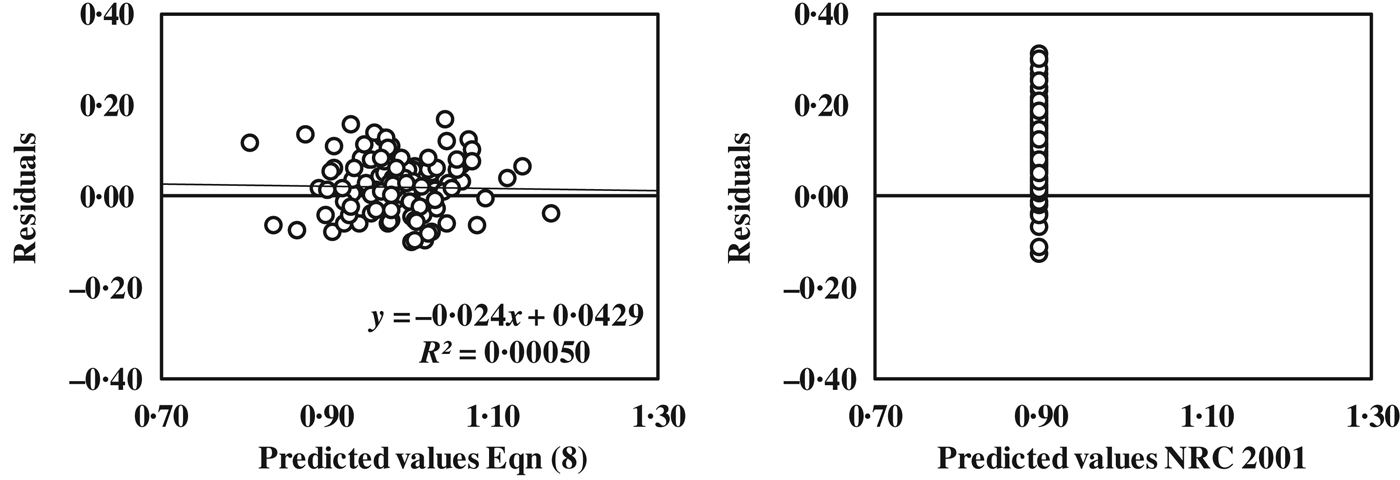
Based on the residual analysis, residuals of all equations were normally distributed, except for Eqns (2) and (6) (Fig. 2). The line across the residuals resulting from application of Eqn (6) was also significantly (P<0·05) different from zero.
Plots of residuals (observed-predicted) v. predicted values for the different experiments (1, 2 and 3, respectively) after application of the model including milk protein (g/kg) and milk lactose (g/kg) as independent variables (Eqns (2), (4) and (6)).
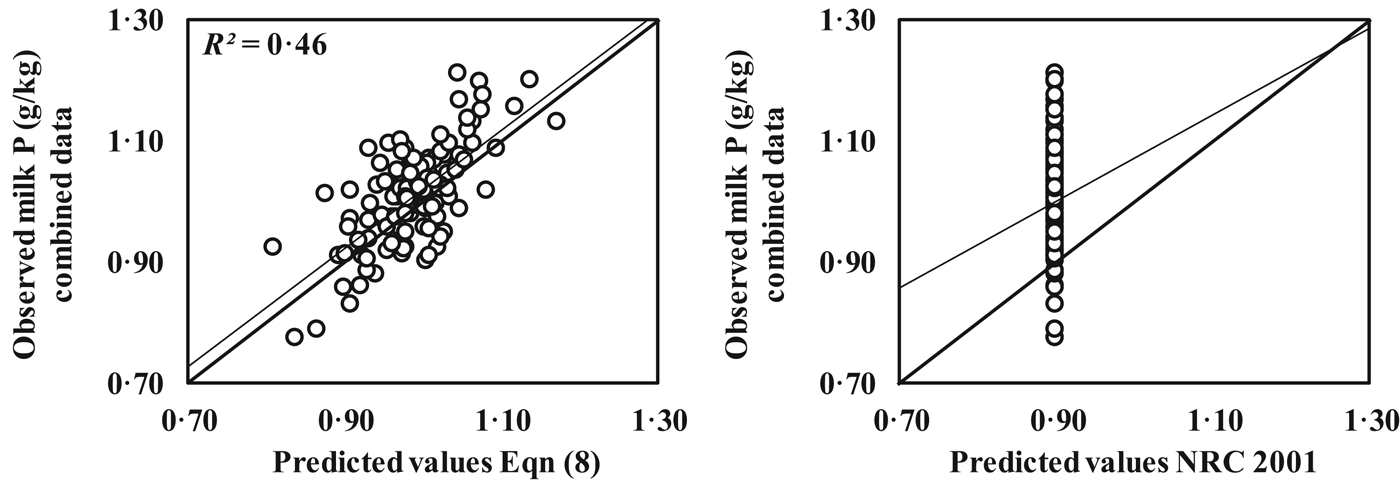
For all the derived regression equations, the random error fraction comprised >0·90 of the total RMSPE (Table 3). The ECT values for the individual study equations are all low, but increased for the equations derived from analysis of the combined experiment (Eqns (7) and (8); Table 3). Adding lactose as a prediction variable to a model already including protein always resulted in a lower RMSPE and a higher CCC value. The improvement in CCC values ranged from +0·05 for Expt 1 to +0·23 for Expt 3 (Table 3). This improvement in CCC resulted partly from higher precision (R), but also from higher accuracy of the models. The difference in sd between the observed and predicted values (v) is smaller for models including lactose as an additional prediction variable (Table 3). Since there is no variation in predicted values when using fixed values for milk P content, it is not possible to calculate the different fractions of RMSPE or CCC values for such prediction equations. However, comparing the predicted v. observed plots after application of either Eqn (8) or the most commonly used fixed value of 0·9 g P/kg milk to the combined data of the three experiments, shows that the former equation explains considerably more of the observed variation in milk P content (Figs 3 and 4).
Observed v. predicted values for P content of milk (g/kg) for the dataset comprising all three experiments, based on estimates of the model including milk protein (g/kg) and milk lactose (g/kg) as independent variables (Eqn (8)). The commonly used fixed value of 0·9 g P/kg milk (NRC, 2001) in relation to the observed milk P content in the combined dataset is shown for comparison. For the latter, no regression line was fitted because of absence of variation in predicted P content.
Plots of residuals (observed–predicted) v. predicted values for the dataset comprising all three experiments, after application of the model including milk protein (g/kg) and milk lactose (g/kg) as independent variables (Eqn (8)). The plot with residuals v. predicted values based on the commonly used fixed value of 0·9 g P/kg milk (NRC, 2001) is shown for comparison. For the latter, no regression line was fitted because of absence of variation in predicted P content.
Evaluation of regression equations for the prediction of milk P (g/kg) for the Expts 1, 2 and 3 and a combined dataset
RMSPE, Root-mean-square prediction error expressed as a percentage of the observed mean; ECT, error resulting from overall bias, as a per cent of total MSPE, ER, error resulting from deviation of the regression slope from unity, as a per cent of total MSPE; ED, random error, as a per cent of total MSPE; CCC, concordance correlation coefficient, where CCC=R×C b; R, Pearson correlation coefficient; C b, bias correction factor; v, scale shift; μ, location shift; BIC, Bayesian information criterion.
DISCUSSION
The aim of the present work was to evaluate the hypothesis that both protein and lactose content of milk, but not necessarily milk fat content, are related to the P content of milk. The commonly used fixed value of 0·9 g P/kg milk (NRC 2001) was also evaluated against the combined data of the three experiments and served as reference for the current guidelines regarding P requirements for milk production. The finding that the model including both the effects of milk protein and milk lactose was the best two-variable model to explain the observed variation in milk P content, and that the inclusion of milk fat in equations already including protein and lactose content did not further improve prediction of milk P content, supports the hypothesis regarding the biological relationship between milk protein and lactose and the P content of milk as previously suggested by Shennan & Peaker (Reference Shennan and Peaker2000). Moreover, milk protein content and milk fat content were significantly correlated, which may explain that the effect of fat content on milk P content was significant in a single variable model, but not in a model already containing protein and lactose content as independent variables.
According to Dutch recommendations, net P requirements for milk production are 1·0 g P/kg milk (CVB 2005), which is closer to the observed average milk P content than the internationally used 0·9 g P/kg milk (NRC 2001). A possible explanation for this difference is that the average protein content of milk from dairy cows in the USA is lower than that of milk from Dutch dairy cows (Capper et al. Reference Capper, Cady and Bauman2009; Heck et al. Reference Heck, Van Valenberg, Dijkstra and Van Hooijdonk2009). Indeed, in the dataset (n=94) used by Klop et al. (Reference Klop, Ellis, Bannink, Kebreab, France and Dijkstra2013), mean milk P content was 0·9 g/kg milk, and milk fat and protein content were some 10% lower (viz., 38 and 30 g/kg milk) than in the present dataset. Using a fixed value of 0·9 or 1·0 g P/kg milk for prediction milk P content resulted in RMSPE values of 13·6 and 8·1%, respectively. The RMSPE of the 1·0 g P/kg milk equation is closer to the RMSPE value of Eqn (8) (6·2%) than the RMSPE of the 0·9 g P/kg milk equation, but results show that the former equation explains considerably more of the observed variation in milk P content.
A significant slope in the residual plot of Eqn (6) may indicate heteroscedasticity, but for such a relatively small database it is difficult to draw conclusions regarding the normality and variance of the residuals. Even though limitations in inference due to the size and distribution of the database exist, the analysis shows interesting results and is thus of value and warrants further exploration of this biological and empirical phenomena.
There was some variation in parameter estimates among the three experiments, in particular for the estimate of the effect of milk protein on milk P. Some of this difference could be attributed to random variation. In mixed model analysis, these differences are attributed to the random effect of study, and have been suggested to be due to differences in technicians, management and laboratory techniques. These differences may be partly attributed to the lower number of animals evaluated especially in Expt 2. However, it may also indicate that factors other than milk composition may contribute to variation in the P content of milk. For several data points, no detailed information on dry matter intake (DMI) and diet composition was available, but cows from Expt 1 had an average P allowance of 150% of the Dutch recommendations for dietary P (Brandsma & Blok Reference Brandsma and Blok2005) while cows from Expt 3 received a ration with a P content corresponding to either 100, 80 or 67% of the Dutch-recommended amount at the time the experiment was performed, over a two-lactation period (Valk & Sebek Reference Valk and Sebek1999; Valk et al. Reference Valk, Sebek and Beynen2002). Taking into account that some of the cows in Expt 3 had a long-term reduction in P allowance, this may have caused a difference in overall P metabolism of those cows from Expt 3 as compared to cows from Expt 1. Another aspect that may relate to the observed differences in estimates between experiments is the structure of the data. For Expt 1, the relationship is estimated over different animals all sampled once on the dame day, whereas in the model for Expts 2 and 3, within-animal variation is also taken into account.
It is possible that a seasonal effect on milk P content may exist, but this could not be investigated in the present study. Lenstrup (Reference Lenstrup1926) reported that the acid insoluble P fraction in milk was similar to the casein P fraction, and that the P i fraction was the most variable throughout the year. Lenstrup (Reference Lenstrup1926) found that the lowest P i concentrations in cow's milk were found in the summer. This observation is in line with Forar et al. (Reference Forar, Kincaid, Preston and Hillers1982), who also reported a decline in P i content of cow's milk during the summer months. Lenstrup (Reference Lenstrup1926) relates the difference in P i content to the fact that cows were allowed to graze on pasture in the summer months, and in that case, changes in the P content of milk could be related to dietary changes. However, Forar et al. (Reference Forar, Kincaid, Preston and Hillers1982) claim that there were no differences in ration components during their entire experiment; however they did not state whether the composition of diet components was the same or different. An investigation of seasonal variation in milk composition of Dutch dairy cows (Heck et al. Reference Heck, Van Valenberg, Dijkstra and Van Hooijdonk2009) showed that milk protein content was lowest during summer and highest during winter. In the same study, the lowest values of lactose were found in autumn and the highest values were found in spring, but variation in lactose content was minor only. With regard to the hypothesis proposed in the present study, such differences in milk composition throughout the year may affect the P content of milk. Since seasonal calving is not a common practice in the Netherlands, Heck et al. (Reference Heck, Van Valenberg, Dijkstra and Van Hooijdonk2009) suggested that seasonal variation in milk composition is more likely to be a result of changes in diet composition than related to stage of lactation. Forar et al. (Reference Forar, Kincaid, Preston and Hillers1982) found a decrease in P i content of milk in later lactation: however, based on their reported information, the fact that diet composition or changes in DMI were confounding factors in this respect cannot be ignored. Although not statistically significant, a slight reduction in milk P content with advancing stage of lactation was also reported by van Hulzen et al. (Reference Van Hulzen, Sprong, Van Der Meer and Van Arendonk2009).
Another factor worth considering in relation to seasonal variation of milk P content is temperature. The P content of milk from cows housed at a temperature of 28 °C was shown to be significantly lower than the P content of milk from cows housed at 18 °C (Kamiya et al. Reference Kamiya, Kamiya and Tanaka2010); however, since the experimental animals in that experiment were not fed pairwise, the lower feed intake of cows kept at 28 °C may have confounded the temperature effects on milk production and milk P content. Unfortunately, the protein and lactose content of the milk were not reported.
The individual experiments tested in the present study showed a significant effect of lactose and protein on milk P, and combining the data of the three separate experiments, averaging by cow, resulted in significant (P<0·001) overall slope estimates for both protein and lactose (Eqn (8)). The combined analysis carries the caveat that the collection of studies is not really large enough for the experiment to be truly random. Part of the variation is lost by averaging values per animal. Although the primary interest was in the individual study analysis, the analysis on the combined dataset confirms the hypothesis across studies. Equations derived from single experiments are reported to indicate the hypothesized relationship between milk protein and lactose and milk P. The equations derived from the combined data, treating experiment as random effect, could be applicable outside the range of experiments included in the regression analysis. However, it is generally not recommended to use equations for conditions outside the range they were developed on (St-Pierre Reference St-Pierre2001). Nevertheless, the finding that the slopes are still significant when all data are combined appears useful knowledge and can be considered as a promising starting point for further research into factors that affect the P content of milk. Only limited data were available and therefore all data were used for equation development. Evaluation of the equations against an independent dataset is recommended, but is only possible when new data will become available. The present approach is common in this type of modelling, e.g. equations reported by Ellis et al. (Reference Ellis, Kebreab, Odongo, Mcbride, Okine and France2007) were evaluated against independent data 2 years after publication (Ellis et al. Reference Ellis, Kebreab, Odongo, Beauchemin, Mcginn, Nkrumah, Moore, Christopherson, Murdoch, Mcbride, Okine and France2009).
The present analysis also indicates the importance of replacing current fixed requirements of P per unit of milk with requirements of P per unit of milk that depend on milk composition. The meta-analysis of Klop et al. (Reference Klop, Ellis, Bannink, Kebreab, France and Dijkstra2013) showed that P intake was positively related to faecal P excretion. However, if within a dietary P intake level more P is channelled into milk, this will further improve the utilization efficiency of P. For example, when Eqn (8) is applied to the average of the combined dataset (34·7 kg of milk/day, 34·0 g/kg protein and 45·7 g/kg lactose) while assuming a P intake of 80 g/day, the fraction of dietary P retained in milk would be 0·430. However, using a fixed 0·9 g P/kg of milk would result in a utilization efficiency of P for milk production of 0·39. If, for the same milk production, milk protein and lactose were 10 and 5% higher, respectively, the fraction of dietary P retained in milk would increase to 0·482 according to Eqn (8). Such a considerable variation in utilization efficiency of P for milk production also has implications for the environmental impact (faecal P excretion), and therefore prediction tools more accurate than a fixed value of 0·9 g P/kg of milk are required.
Implications
Although it is commonly assumed to be constant, the P content of milk varied considerably in the current database. Variation in milk P content affects the efficiency of P utilization for milk, and it is thus important to understand which factors may explain variation in milk P. In the present work, empirical equations including protein and lactose content of milk as independent variables showed the best relationship with P content of milk, whereas addition of milk fat content to a model already including the effects of protein and lactose had no significant effect on milk P content. Even though a considerable fraction of the observed variation in milk P remained unexplained, future research should focus on further investigation of this relationship. It has also been suggested that seasonal variations in nutrition and temperature may affect milk P content and, as such, these aspects are worth further investigation. The equations derived in the present study may be used as a replacement for the currently recommended fixed value of 0·9 g P/kg milk as they performed better in predicting the observed variation in milk P content.