I. INTRODUCTION
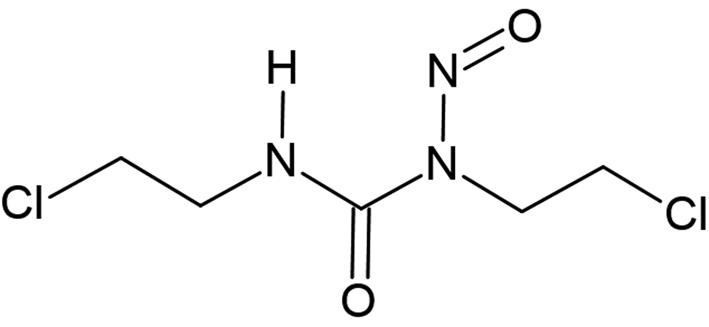
Carmustine (1,3-bis(2-chloroethyl)-1-nitrosourea, C5H9Cl2N3O2, Figure 1, internally called “Carinamustine” due to the name of the first author) is an antineoplastic nitrosourea used in the treatment of several forms of malignant tumors, especially against leukemia and brain tumors (Weiss and Ijssel, Reference Weiss and Ijssel1982; Sarkar et al., Reference Sarkar, Karmakar, Bhattacharyya, Purkait and Mukherjee2015; Wang et al., Reference Wang, Liu, Hu and Xue2017). Carmustine belongs to the nitrosoureas which have the cytotoxic effect of alkylating of the DNA and therefore can decelerate the growth of cancer cells by inhibiting the vital processes such as replication, transcription, and translation of DNA (Hadidi et al., Reference Hadidi, Shiri and Norouzibazaz2019). Since carmustine is highly lipophilic and has a low molecular weight, it easily crosses the blood–brain barrier (Faria et al., Reference Faria, Teleschi, Teodoro and Almeida2021).
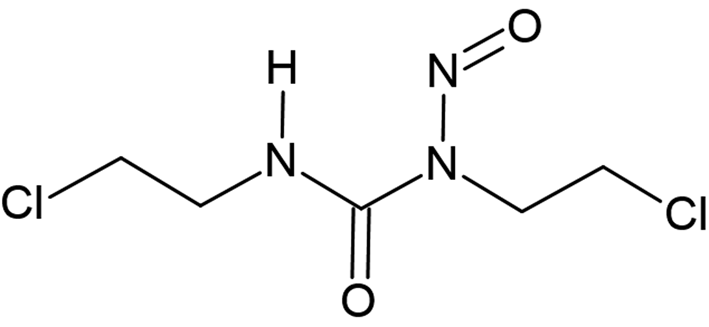
Molecular diagram of carmustine.
Carmustine itself is an orange-yellowish powder with a melting point of 304 K. The crystal structure was solved and refined from low-temperature powder diffraction data.
II. EXPERIMENTAL
A. Sample preparation
Carmustine was purchased from Sigma-Aldrich (purity ≥ 98%) and used without further purification or recrystallization.
B. X-ray powder diffraction and data preparation
For the X-ray powder diffraction measurements, the sample was filled into a glass capillary with a diameter of 0.7 mm.
X-ray powder data were recorded at 153 K, at 278 K, at 288 K and at room temperature (298 K) in transmission geometry on a STOE-STADI-P diffractometer equipped with a curved Ge (111) primary monochromator and a linear position-sensitive detector, using CuKα 1 radiation (λ = 1.5406 Å). A 2θ range of 2.00°–99.99° with a step size of 0.01° was measured. The software WinXPow (Stoe and Cie, 2005) was used for data collection and reduction.
C. Structure solution and refinement
The X-ray powder data of carmustine measured at 153 K were indexed with the program DICVOL (Boultif and Louër, Reference Boultif and Louër1991). The data were background-corrected using the Chebyshev polynomial as implemented in the program DASH (David et al., Reference David, Shankland, van de Streek, Pidcock, Motherwell and Cole2006). The reflection intensities and their correlations were extracted by a Pawley fit (Pawley, Reference Pawley1981) using the program DASH. The structure was solved by the real-space method using the simulated annealing approach within DASH. The molecular structure was derived from a geometry optimization with the force-field CHARMM (Vanommeslaeghe et al., Reference Vanommeslaeghe, Hatcher, Acharya, Kundu, Zhong, Shim, Darian, Guvench, Lopes, Vorobyov and Mackerell2010). In the simulated annealing, no restrictions were placed on the 13 degrees of freedom. The default settings of DASH with 25 simulated annealing runs, each with 107 iterations, resulted in a reproducible structure solution. The structure candidate exhibiting the best figure of merit had χ 2 values of  $\chi _{{\rm prof}}^2$ = 10.29 and
 $\chi _{{\rm int}}^2$ = 166.05 (for a χ 2-value of the Pawley-fit performed with DASH of 2.90).
This structure was subsequently refined by the Rietveld method using the program TOPAS Academic 4.2 (Coelho, Reference Coelho2018). At first, an additional Pawley fit was performed. The background, described by a Chebyshev polynomial with 20 terms, scale factor, zero-point, lattice parameters, sample parameters, and profile parameters were refined. In the following Rietveld refinement, the atomic positions were refined, too. For the molecular geometry, restraints obtained from the CHARMM force field were applied for bond lengths and bond angles. Preferred orientation was neither observed nor refined. An overall isotropic displacement parameter for all C/N/O atoms was refined. A second isotropic displacement parameter was used for the two chlorine atoms. Hydrogen atoms were included with geometrical restraints and with a displacement parameter 1.2 times larger than that of C/N/O atoms.
In the same way, the crystal structure was again solved and refined from the data measured at 278 K. In this case, the best structure from simulated annealing had figures of merit of  $\chi _{{\rm prof}}^2$ = 55.34 and
 $\chi _{{\rm int}}^2$ = 1581.57 for a χ 2-value of the Pawley-fit performed with DASH of 2.50.
III. RESULTS
At room temperature, the investigated commercial sample of carmustine is a deliquescent to papescent pulp or slurry, which is difficult to handle. The sample was amorphous and did not show any Bragg reflections, neither at room temperature (298 K), nor at 288 K (15 °C). At 278 K (5 °C), the sample was crystalline.
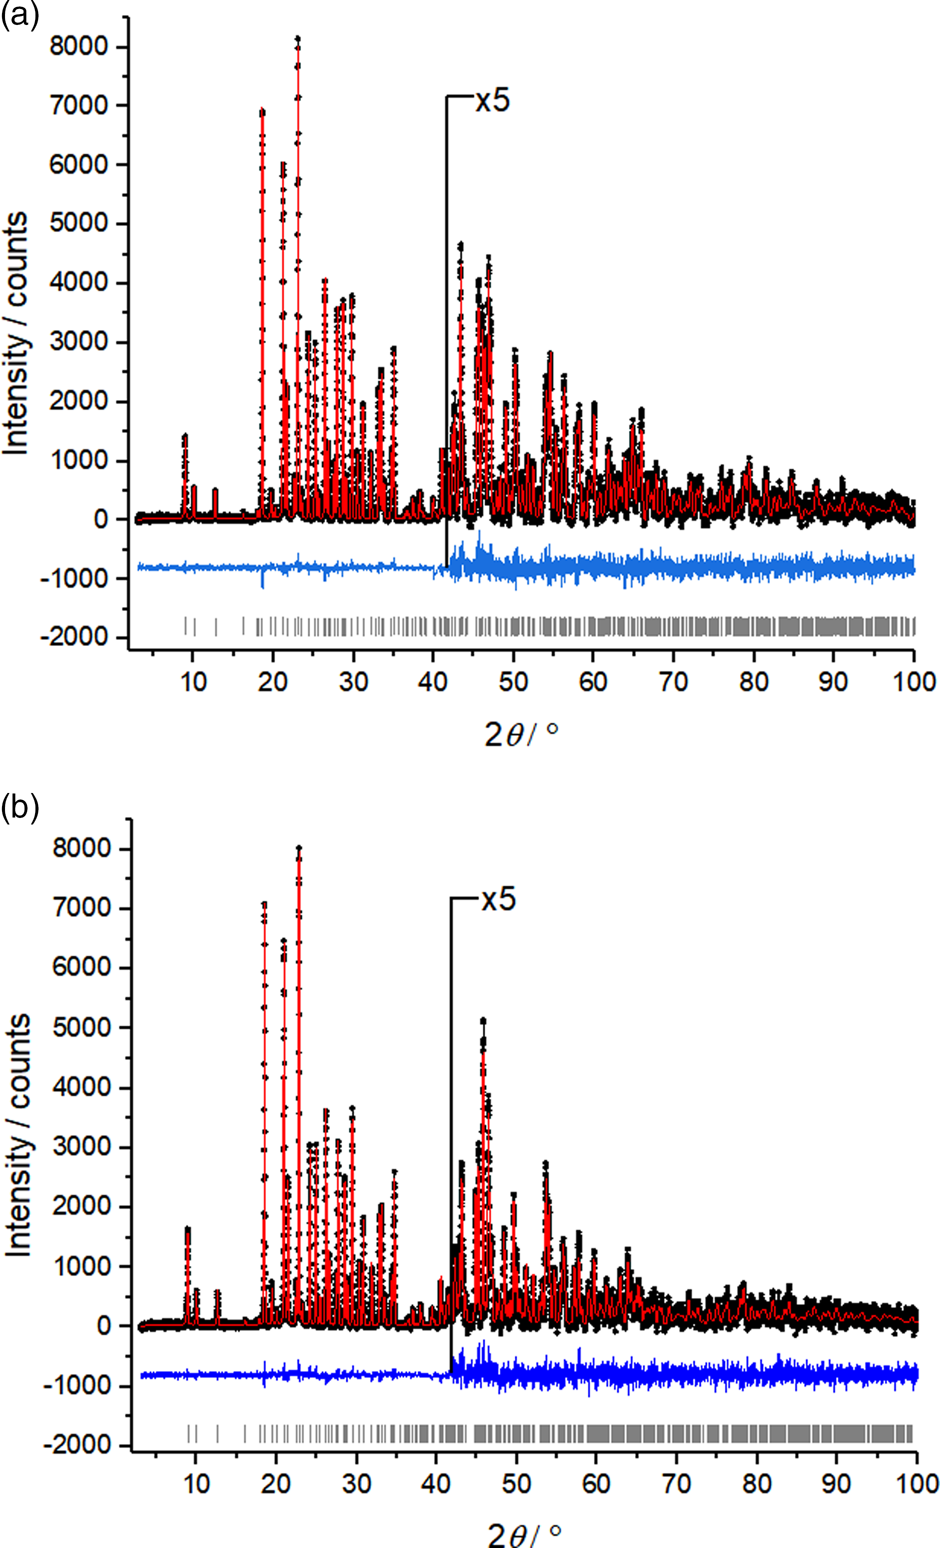
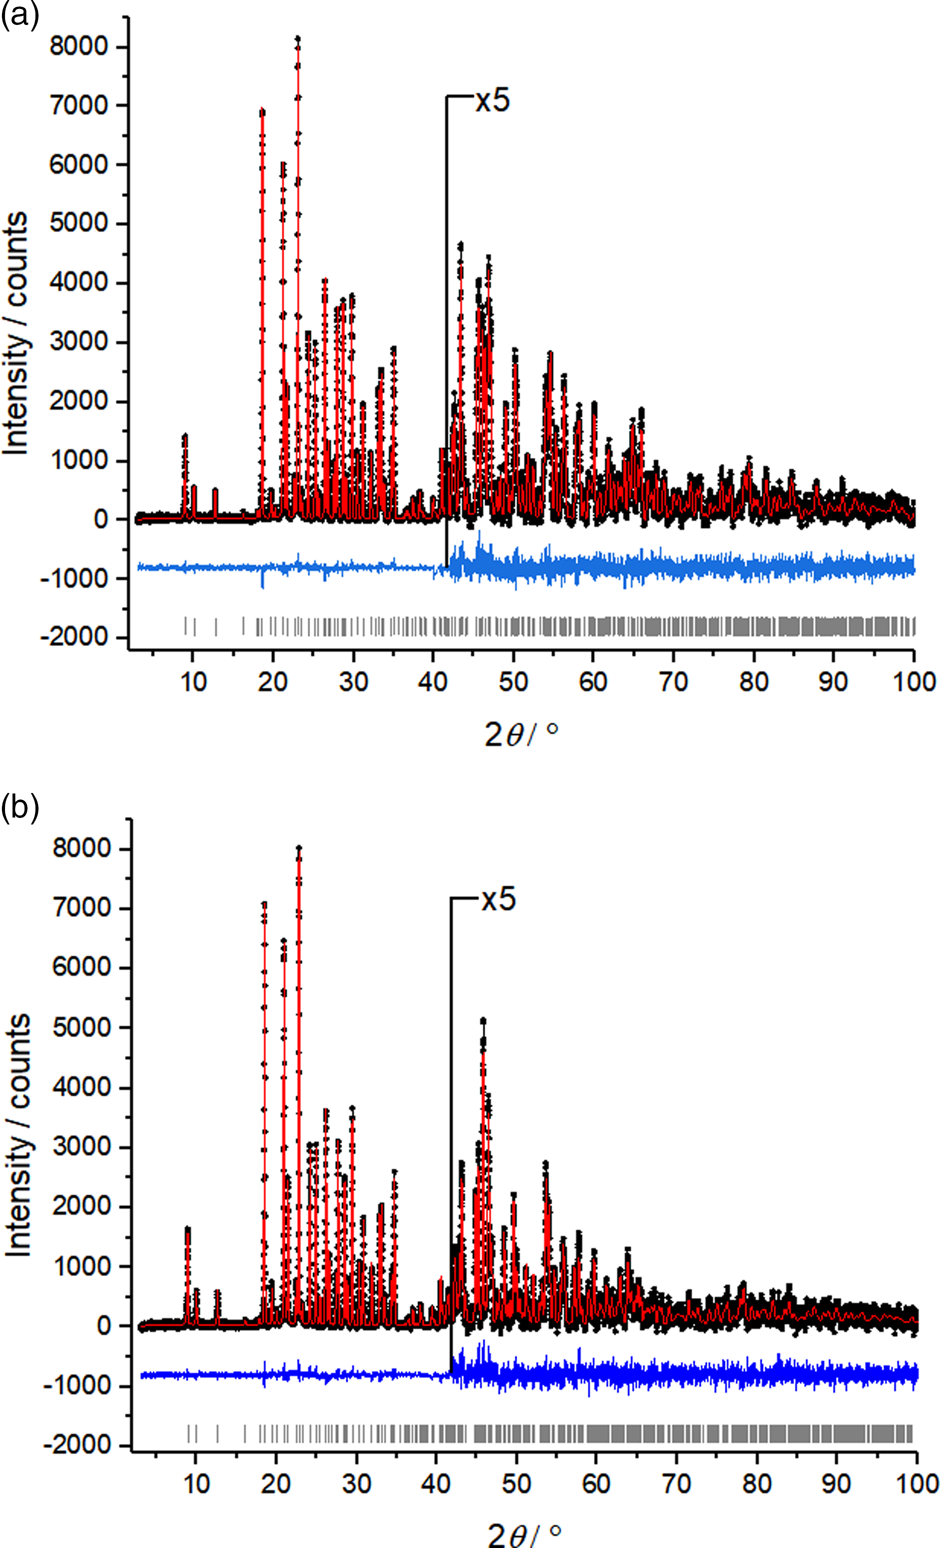
The crystal structure of carmustine was successfully determined from laboratory X-ray powder data recorded at 153 K and at 278 K. The crystallographic data are shown in Table I. The Rietveld refinements converged with excellent R values, as well as low GOF values. For the 153 K data set, the GOF was 1.069 – only 0.002 higher than the GOF of the Pawley fit with TOPAS and close to the ideal value of 1.0. The difference curves between experimental and calculated powder data are remarkably smooth for the 153 K data set, as well as for the 278 K data set (Figure 2).
Rietveld plots of carmustine. (a) Data measured at 153 K and (b) data measured at 278 K. Observed intensities are denoted as black dots; calculated intensities as a red line, the difference curve below in blue, and vertical ticks represent the reflection positions.
Crystallographic data of carmustine at different temperatures.
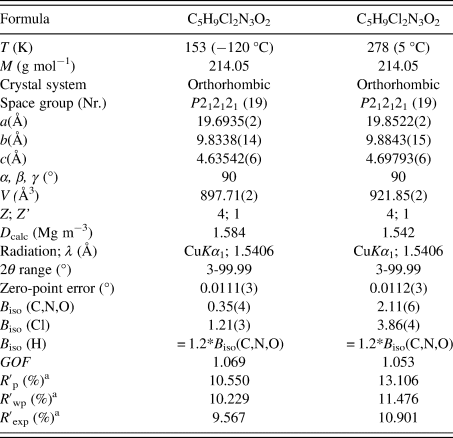
a These values are background-corrected.
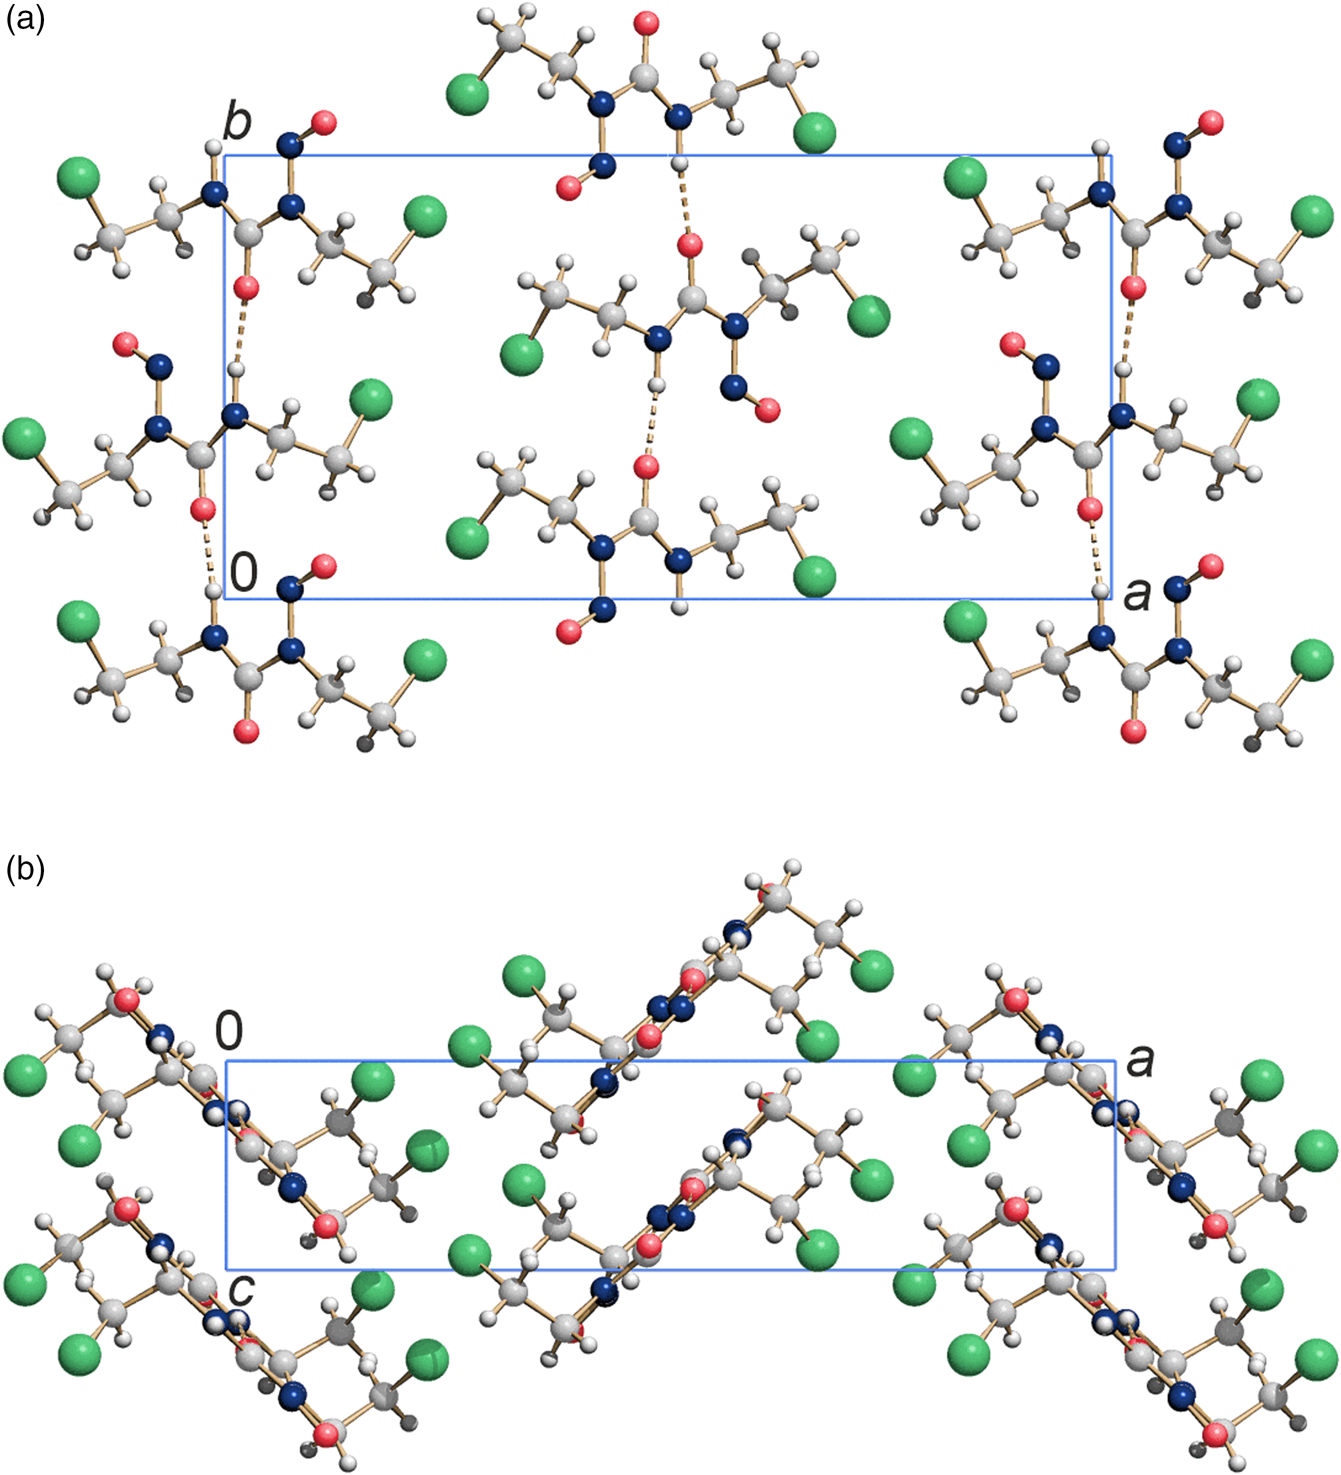
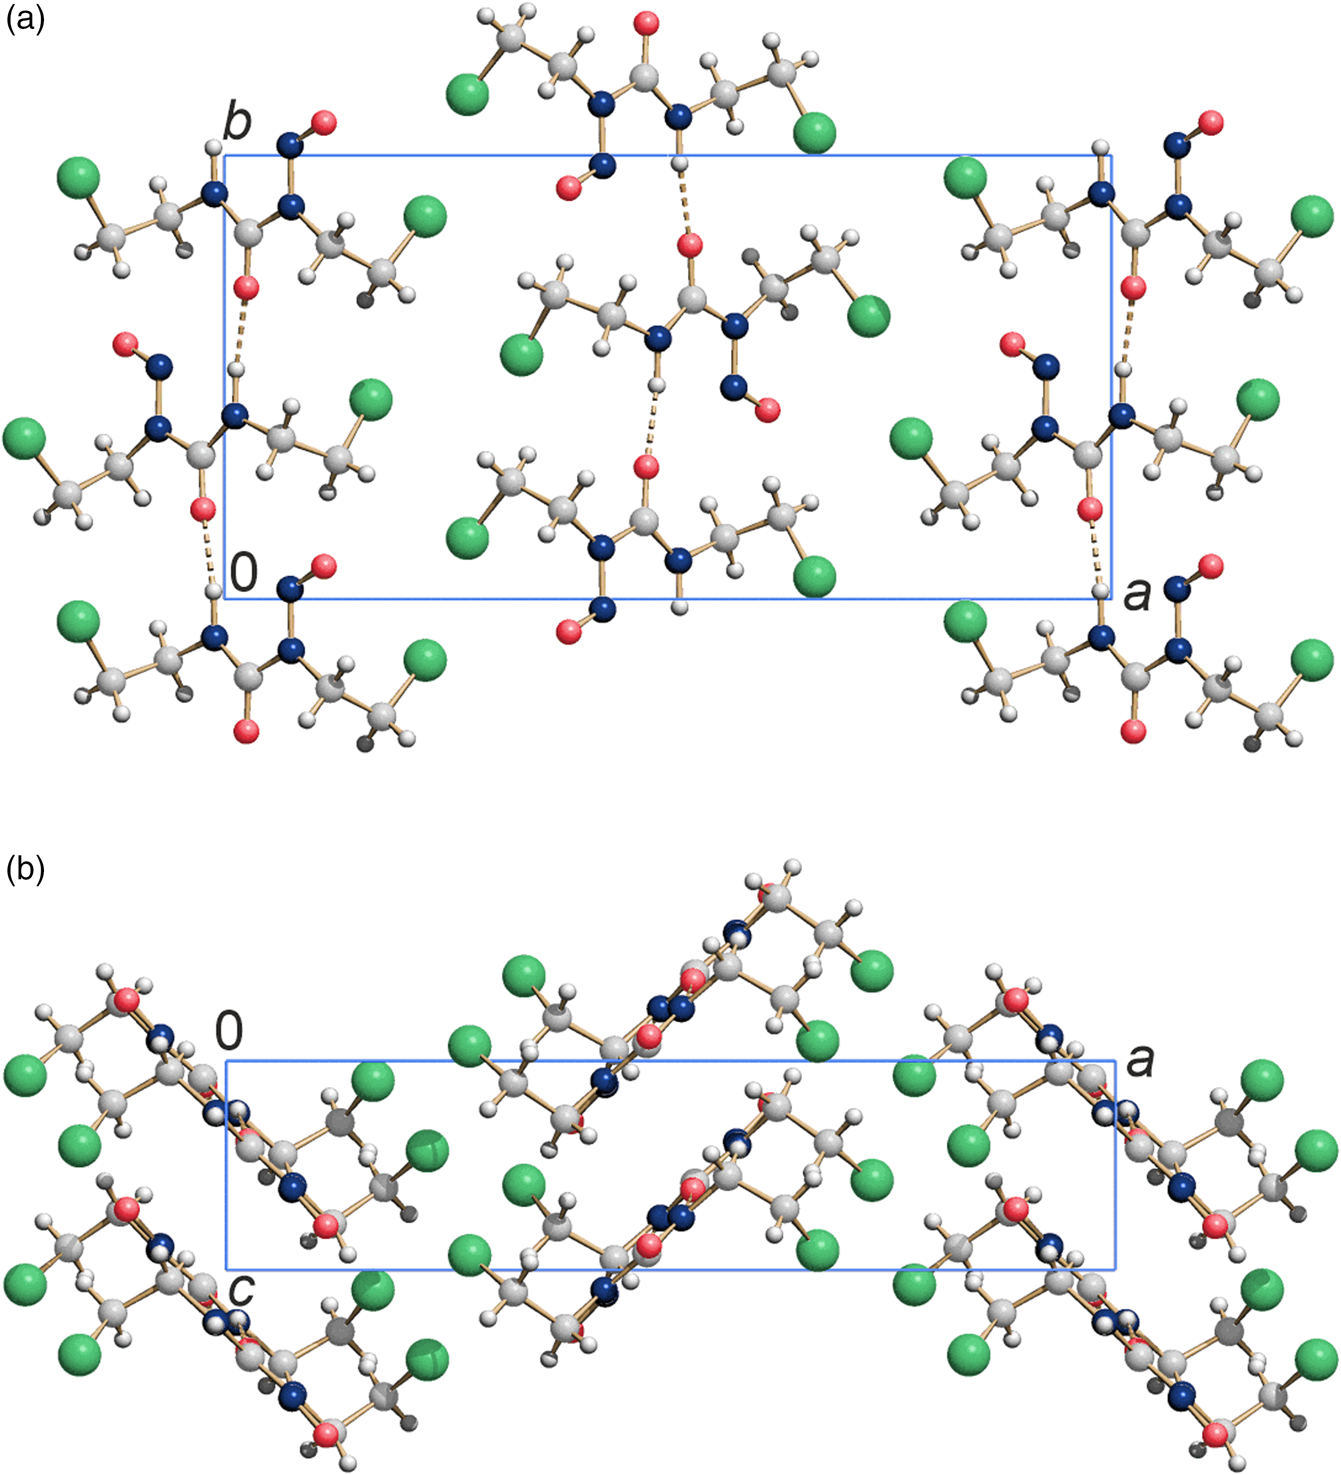
The resulting crystal structure is chemically sensible and exhibits no voids or intermolecular distances that are too close. The bond lengths, bond angles, and torsions angles of carmustine are in good agreement with average values in the Cambridge Structural Database, checked by Mogul (Bruno et al., Reference Bruno, Cole, Kessler, Luo, Motherwell, Purkis, Smith, Taylor, Cooper, Harris and Orpen2004). The molecules are connected by hydrogen bonds and form a chain along the crystallographic b-axis [Figure 3(a)]. Neighboring chains are space efficiently stacked along the c-direction, resulting in a sheet parallel to  $( {1 0 0} )$, see Figure 3(b). These sheets are stacked along
 $[ {1 0 0} ]$ and form a dense packing. The Cl atoms of one sheet fill the gaps between the oxygen and chlorine atoms of the neighboring sheet, see Figure 3(a). The intermolecular interactions Cl⋯Cl with a distance of 3.683 Å, and Cl⋯O with a distance of 3.313 Å (at 153 K) are van der Waals interactions. The Cl⋯Cl contacts with angles of θ(C–Cl⋯Cl) = 160.6° and θ(Cl⋯Cl–C) = 111.4° (at 153 K) are of type II (Sakurai et al., Reference Sakurai, Sundaralingam and Jeffrey1963; Gilday et al., Reference Gilday, Robinson, Barendt, Langton, Mullaney and Beer2015). The structure at 278 K is very similar to the structure at 153 K.
Crystal structure of carmustine at 153 K. (a) View direction  $[ {0 0 1} ]$ and (b) view direction
 $[ {0 1 0} ]$. Colour code: C light gray, O medium red, N dark blue, H small white, Cl large green spheres.
IV. DATA DEPOSITION
The crystallographic data of carmustine are deposited as a crystallographic information file (CIF), including the background-corrected experimental powder profiles, in the Cambridge Structural Database (CSD) with the deposition number 2059041 (153 K data) and 2070329 (278 K data). The original raw data measured at 153 K and 278 K are deposited as files Carmustine_153K_powder_data.xye and Carmustine_278K_powder_data.xye with the ICDD. The data files can be requested at info@icdd.com.
ACKNOWLEDGEMENTS
The authors are grateful to Lukas Tapmeyer (Goethe University, Frankfurt) for his support with the sample preparation. C. S. acknowledges a grant of the Fonds der Chemischen Industrie.