INTRODUCTION
Type 1 diabetes (T1D) is an endocrine disorder with typical onset in mid-childhood through early adolescence, characterized by the inability to produce insulin leading to abnormally high blood glucose levels. Treatment requires exogenous administration of insulin. Failure to maintain blood glucose levels within a normative range can lead to life-threatening complications (Nathan, Reference Nathan2014) and potentially permanent structural changes in the brain, which in turn lead to cognitive declines (e.g., Zihl, Schaaf, & Zillmer, Reference Zihl, Schaaf and Zillmer2010). These changes result from iatrogenic hypoglycemia and seizures (Blasetti et al., Reference Blasetti, Chiuri, Tocco, Di Giulio, Mattei, Ballone and Verrotti2011) and from hyperglycemia-related micro- and macrovascular changes (Bade-White & Obrzut, Reference Bade-White and Obrzut2009; Cato et al., Reference Cato, Mauras, Ambrosino, Bondurant, Conrad, Kollman and Hershey2014). To prevent these complications, good glycemic control (i.e., maintenance of blood glucose within a relatively narrow range) is a key goal of T1D management.
Glycemic control relies on adherence to a complex regimen of frequent blood glucose checks, administration of insulin, calculation and management of carbohydrate intake, and exercise (Hood, Peterson, Rohan, & Drotar, Reference Hood, Peterson, Rohan and Drotar2009). Given the complexity of this regimen and the young age at which most patients are diagnosed, parents are typically heavily involved in the management of their children’s illness (Ellis et al., Reference Ellis, Podolski, Frey, Naar-King, Wang and Moltz2007). However, this parental involvement tends to decline throughout adolescence and young adulthood (Wiebe et al., Reference Wiebe, Chow, Palmer, Butner, Butler, Osborn and Berg2014); in turn, this decrease in involvement appears to relate to declines in adherence and concomitant glycemic dysregulation (Hanna et al., Reference Hanna, Weaver, Stump, Di Meglio, Miller, Crowder and Fortenberry2013; King et al., Reference King, Berg, Butner, Drew, Foster, Donaldson and Wiebe2012). Late adolescence and emerging adulthood is particularly challenging for diabetes management as individuals are often expected to transfer from pediatric care to adult care when they reach 18 years of age, and may move away from home to go to college or enter the workforce. Thus, for patients with T1D, the transition from late adolescence into young adulthood is particularly challenging (Clements et al., Reference Clements, Foster, Maahs, Schatz, Olson, Tsalikian and Chen2016).
There are individual differences in the degree to which patients succeed in maintaining glycemic control during this critical period: Whereas most patients exhibit only a modest deterioration in glycemic control (Hilliard, Harris, & Weissberg-Benchell, Reference Hilliard, Harris and Weissberg-Benchell2012; King et al., Reference King, Berg, Butner, Drew, Foster, Donaldson and Wiebe2012; Luyckx & Seiffge-Krenke, Reference Luyckx and Seiffge-Krenke2009), a smaller subset experience an extreme dysregulation accompanied by chronic hyperglycemia (Hilliard, Wu, Rausch, Dolan, & Hood, Reference Hilliard, Wu, Rausch, Dolan and Hood2013; King et al., Reference King, Berg, Butner, Drew, Foster, Donaldson and Wiebe2012; Luyckx & Seiffge-Krenke, Reference Luyckx and Seiffge-Krenke2009). This subset often reaches levels of hyperglycemia that place them at risk for hospitalizations or emergency room visits (King et al., Reference King, Berg, Butner, Drew, Foster, Donaldson and Wiebe2012) and for cerebral structural and functional changes (Ryan, Reference Ryan2006, Reference Ryan2008). Although some teens are known to be at risk for extreme dysregulation due to long-standing history of poor adherence, others “fly under the radar” due to good glycemic control while under their parents’ supervision. Thus, identifying factors that characterize patients at risk for extreme glycemic dysregulation during this time is an important topic of research (Bagner, Williams, Geffken, Silverstein, & Storch, Reference Bagner, Williams, Geffken, Silverstein and Storch2007).
One such factor is a deficiency in the ability to make adaptive decisions in daily life. From a neurocognitive standpoint, this ability is known as emotional decision-making (EDM), a neurocognitive capacity linked to the integrity of the prefrontal cortices, and to some aspects of emotional and executive functioning (for review see Coutlee & Huettel, Reference Coutlee and Huettel2012; Suchy Reference Suchy2011, pp. 176–203). Importantly, executive deficiencies are becoming increasingly recognized as potential contributors to poor adherence and glycemic dysregulation (Duke & Harris, 2014; Suchy et al., Reference Suchy, Turner, Queen, Durracio, Wiebe, Butner and Berg2016). For instance, results from the current sample indicate that executive functioning is associated with both glycemic control and self-reported adherence (Suchy et al., Reference Suchy, Turner, Queen, Durracio, Wiebe, Butner and Berg2016).
A key feature of EDM is the capacity for making choices that are congruent with adaptive goals in the face of competing reward and punishment contingencies. Deficient EDM has been implicated as a contributing factor in adherence failures among various clinical populations, including individuals suffering from alcoholism and drug abuse (De Wilde, Verdejo-García, Sabbe, Hulstijn, & Dom, Reference De Wilde, Verdejo-García, Sabbe, Hulstijn and Dom2013), obesity and binge eating (Danner, Ouwehand, Haastert, Hornsveld, & Ridder, Reference Danner, Ouwehand, Haastert, Hornsveld and Ridder2012), anorexia nervosa (Tchanturia et al., Reference Tchanturia, Liao, Forcano, Fernández‐Aranda, Uher, Treasure and Jiménez‐Murcia2012), smoking (Xiao, Koritzky, Johnson, & Bechara, Reference Xiao, Koritzky, Johnson and Bechara2013), and unhealthy diet (Ames et al., Reference Ames, Kisbu-Sakarya, Reynolds, Boyle, Cappelli, Cox and Stacy2014). The relevance of these findings for management of T1D is self-evident, leading some to advocate for the examination of EDM as a potential contributor to T1D adherence failures (Rustad et al., Reference Rustad, Musselman, Skyler, Matheson, Delamater, Kenyon and Nemeroff2013). Importantly, while EDM weaknesses may place one at risk for poor adherence and concomitant poor glycemic control, glycemic dysregulation in turn leads to further declines in cognition (e.g., Zihl et al., Reference Zihl, Schaaf and Zillmer2010).
The most common method for assessment of EDM is the Iowa Gambling Task (IGT; Bechara, Reference Bechara2007; Bechara, Damasio, Tranel, & Damasio, Reference Bechara, Damasio, Tranel and Damasio2005), a task in which examinees choose cards from four virtual decks with the goal of maximizing winnings. While some decks are advantageous, yielding the long-term accumulation of modest winnings, others are disadvantageous, yielding occasional large winnings accompanied by even larger losses. Although the utility of IGT for assessment of EDM has been demonstrated (Bechara, Reference Bechara2007), the best approach to scoring and interpretation is less clear (Gansler, Jerram, Vannorsdall, & Schretlen, Reference Gansler, Jerram, Vannorsdall and Schretlen2011; Steingroever, Wetzels, Horstmann, Neumann, & Wagenmakers, Reference Steingroever, Wetzels, Horstmann, Neumann and Wagenmakers2013). There is disagreement about which blocks of trials should be included in the final score (Bechara, Tranel, & Damasio, Reference Bechara, Tranel and Damasio2000; Buelow & Suhr, Reference Buelow and Suhr2009; Dunn, Dalgleish, & Lawrence, Reference Dunn, Dalgleish and Lawrence2006; Roca et al., Reference Roca, Torralva, López, Cetkovich, Clark and Manes2008; Torralva, Roca, Gleichgerrcht, Bekinschtein, & Manes, Reference Torralva, Roca, Gleichgerrcht, Bekinschtein and Manes2009) and the potential utility of profiles of scores across test blocks (Bechara, Reference Bechara2007; Steingroever et al., Reference Steingroever, Wetzels, Horstmann, Neumann and Wagenmakers2013).
The purpose of this study (which was a part of a larger longitudinal project) was twofold. First, we aimed to determine whether IGT performance assessed in the senior year of high school (i.e., at “baseline”) among patients with T1D would prospectively predict changes in glycemic control 1 year later (i.e., at “follow-up”). Second, we aimed to determine which of four IGT scoring/interpretation approaches would be most valuable for prospective identification of individuals at risk for extreme metabolic dysregulation. We hypothesized that teens with impaired IGT performance at baseline would exhibit deterioration in glycemic control at follow-up. We had no hypothesis regarding the best scoring approach, as past research has not examined IGT in this population.
METHODS
Participants
Participants included 241 high-school seniors (147 females, 94 males) diagnosed with T1D, recruited during their outpatient pediatric endocrinology clinic visit in 2 southwestern cities. As part of a larger longitudinal study, qualifying participants had to (a) be in senior year of high school, (b) use English as their primary language, and (c) be free of physical or psychiatric conditions that would prohibit study completion (e.g., intellectual disability, blindness, etc.), based on review of medical records.
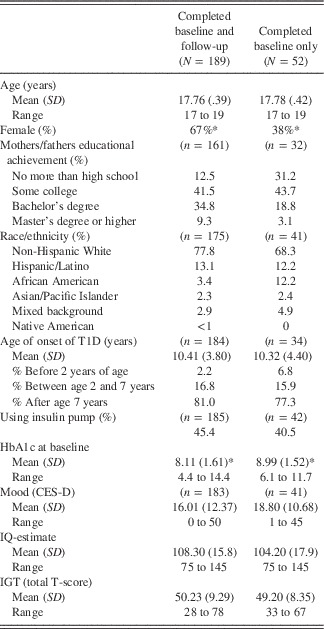
Of the qualifying 507 individuals approached, 247 were enrolled in the study, with 241 having complete data on the EDM task. From among the initial 241 participants, 191 (79%) completed follow-up measures 1 year later. From among these, 2 were removed due to extreme values on a measure of sustained attention (casting doubt on the validity of their cognitive data), leaving 189 participants. All principal analyses required follow-up data and thus were conducted on these 189 participants. Preliminary analyses that were conducted for the purposes of empirically determining different profiles of IGT performance at baseline used the entire sample of 241 to maximize power. Demographic, clinical, and cognitive characteristics of participants are in Table 1. Participants who did not complete follow-up measures (also shown in Table 1) had poorer baseline glycemic control (t=3.69; df=225; p<.001) and were more likely to be male compared to those who completed follow-up measures (Chi-Square=13.32; p<.001), but were comparable on other demographic, cognitive, and clinical variables (all p values>.188).
Demographic, clinical, and cognitive characteristics of the sample at baseline

Note. * p<.05. For variables with missing data, relevant sample sizes with full data are reported in parentheses in respective columns.
IGT=Iowa Gambling Task; HbA1c= glycated hemoglobin (blood glucose); CES-D= Center for Epidemiology Studies-Depression (score of 16 or more is considered depressed); T1D=type 1 diabetes.
Measures
General cognition and mood
To help characterize the sample, we administered the Vocabulary subtest from the Wechsler Adult Intelligence Scale, 4th edition (Wechsler, Reference Wechsler2008) as an estimate of crystallized intelligence (referred to as “IQ-est” below), and the Center for Epidemiologic Studies Depression (CES-D) scale (Hann, Winter, & Jacobsen, Reference Hann, Winter and Jacobsen1999).
Glycemic control
Glycemic control was measured via HbA1c, which indicates the levels of glycated hemoglobin (or average blood glucose) over the previous 2 to 3 months. It represents the gold standard for indexing medical management of T1D. At both baseline and follow-up, we measured HbA1c using mail-in assay kits acquired from and processed by CoreMedica Laboratories (www.coremedica.net; accredited by the College of American Pathologists). The HbA1c values from the mail-in assay kits were correlated with HbA1c obtained from point-of-care assays in medical records at baseline (r=.74; p<.001), but showed average values .5 lower than the point-of-care assaysFootnote 1 . We opted for using the mail-in kits, as opposed to point-of-care assays, because many patients in this age group are lost to medical follow-up as they transfer from pediatric to adult care. To characterize changes in glycemic control, we used HbA1cBaseline and HbA1cFollow-up as principal variables of interest.
Emotional decision making
The Iowa Gambling Task (IGT) is a computer administered task that takes approximately 15 to 20 minutes to administer. Participants are presented with four decks of cards on the computer screen, face down, and $2000 of gambling credit. Participants are to select cards from the decks, with the object of winning as much money as possible. Once a card is selected, the computer screen provides information about whether the selection resulted in a win or a loss, and about the overall winnings or losses. Two of the four decks are “advantageous,” resulting in overall winnings, and two are “disadvantageous,” resulting in overall losses. However, the advantageous decks initially appear unrewarding, as winnings are small, while the disadvantageous decks initially appear rewarding, as the occasional winnings are large. Individuals with intact EDM eventually learn to avoid the disadvantageous decks, whereas individuals with impaired EDM continue to be drawn to the large winnings of the disadvantageous decks. Overall, there are 100 trials, divided into five blocks of 20.
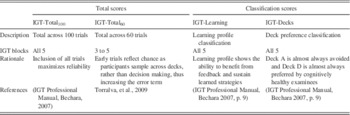
Given the disagreement in the literature about how to best quantify the overall IGT performance (Gansler et al., Reference Gansler, Jerram, Vannorsdall and Schretlen2011; Steingroever et al., Reference Steingroever, Wetzels, Horstmann, Neumann and Wagenmakers2013), two general types of scores were generated: (1) The “total” IGT scores, and (2) the “classification” scores. As illustrated in Table 2, for each of the two score types, two approaches were examined. The total scores were (a) the demographically corrected T-score (per test manual)Footnote 2 reflecting selection of cards from the advantageous versus the disadvantageous decks across all 100 trials, referred to below as “IGT-Total100”, and (b) the mean of the three demographically corrected T-scores (per test manual) from blocks 3 through 5 (i.e., a total of 60 trials), as recommended in the literature (Bechara et al., Reference Bechara, Tranel and Damasio2000; Roca et al., Reference Roca, Torralva, López, Cetkovich, Clark and Manes2008; Torralva et al., Reference Torralva, Roca, Gleichgerrcht, Bekinschtein and Manes2009), referred to below as “IGT-Total60”.
Overview of the IGT variables used in analyses

Note. IGT=Iowa Gambling Task.
The internal consistency reliabilities (Chronbach’s Alpha) for IGT-Total100 and IGT-Total60 in this sample were .662 and .801, respectively. The two classification scores were defined as membership in empirically generated classes characterized by (a) learning profile across the five blocks of 20 trials each, referred to below as “IGT-Learning,” and (b) deck preference profile, referred to below as “IGT-Decks.” Classes were generated using Latent Class Analysis (see Results for details). See Table 2 for an overview.
Procedures
The study was approved by the appropriate Institutional Review Boards. During lab visits, participants provided consent/assent, completed a brief battery of neurocognitive measures including the IGT, underwent HbA1c testing, and received instructions for a subsequent on-line survey about issues relevant for T1D management. Because extreme hyper- and hypoglycemia can affect cognitive performance (Desrocher & Rovet, Reference Desrocher and Rovet2004), current blood glucose levels were checked before cognitive testing. If blood glucose levels were outside the range of 75 to 400, participants took steps to normalize blood glucose (e.g., get a snack or insulin); if blood glucose was not brought into range within 1 hr, testing was rescheduled. Blood glucose levels were unrelated to cognitive performances (all r values <.13), indicating these procedures were effective at limiting the impact of current blood glucose on performance. Participants were paid $50. One year later, participants were invited to complete a second online survey and HbA1c assay, for which they were paid $50.
RESULTS
Preliminary Analyses
Multiple imputations
For several key variables, baseline data were missing on 2% of the original sample (five baseline HbA1c values, four IGT scores, and six Vocabulary scores). Missingness was caused by random administrative/procedural errors. To account for missing baseline data, we used a combination of full information maximum likelihood (for the growth mixture-modeling) and multiple imputation (for all other analyses), running the analyses on the full set of the 241 original participants. Both techniques are efficient at handling missingness when data are missing at random (Graham, Reference Graham2009). For the multiple imputation procedure, we generated five data sets and the reported results are pooled from the results of each file. Across all analyses, the lowest efficiency was .922, suggesting that the five data files adequately recovered the missing data. No data were missing for follow-up, as only participants with no missing follow-up data were included. This was done because HbA1c was the only follow-up variable examined in this study, and imputation of HbA1c values using the baseline data could artificially inflate findings.
Latent class analyses
To determine whether different performance profiles related to changes in glycemic control, we first needed to identify profiles that were present among meaningful subsets (or “classes”) of participants. To identify these classes of participants, we used mixture-modeling in two ways. First, we identified IGT learning profiles across five blocks of 20 IGT trials each, using growth mixture-modeling (linear growth where variance components were equated across classes). Second, we identified classes of preferences across the four IGT card decks (allowing classes to differ in their means). For both sets of analyses, the number of classes was increased for each iteration and was determined by comparing the k class model to the k −1 model.
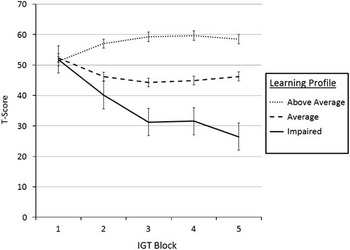
We used the Lo-Mendell-Rubin adjusted likelihood ratio test (LMR) to determine the number of classes (Asparouhov & Muthén, Reference Asparouhov and Muthén2012). The model with the most latent classes and significant LMR was identified as the best model. We specified each model to include 1000 random start values with a maximum of 500 iterations to help account for local minima. As a reminder, these analyses were conducted on the original sample of 241 participants who completed baseline assessmentFootnote 3 . The analyses of learning trajectories identified three latent classes (LMR 3 classes =52.73; p=.002). The solution with four latent classes had poor fit (LMR 4 classes =−4366.21; p=.5). The three classes were labeled “above average” (n=78), “average” (n=150), and “impaired” (n=11). See Figure 1.
Learning profiles across the five Iowa Gambling Task (IGT) blocks, empirically generated using latent class mixture-modeling. Sample sizes for the above average, average, and impaired groups were 78, 150, and 11, respectively.

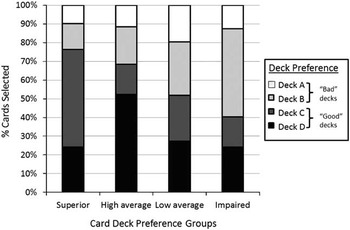
The mixture model examining deck preferences identified four latent classes (LMR 4 classes =142.70; p=.004; LMR5 classes=−3310.67; p=.99). Two of these classes demonstrated good performance, with preferences for decks C and D, and were designated as “High Average” (n=58) and “Superior” (n=20), based on their IGT-Total100 averages of 58.52 and 64.38, respectively. The remaining two classes exhibited poorer performance with preferences for decks A and B, and were designated as “Low Average” (n=127) and “Impaired” (n=36), based on their IGT-Total100 averages of 46.79 and 38.44, respectively. Figure 2 shows percentages of cards taken from each deck by members of the four latent classes.
Participant groups with different deck preferences across the four Iowa Gambling Task (IGT) decks of cards, generated by latent class modeling. Group labels (superior, high average, low average, and impaired) are based on overall performance on the IGT. According to the IGT test manual, most healthy participants avoid Deck A almost completely, and show strong preference for Deck D. As seen, in the present sample, in contrast to the test manual, the best performance was not associated with the strongest preference for Deck D. Also, the group that has the least tendency to avoid Deck A (i.e., the low average group) did not exhibit the poorest performance overall. Thus, adolescents may exhibit slightly different deck preference profiles than adults who comprised the normative sample. Sample sizes for the superior, high average, low average, and impaired groups are 20, 58, 127, and 36, respectively.

Zero order correlations
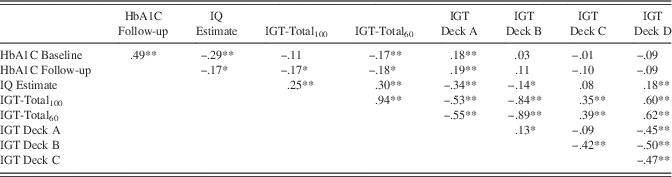
Table 3 shows zero order correlations among HbA1c values and cognitive measures. As seen, HbA1cBaseline and HbA1cFollow-up were significantly correlated. Additionally, consistent with our prior findings (Suchy et al., Reference Suchy, Turner, Queen, Durracio, Wiebe, Butner and Berg2016), HbA1cBaseline correlated with IQ-est. Small correlations emerged between HbA1cFollow-up and IQ-est, and between the two IGT-Total scores and percentages of cards taken from Deck A (the most disadvantageous deck).
Zero order correlations among HbA1c values and cognitive measures

Note. HbA1c= glycated hemoglobin (blood glucose); IGT=Iowa Gambling Task.
** p<.01; * p<.05; N=189.
Life changes
At time 1, all participants lived full-time with a parent and attended high school; 38.6% held a job. At time 2, 49.2% reported not living with a parent (2% declined to respond). Additionally, 47.6% reported attending a 4-year college/university, 25.9% community college or technical school, and 2.1% high school (24.3 % declined to respond). Lastly, 53.4% reported holding a job (1% declined to respond).
Principal Analyses
Change in HbA1C as a function of IGT-total scores
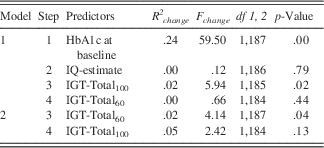
To determine whether IGT performance was associated with change in HbA1c from baseline to follow-up, we conducted a series of hierarchical linear regressions, using HbA1cFollow-up as the dependent variable. On step 1, we entered HbA1cBaseline, to allow determination of whether IGT accounted for the change in HbA1c. On step 2, we entered IQ-est because of its demonstrated association with HbA1c (Table 3). On steps 3 and 4, we entered IGT-Total100 and IGT-Total60, respectively (see Table 4, Model 1). We then repeated this analysis, reversing variable entry on steps 3 and 4 (Table 4, Model 2), pitting the two IGT totals against each other.
Hierarchical linear regressions predicting change in HbA1c from baseline to follow-up

Note. The dependent (criterion) variable is HbA1c at follow-up.
IGT=Iowa Gambling Task; HbA1c= glycated hemoglobin (blood glucose).
As seen in Table 4, HbA1cBaseline accounted for 24.1% of variance in HbA1cFollow-up. IQ-est did not account for additional variance, suggesting that the association between IQ-est and HbA1cFollow-up (Table 3) can be explained by the association between IQ-est and HbA1cBaseline. IGT-Total100 further contributed to the model (Table 4, Model 1, Step 3), as did IGT-Total60 (Table 4, Model 2, Step 3). However, as seen in Steps 4 of Models 1 and 2, the 2 IGT-Total scores did not contribute variance above each other, likely due to the high correlation between them (r=.94; see Table 3).
Together, these findings support the hypothesis that IGT-Total is a predictor of changes in HbA1c as adolescents graduate from high school. Because results failed to favor one IGT-Total variable over the other, it may be prudent to use the variable recommended in the test manual (i.e., IGT-Total100).
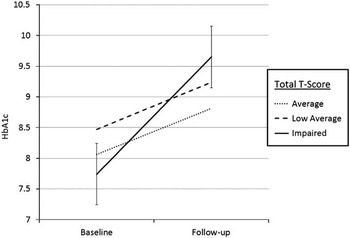
Next, because identification of patients at risk inherently requires that clinicians rely on cutting scores, we examined whether applying the cutting scores recommended for IGT-Total100 in the IGT manual would relate to meaningful changes in HbA1c from baseline to follow-up. To that end, per IGT manual, we divided participants into three groups: (a) “Impaired” (T scores <40; n=17), (b) “below average” (T scores between 40 and 44; n=37), and (c) “non-impaired” (T scores>44; n=135). We then conducted a mixed-model repeated-measures analysis of variance (ANOVA), using HbA1c values as dependent variables, Time (baseline vs. follow-up) as a within-subjects factor, and Group (impaired vs. below average vs. non-impaired) as a between-subjects factor.
The results showed a main effect of Time [F(1,186)=39.50; p<.001] (with HbA1c increasing over time), and a significant Time X Group interaction [F(2,186)=3.27; p=.048] (with the Impaired group exhibiting the greatest glycemic dysregulation over time; Figure 3). Follow-up analyses showed the groups did not differ in HbA1c at baseline (p=.228) or at follow-up (p=.129), suggesting that IGT performance is uniquely related to change in glycemic control. Repeating the analyses with IQ-est as a covariate resulted in the loss of the main effect of Time, but strengthened the Time X Group interaction [F(2,185)=3.64; p=.028]. Lastly, IQ-est was associated with the overall HbA1c [F(1,185)=13.72; p<.001].
HbA1c values (reflecting glycemic control) at baseline and at follow-up for participants divided by their overall performance on the Iowa Gambling Task (IGT), using cutting scores recommended in the test manual. Higher HbA1c values reflect poorer glycemic control over the course of the past 2 to 3 months. Error bars reflect standard error of the mean. Note that the error bars for the low average and average groups were omitted to allow visual appreciation of the change from baseline to follow-up in the impaired group, since error bars among the groups overlap. Sample sizes for average, low average, and impaired groups were 137, 37, and 17, respectively.

Change in HbA1C as a function of IGT learning profiles
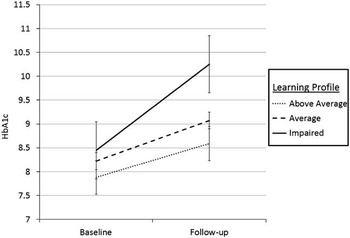
Next, we compared HbA1c of participants with different learning profiles (see the Preliminary Analyses section and Figure 1), again conducting a mixed-model repeated-measures ANOVA with HbA1c values as dependent variables, Time (baseline vs. follow-up) as the within-subjects factor, and IGT-Learning (impaired vs. average vs. above average) as the between-subjects factor. Results failed to reach traditional statistical significance level (alpha=.05) for the main effect of IGT-Learning (p=.052) or for the Time X IGT-Learning interaction (p=.228). Follow-up analyses revealed that although the groups did not differ on HbA1c at baseline (p=.291), the impaired and above-average groups differed from each other at follow-up (p=.011). Including IQ-est as a covariate did not change results. See Figure 4.
HbA1c values (reflecting glycemic control) at baseline and at follow-up for participants divided into groups based on three empirically derived learning profiles across the five Iowa Gambling Task (IGT) blocks. Error bars reflect standard error of the mean. Higher HbA1c values reflect poorer glycemic control over the course of the past 2 to 3 months. Sample sizes for above average, average, and impaired groups were 64, 115, and 10, respectively.

Change in HbA1C as a function of IGT deck preferences
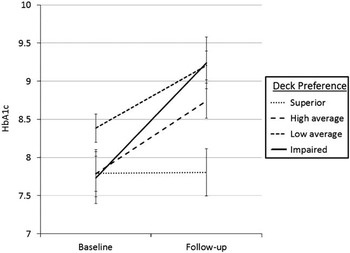
Lastly, we compared participants based on their empirically derived deck preferences (see Preliminary Analyses and Figure 2). We again conducted a mixed-model repeated-measures ANOVA, using HbA1c as dependent variables, Time (baseline vs. follow-up) as the within-subjects factor, and IGT-Decks (superior vs. high average vs. low average vs. impaired) as the between-subjects factor. The results again failed to reach statistical significance for main effect of IGT-Decks [F(3,185)=2.57; p=.056]. Of note, the best group appeared to exhibit a remarkable stability in HbA1c across time (Figure 5), being the only group that did not deteriorate; however, this apparent Time X IGT-Decks interaction failed to reach statistical significance (p=.102). Once again, follow-up analyses showed no group differences in HbA1c at baseline (p=.189), but the superior group exhibited better glycemic control at follow-up relative to the low average (p=.008) and the impaired (p=.017) groups. Including IQ-est as a covariate did not change results.
HbA1c values (reflecting glycemic control) at baseline and at follow-up for participants divided into groups based on four empirically derived learning profiles across the five Iowa Gambling Task (IGT) blocks. Error bars reflect standard error of the mean. Higher HbA1c values reflect poorer glycemic control over the course of the past 2 to 3 months. Sample sizes for superior, high average, low average, and impaired groups were 16, 50, 94, and 29, respectively.

Supplementary Analyses
We repeated all principal analyses with pump status in the model; results remained unchanged, and pump status did not contribute to change in HbA1c. Similarly, we examined living with a parent versus living elsewhere, and holding a job versus not holding a job, as covariates in principal analyses; again, contribution of IGT to changes in glycemic control remained unchanged. Furthermore, holding a job was associated with a somewhat greater decline in glycemic control beyond other variables in the model (β=.247, p<.029), although living situation did not independently contribute to changes in HbA1c. Because a large subset of participants failed to respond to the question about school (24%), we did not examine the impact of this variable in analyses.
DISCUSSION
This study investigated whether EDM, assessed via the Iowa Gambling Task (IGT) during the senior year of high school, would prospectively predict changes in glycemic control (i.e., HbA1c) among teens with T1D 1 year later. Additionally, because of the considerable disagreement in the literature about the best method for interpreting IGT performance, this study examined the utility of four interpretive/scoring approaches suggested in the test manual and in the literature. The results showed that IGT indeed related to changes in HbA1c across time, with the total score across all test trials (IGT-Total100) proving to be the best predictor relative to learning profiles. Specifically, as seen in Figure 3, patients whose IGT-Total100 was in the mildly impaired range or below exhibited on average an elevation in HbA1c of approximately 2 percentage points, increasing from an acceptable range of 7.7% to an unhealthy range of 9.7% (Ying et al., Reference Ying, Lairson, Giardino, Bondy, Zaheer, Haymond and Heptulla2011), representing a highly clinically significant change.
In contrast, those whose IGT-Total100 scores were within the normal range (i.e., low average and above) exhibited an average increase in HbA1c that was more modest, .7 percentage points, although still clinically significant. These findings held even after controlling for IQ, pump status, employment status, or living situation.
There are good reasons for why EDM is particularly relevant for glycemic control among adolescents. EDM relies on one’s ability to appropriately register and respond to negative or punishing feedback, while at the same time refraining from pursuing rewards associated with high-risk outcomes. For example, EDM comes into play when patients face choosing between checking their blood glucose (i.e., avoiding the punishing consequences of glycemic dysregulation) vs. spending time with friends instead of checking blood glucose (i.e., pursuing high-risk rewards). Thus, emotionally laden choices are par for the course in managing T1D, and good EDM skills may undergird better diabetes-management decisions that result in better glycemic control.
Additionally, while deficiencies in EDM have likely ramifications for all T1D patients, they are particularly relevant for adolescents, who are known to exhibit heightened sensitivity to rewards (Cauffman et al., Reference Cauffman, Shulman, Steinberg, Claus, Banich, Graham and Woolard2010). To make matters worse, adolescents’ neuroanatomic substrates of EDM are not yet fully mature (Stuss, Reference Stuss1992), making them more vulnerable to becoming derailed by the presence of rewarding stimuli (Weigard, Chein, Albert, Smith, & Steinberg, Reference Weigard, Chein, Albert, Smith and Steinberg2014). To counter-balance these high reward sensitivities, good sensitivity to punishment (which is a key feature of EDM) is needed.
The importance of the need to avoid punishing circumstances is also suggested by the fact that HbA1cFollow-up was correlated with the ability to avoid the most “punishing” deck (Deck A, see Table 3). Additionally, the subgroup of patients with the best ability to avoid Deck A (the “superior” group, Figure 2) appeared to exhibit virtually complete maintenance of HbA1c during the transition year (Figure 5). Although this finding failed to reach a traditional level of statistical significance as defined by p<.05, it represents a viable direction for future research on protective factors during this difficult period in patients’ lives.
There are several important caveats in interpreting the present results. First, it is not clear whether individual differences in EDM observed in this study reflect maturational lags and spurts, or whether they reflect stable temperamental traits. If the former, then intervention for those with poor EDM would be fairly straightforward: Delaying independence from parents until such a time that EDM networks become more mature, or, perhaps even more importantly, delaying employment. In fact, although living arrangement was unrelated to changes in HbA1c and thus may not be an adequate index of independence, employment did appear to have a deleterious impact on HbA1c change; importantly, poor EDM explained HbA1c changes above and beyond employment. On the other hand, if patients with impaired EDM will continue to exhibit a deficit into adulthood, then different intervention approaches would be needed, such as participation in psychoeducational programs.
Second, to increase the clinical utility of the present findings, it would be ideal to empirically identify cutting scores that would maximize sensitivity and specificity to poor outcomes. However, “poor outcome” is not well defined in the literature, at least not as a dichotomous variable. This is even more problematic in the context of change. Thus it was not possible for us to optimize IGT cutting scores for best patient classification, nor was it possible to examine sensitivities and specificities. That said, the literature generally agrees that HbA1c greater than 9.5 (which, at follow-up, typified those who were impaired on IGT-Total100 and on IGTLearning) place patients at considerable risk for health complications (Genuth et al., Reference Genuth, Lipps, Lorenzi, Nathan, Davis, Lachin and Cleary2002; Gorst et al., Reference Gorst, Kwok, Aslam, Buchan, Kontopantelis, Myint and Mamas2015).
Third, in all follow-up analyses, IGT performance was unrelated to glycemic control at baseline, when participants were still in high school and, presumably, experienced higher levels of parental monitoring. The fact that IGT predicted change in glycemic control suggests that poor EDM is likely considerably moderated by context, and that when adequate controls are in place, EDM lapses are less damaging. Furthermore, it is possible that the deleterious impact of impaired EDM on glycemic control is time-limited, and that as young patients become more accustomed to greater independence, they will learn to manage their own temperamental or cognitive risk factors. However, moving away from home alone may not be an adequate index of parental involvement, as living status did not affect the results. Regardless, it is important to avoid over-interpreting our findings as indicators of life-long trajectories of glycemic control.
One of the goals of our study was to examine the most helpful ways of scoring/interpreting IGT performances, in response to ongoing questions about the test’s validity. The results suggest that different approaches to interpretation are indeed differentially sensitive to changes in glycemic control, at least in this population. Averaging across all trials proved to be the best method for identifying individuals who are at risk for glycemic dysregulation over time, whereas classifications based on learning profiles may be more sensitive to overall HbA1c levels. ALhough the latter findings failed to reach statistical significance, likely due to the small number of participants in impaired groups, participants with an impaired learning profile exhibited average HbA1cFolow-up greater than 10.5 (Figure 4), reflecting an extreme risk of health complications.
If replicated with a larger sample, these findings suggest that different IGT scores might tap into slightly different constructs. In fact, past research has suggested that performance on IGT can depend, in part, on other aspects of executive functioning, such as working memory, and can also relate to other deficiencies in emotional processing. Unfortunately, these processes have not been assessed in the present study and thus their contributions to IGT performance and glycemic control cannot be determined. Future IGT research should routinely use multiple scoring methods to facilitate understanding of patterns across age groups, clinical populations, and behavioral outcomes, as well as further examine the constructs measured by IGT by determining the associations of different scores with other related constructs.
An important strength of this study is that it demonstrates the association of EDM with glycemic control prospectively, providing support for the notion that poor EDM contributes to blood glucose dysregulation, rather than the other way around. In the context of this strength, several limitations were inevitable. First, we experienced attrition of approximately 20% from baseline to follow-up, which not only somewhat decreased the generalizability of our findings (especially as it relates to male participants with poorer glycemic control at baseline), but also decreased our statistical power; this may partially explain statistical trends in some analyses. Second, due to participation burden and geographic mobility after high school, we did not reassess IGT on follow-up. Thus, it is not clear whether EDM itself also declines with deterioration in glycemic control.
Lastly, because many late adolescents transfer from pediatric to adult care, it is not always possible to obtain follow-up point-of-care HbA1c data. To maximize our ability to obtain follow-up data, we used mail-in kits, instead of point-of-care assays. Because the mail-in test kits appear to have a slight bias toward lower HbA1c values (.5 on average), using the same method at both time-points is crucial. However, readers may consider adjusting values reported in this study slightly upward when comparing current results to those of studies that rely on point-of-care HbA1c.
ACKNOWLEDGMENTS
We thank the physicians and staff at the Primary Children’s Diabetes Program, Mountain Vista Medicine, Children’s Medical Center Dallas, and the teens and parents who participated in this study. This work was supported by the National Institute of Diabetes and Digestive and Kidney Diseases at the National Institutes of Health (Grant Number R01 DK092939). All authors were free of conflict of interest in contributing to this research. Findings on the association between traditional measures of executive functioning and HbA1c at baseline were reported in our prior work: Suchy, Y., Turner, S. L., Queen, T. L., Durracio, K., Wiebe, D. J., Butner, J., . . . Berg, C. A. (2016). The relation of questionnaire and performance-based measures of executive functioning with type 1 diabetes outcomes among late adolescents. Health Psychology, 35(7), 661–669.